Texas-Housing-Insight-November-2024

Texas Housing Insight November 2024 Summary

November 2024 data dashboard with the following metrics: a 2.2% decrease in total home sales, $336,838 in median home price, a 6.81% increase in mortgage rates, and a 8.9% increase in single-family starts.

Home sales typically cool off by October following the busy summer homebuying months. This year is a little different as sales in both September and October came in higher than they did during the summer. With the sales momentum extending into early fall, November total home sales took an expected seasonal downturn. Housing inventory is on the rise as homes take longer to sell. This more than offsets a decline in new listings (a decline that reflects a more cautious stance among prospective sellers amid higher mortgage rates). Home prices, in the meantime, have remained relatively the same. Interest rates increased for the first time since spring 2024, defying the Federal Reserve’s second interest rate cut on Nov. 7. New single-family construction slowed down in November. Smaller markets outside the “Big Four” metros led the declines in privately-owned housing units authorized by building permits.  

Sales Decrease, New Listings Follow

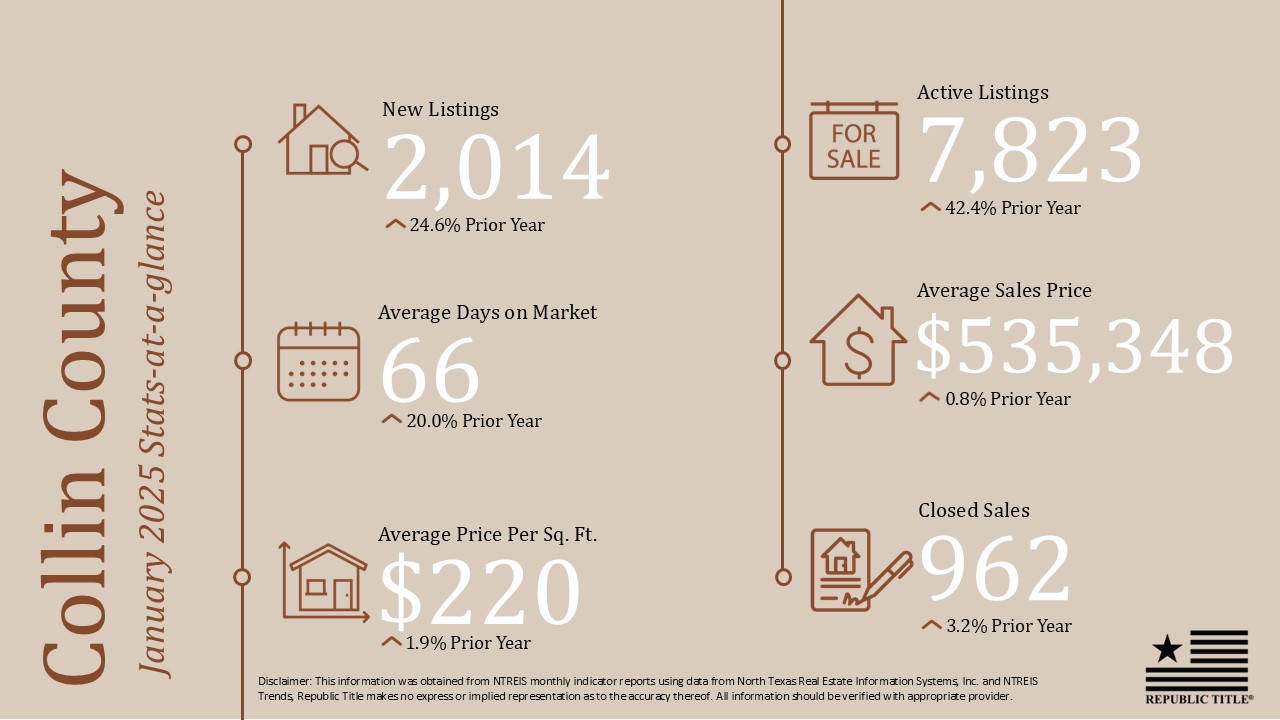
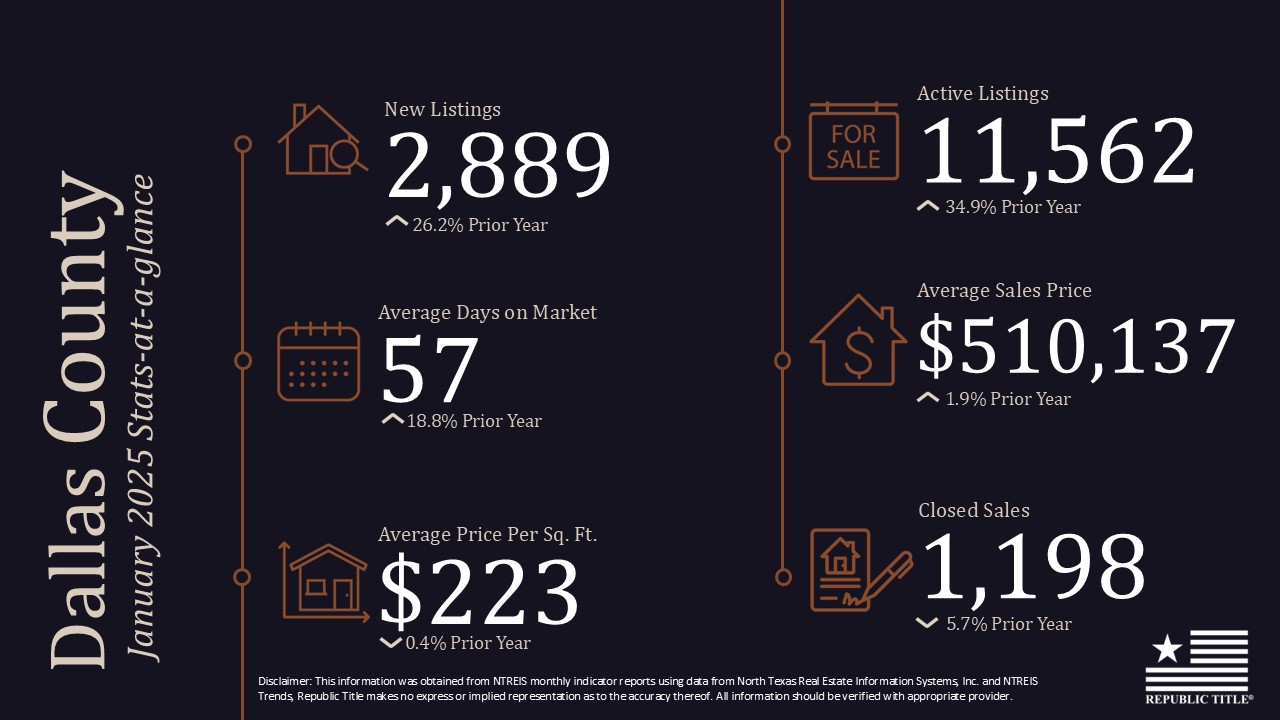
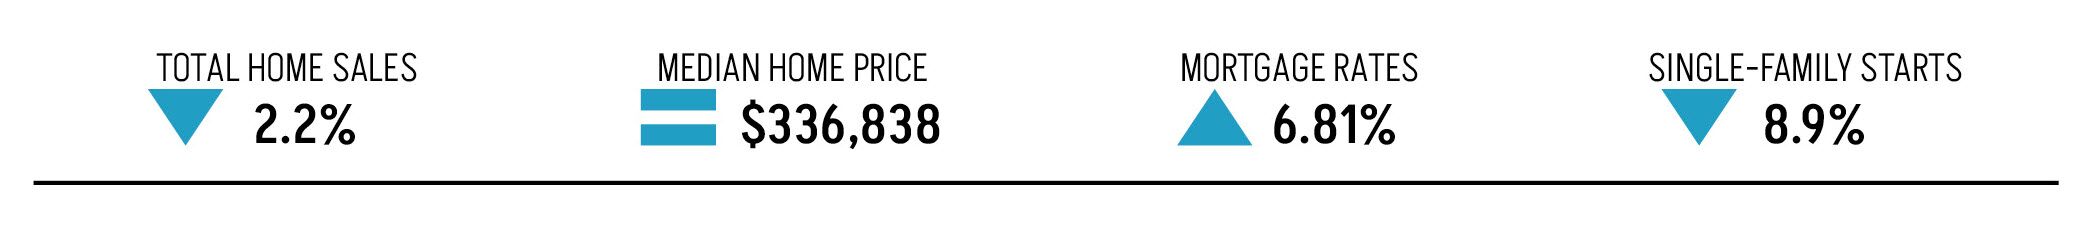
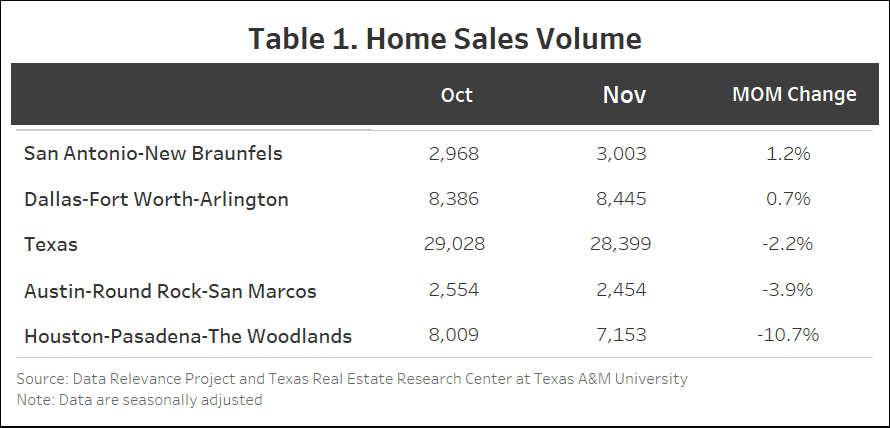
November home sales came in 2.2 percent lower than the previous month at a total of 28,399 transactions, driven largely by a seasonal contraction in the Houston market, where sales dropped 10.7 percent to 7,153. Austin followed with a 3.9 percent decline to 2,454 total sales. Sales were up 1.2 percent in San Antonio, totaling 3,003 transactions, while sales in Dallas remained relatively stable, edging up by 0.7 percent to 8,445 transactions.  

Table 1. Home Sales Volume containing data for October, November and MOM Change for San-Antonio-New Braunfels, Houston-Pasadena-The Woodlands, Texas, Austin-Round Rock-San Marcos, and Dallas-Fort Worth-Arlington

November’s new listings saw a notable decline, reflecting a more cautious stance among prospective sellers amid higher mortgage rates and a seasonal market slowdown. Among the Big Four, Dallas had the most significant month-over-month (MoM) drop, down 8 percent to 11,353 active listing at the end of November. Houston followed with a 3.5 percent decrease (14,022), while San Antonio and Austin recorded more moderate declines of 1.3 percent (4,338) and 1.2 percent (3,742), respectively. The overall contraction in new listings may indicate sellers are adjusting expectations in response to mortgage rates defying the Fed’s interest rate cuts. Following the Fed’s second interest rate cut in November, mortgages rates moved in the opposite direction.  

Statewide average days on market (DOM) edged up by one day to 62 days in November. In Austin, DOM was up from 73 to 75 days. DOM was up by one day in Houston (52) and Dallas (57). San Antonio was the only major metro to see a decrease in DOM, improving from 74 to 73 days, a reflection of increased buyer activity and more competitive pricing in the region. 

Statewide housing inventory was up in November. Total active listings increased by 1.1 percent to an inventory of 124,195 by the end of the month. Among the Big Four, San Antonio and Houston saw inventory rising by 2 percent and 1.8 percent to a month-end inventory of 13,939 and 30,553, respectively. Dallas’ housing inventory remained relatively stable, edging up by just 0.2 percent. In Austin, active listings declined 0.8 percent from the previous month to 10,501 by the end of November.   

Statewide pending listings increased in November by 2.2 percent, rising from 28,340 to 28,971. Across the Big Four, pending listings exhibited mixed trends, reflecting varying levels of buyer activity. Austin led with a 7.9 percent increase, rising from 2,644 to 2,852, suggesting a rebound in buyer interest despite broader market conditions. Houston saw pending listings up 6 percent for a total of 7,770. Pending listings declined in Dallas, down 4.6 percent from 8,491 to 8,101. San Antonio saw a more moderate decline of 2.1 percent, with pending listings decreasing from 3,095 to 3,029.  

Interest Rates Up Again

In November, both Treasury yields and mortgage rates experienced notable increases, defying the Fed’s second interest rate cut on Nov. 7. The average yield on the 10-year U.S. Treasury Bond rose by 26 basis points (bps) to 4.36 percent, reflecting heightened capital market expectations of inflationary pressures building up in the economy. Similarly, the Federal Home Loan Mortgage Corporation’s 30-year fixed-rate mortgage climbed 38 bps to 6.81 percent. 

New-Home Starts Decline

Statewide building permits declined by 10.5 percent from October to November. The declines were led by smaller markets, where November’s privately-owned housing units authorized by building permits were 37.8 percent below October’s. In the Big Four metros, the declines were more moderate: Dallas (9.7 percent), Austin (7.1 percent), Houston (6.7 percent), and San Antonio (5.1 percent). 

Seasonally adjusted statewide single-family housing starts decreased by 8.9 percent since October to 13,037 units. All Big Four metros had a downturn. San Antonio and Dallas had the sharpest decrease at 18.9 percent (941) and 13.4 percent (3,289), respectively. Houston was down by 9 percent (3,925), while Austin fell 7.4 percent (1,445). 

The total value of single-family housing starts climbed from $27.73 billion in November 2023 to $34.51 billion in November 2024. At $12.14 billion, Houston accounted for 35.2 percent of the state’s total starts value. Dallas followed with $9.39 billion (27.2 percent). 

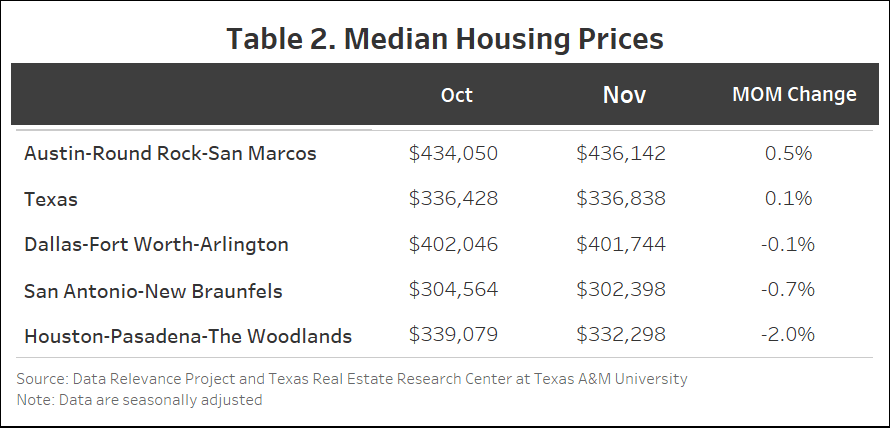
Home Prices Remain Steady

Texas’ median home price remained relatively stable in November, inching down by 0.1 percent from $336,428 in October to $336,838. Among the Big Four, Houston had the most significant decline, with prices falling 2 percent from $339,079 to $332,298. San Antonio followed with a 0.7 percent decrease, from $304,564 to $302,398. Dallas only saw a marginal 0.1 percent decrease from $402,046 to $401,744, indicating relative price stability. Austin recorded the highest price appreciation, rising 0.5 percent MoM to $436,142 amid strong pending listing activities. 

Table 2. Median Housing Prices containing data for October, November and MOM Change for Dallas-Forth Worth-Arlington, Austin-Round Rock-San Marcos, San Antonio-New Braunfels, Texas, and Houston-Pasadena-The Woodlands.

The Texas Repeat Sales Home Price Index (Jan 2005=100), which is a more accurate reflection of home price changes, fell 0.4 percent MoM in November but was up by 2 percent year over year (YoY). Austin’s annual appreciation remains below the state’s average and fell by 0.8 percent YoY in November. 

*All measurements are calculated using seasonally adjusted data, and percentage changes are calculated month-over-month, unless stated otherwise.

Source: Texas Housing Insight | Texas Real Estate Research Center (By Yanling Mayer, Joshua Roberson, and Junqing Wu – February 24, 2025)

Slide1

January 2025 DFW Real Estate Stats

As we move into 2025, the North Texas real estate market continues to show resilience and steady growth. Inventory is expanding, home values remain stable, and buyer activity is picking up across the region. While economic shifts and seasonal fluctuations will shape the market’s trajectory in the coming months, early indicators suggest a solid foundation for another active year in North Texas real estate.

 Key Market Trends by County

  • Collin County saw a 42.4% increase in active listings and a 24.6% rise in new listings, reflecting growing inventory. The average sales price held steady at $535,348 (up 0.8%), while closed sales inched up 3.2%. Homes are taking longer to sell, with the average days on market increasing by 20% to 66 days.
  • Dallas County experienced a 34.9% surge in active listings, coupled with a 26.2% jump in new listings, indicating a strong influx of available properties. Closed sales dropped 5.7%, and the average sales price edged up 1.9% to $510,137. Days on market increased to 57, up 18.8% from the prior year.
  • Denton County continued to grow, with active listings up 32% and new listings rising 19.5%. The average sales price increased by 3.7% to $541,503, while closed sales saw a slight 2.1% bump. The average days on market increased to 64 days, a 25.5% rise.
  • Rockwall County posted a 33.1% increase in active listings and an 8.9% rise in new listings. The average sales price climbed 11.8% to $541,236, and closed sales grew 12.3%. Homes lingered longer on the market, with the average days on market reaching 84, a 33.3% increase.
  • Tarrant County saw a 16.2% increase in new listings and a 33.1% rise in active listings, signaling a broader selection for buyers. The average sales price rose 2.1% to $419,912, while closed sales were slightly down by 1%. Homes stayed on the market for an average of 62 days, up 19.2% year-over-year.

 What’s Next for 2025?

With rising inventory levels and relatively stable price growth, North Texas remains a competitive yet promising market for both buyers and sellers. As we progress through the year, market conditions will be influenced by interest rates, economic trends, and local demand. Will inventory continue to balance the market? Will home values remain strong? The answers will unfold as 2025 takes shape, but one thing is clear—North Texas continues to be a powerhouse in real estate.

At Republic Title, we’re here to help you navigate this ever-changing market with confidence. Whether you’re buying, selling, or investing, our expertise ensures a smooth transaction every step of the way. Here’s to a year of new opportunities in North Texas real estate!

Our stats infographics include a year over year comparison and area highlights for single family homes broken down by county. We encourage you to share these infographics and video with your sphere.

For more stats information, pdfs and graphics of our stats including detailed information by county, visit the Resources section on our website at DFW Area Real Estate Statistics | Republic Title of Texas.

For the full report from the Texas A&M Real Estate Research Center and for NTREIS Local Market reports click here.

Denton County Condo Stats are not available for
January 2025 at this time. 

City fast Facts Website Thumbnail Graphics-12

Spotlight on Plano

Whether you’re a lifelong resident or new to the area, there’s always something new to discover about your neighborhood.  With that in mind, we created a Fast Facts sheet for cities and neighborhoods all over the DFW area. Our DFW Area fast facts have detailed real estate insights, things to do, places to shop and some of our favorite restaurants in each area.

Our first spotlight is the city of Plano. Plano is a vibrant city known for its thriving business community and high quality of life. With a strong economy, excellent schools, and an abundance of recreational activities, Plano offers residents and visitors a diverse range of attractions, from upscale shopping and dining to beautiful parks and cultural events.

Head to our website now to get all the details you need to stay up-to-date and in-the-know about your local neighborhood. Your community is waiting for you! republictitle.com/dfw-area-city-fast-facts

POPULATION


288K

AVERAGE HOUSEHOLD INCOME

$130K

MEDIAN AGE


39

HOUSING


59% OWN
41% RENT

AVERAGE SALES PRICE

$564K

AREA ACTIVITIES & FEATURES

• ARBOR HILLS NATURE PRESERVE
• CHISHOLM TRAIL GREENBELT
• CRAYOLA EXPERIENCE PLANO
• GO APE ZIPLINE & TREETOP
• HERITAGE FARMSTEAD MUSEUM
• INTERURBAN RAILROAD MUSEUM
• THE SHOPS AT LEGACY & LEGACY WEST | SHOPPING & DINING
• THE BOARDWALK AT GRANITE PARK | SHOPPING & DINING
• THE TEXAS POOL
• HISTORIC DOWNTOWN PLANO ARTS DISTRICT
• OAK POINT PARK
• CARPENTER PARK

FAVORITE LOCAL DINING & DRINK SPOTS

• LEGACY HALL • RED TRUCK CAFE • 1418 COFFEE•
• STEVE FIELDS STEAKHOUSE • THE FILLMORE PUB •
• YAO FUZI • THE LATIN PIG • DENSETSU • AI SUSHI •
• BAVARIAN GRILL • COFFEE DEL RAY • FARM + FEED •
• BAR RANCH STEAK COMPANY • BAVETTE GRILL •
• BEARD PAPA’S • BEERHEAD BAR & EATERY •
BEST THAI PLANO • BLACK RIFLE COFFEE COMPANY •
CAFE GECKO • CAFE MAX • CRAFTWAY KITCHEN •
• FRED’S DOWNTOWN PHILLY • HENRY’S ICE CREAM

FAVORITE LOCAL SHOPPING

DALLAS VINTAGE SHOP • HIRSCH’S MEATS •
• APRICOT LANE • BLUE MERCURY • SCOUT + MOLLY’S •
• ELLA BLEU • SWEET HOME BATH & BODY • LYLA’S
DECOR, CLOTHING & MORE • FEATHERED NEST

AVERAGE DRIVE TIMES

DOWNTOWN DALLAS | 26 MINUTES
• DALLAS LOVE FIELD AIRPORT | 27 MINUTES
• DFW INTERNATIONAL AIRPORT | 25 MINUTES
• AT&T STADIUM & GLOBE LIFE FIELD | 37 MINUTES
• DOWNTOWN FORT WORTH | 50 MINUTES

**Print Version

Sweet-Spots-Blog-Graphic2

Favorite Sweet Spots in DFW

Love is in the air! If you’re looking for a sweet treat for your Valentine but don’t know where to go, fret not because we’ve got you covered with our list of our favorite sweet spots in DFW!
 
Pick out one delicious dessert or make it an evening and indulge your sweet tooth at multiple shops.
 
For a full PDF download of our Favorite Sweet Spots in DFW and more resources like this, visit the DFW Area Resources section on our website here: https://www.republictitle.com/dfw-area-resources/

Annie’s Sweets & Treats – FRISCO
BIRD Bakery – DALLAS
Casa Linda Bakery – DALLAS
Chocolate Secrets – DALLAS
Cinnaholic – MULTIPLE LOCATIONS
CocoAndre – DALLAS


Gigi’s Cupcakes – SOUTHLAKE
Detour Doughnuts – FRISCO
Joy Macarons – MULTIPLE LOCATIONS
Kate Weiser – MULTIPLE LOCATIONS
Kessler Baking Studio – DALLAS
Kilwin’s Ice Cream – MULTIPLE LOCATIONS
Smallcakes – MULTIPLE LOCATIONS
Stein’s Bakery – DALLAS
Sugar Bee Sweets Bakery – ARLINGTON

See’s Candies – MULTIPLE LOCATIONS
Sugar Rays Bake Shop – PLANO
Twinkle Donuts – THE COLONY
Unrefined Bakery – MULTIPLE LOCATIONS
Val’s Cheesecakes – DALLAS
Yelibelly Chocolates – ADDISON

City-fast-Facts-Website-Thumbnail-Graphics-Aubrey

Spotlight on Aubrey

Click here for a printable version of the Aubrey Fast Facts and view all DFW Area Fast Facts here.

Whether you’re a lifelong resident or new to the area, there’s always something new to discover about your neighborhood.  With that in mind, we created a Fast Facts sheet for cities and neighborhoods all over the DFW area. Our DFW Area fast facts have detailed real estate insights, things to do, places to shop and some of our favorite restaurants in each area.

Aubrey, Texas, is a small, friendly town located in the heart of North Texas, known for its peaceful rural atmosphere and close-knit community. Offering a blend of countryside charm and modern conveniences, Aubrey provides residents with a quiet place to call home while still being close to the larger cities of Denton and Frisco. With its beautiful landscapes, local events, and family-friendly environment, Aubrey is a perfect choice for those looking for a more relaxed lifestyle in the Dallas-Fort Worth metroplex.

POPULATION

8K

AVERAGE HOUSEHOLD INCOME

$84K

MEDIAN AGE

35

HOUSING

72% OWN
28% RENT

AVERAGE SALES PRICE

$456K

AREA ACTIVITIES & FEATURES

• HISTORIC DOWNTOWN AUBREY
• NATIONAL VIDEO GAME MUSEUM
• SHARKAROSA ZOO
• DUDE PERFECT HQ
• RAY ROBERTS LAKE STATE PARK
• HYDROUS WAKE PARK
• BATTLEFIELD NERF WAR ARENA
• TX TURE FARM
• EPOCH QUEST | INTERACTIVE GAMING
• THE COVE AT LAKEFRONT | INDOOR WATER PARK
• GEMINI PEACH & ROSE FARM

FAVORITE LOCAL DINING & DRINK SPOTS

• UPPER PARK CAFE • LIUIGI’S PIZZA & PASTA • LUCY’S
BAKERY & TACO SHOP • GIULIA’S CAFE • FOODIES IN TEXAS •
• BEBO’S & KATHY’S CAFE • ERNESTO’S FINE MEXICAN • LILO
LEBANESE • GREEN VALLEY KITCHEN • RUBY CATES BAKE &
SHOP • TENDER SMOKEHOUSE • STARWOOD CAFE • FRESH
THAI • JONNY’S PIZZA • PRAIRIE HOUSE RESTAURANT • FISH N
CHIC • CRACKED & CREPE • SUSHI BACHI • LA CIMA
MEXICAN GRILL • WING DASH • CORNER CAFE • GIMME
TACO • BUFF’S GRILL •

FAVORITE LOCAL SHOPPING

• CASEY & CO BOUTIQUE • CHERISHED HOME •
• STONEBRIAR CENTRE • HOLY GRAIL TRADING •

AVERAGE DRIVE TIMES

• DOWNTOWN DALLAS | 67 MINUTES
• DALLAS LOVE FIELD AIRPORT | 65 MINUTES
• DFW INTERNATIONAL AIRPORT | 46 MINUTES
• AT&T STADIUM & GLOBE LIFE FIELD | 65 MINUTES
• DOWNTOWN FORT WORTH | 53 MINUTES

Guide-to-Title-Insurance

A Guide To Title Insurance

A Homebuyer’s Guide to Title Insurance: Why It Matters and How It Protects You

Buying a home is one of the most significant financial investments you’ll ever make. While finding the perfect property is exciting, ensuring you have clear ownership is just as important. That’s where title insurance comes in.

 What Is Title Insurance?

When you purchase a home, you’re not just buying a structure—you’re securing legal ownership, or title, to the property. However, issues with the title can arise, potentially threatening your rights as an owner. A title search is conducted early in the homebuying process to uncover any problems, such as unpaid debts, liens, or disputes over ownership.

To protect against these risks, title insurance professionals examine public records and provide a title insurance policy, ensuring that you have clear ownership. There are two types of title insurance:

  • Owner’s Title Insurance: Protects you, the homebuyer, from potential claims against your property.
  • Lender’s Title Insurance: Protects the lender’s financial interest in your home and is typically required for financing.

 Why Title Insurance Matters

Title insurance plays a crucial role in protecting your investment and ensuring a smooth closing process. Without it, homebuyers could face unexpected legal claims, hidden debts, or even lose their property due to title defects. Some common title issues include:

  • Clerical errors in public records
  • Forgery or fraud in previous ownership transfers
  • Undiscovered liens or unpaid taxes
  • Unknown heirs claiming ownership

A title professional ensures these risks are minimized by conducting thorough research and resolving any issues before you close on your home. Owner’s title insurance is the best way to protect yourself from losing your property.

The Benefits of Title Insurance for Homebuyers

Purchasing owner’s title insurance is a one-time cost that provides long-term protection for as long as you own your home. It offers peace of mind by ensuring:

  • A smooth transfer of ownership
  • Protection from inherited debts or legal claims
  • Financial security against unforeseen title defects

Most homebuyers in the U.S. choose to protect their largest investment with title insurance. It’s a small price to pay for the peace of mind that comes with knowing your home—and your property rights—are secure.

 Ready to Learn More?

At Republic Title, we’re here to help you navigate the homebuying process with confidence. To learn more about title insurance and how it protects you, visit republictitle.com.

Print Version

Class-Calendar-Blog-Header

February Class Calendar

Republic Title is pleased to offer a variety of continuing education classes for our customers. Join us in February for classes including:

The Prospecting Game
If we are not prospecting we are dying and having a traceable, systematic approach to it will help organize and elevate your business. In this class we will discuss an 8-week, step by step program and best practices that will surely elevate you to new heights in your business.
February 11th
10:00 am – 11:00 am
Republic Title – Plano-Allen Office
No CE provided, for informational purposes only

Dodging Contract Danger Zones
This class focuses on specific sections within the TREC 1-4 Family Contract and other related contract forms that licensees should have a clear understanding of in order to steer clear of potential challenges.
February 12th
10:00 am – 11:00 am
Zoom

Death, Divorce & Real Estate
Join us to learn important laws surrounding death and divorce such as separation, homestead issues, community property and probate.
February 19th
10:00 am – 11:00 am
Zoom

Become Google Great
Learn about numerous sites and tools, all from Google, that will give you a marketing edge. Many who have attended the sessions have applied what they have learned to add over $100K annually to their bottom line. Become a better search engine-optimized business owner. Become….Google Great!
February 26th
9:30 am – 12:30 pm
Republic Title – Park Cities Office

Get on the 1st Page of Google in Days
One of the most powerful elements that Google offers is MyMaps. This workshop will teach you everything that you need to know about creating a map and give you plenty of time to apply it to your business.
February 27th
10:00 am – 12:00 pm
Republic Title – Corporate Office

Residential Education | REPUBLIC TITLE