In April 2024, real estate activity across North Texas showed distinct trends, both in similarities and differences.
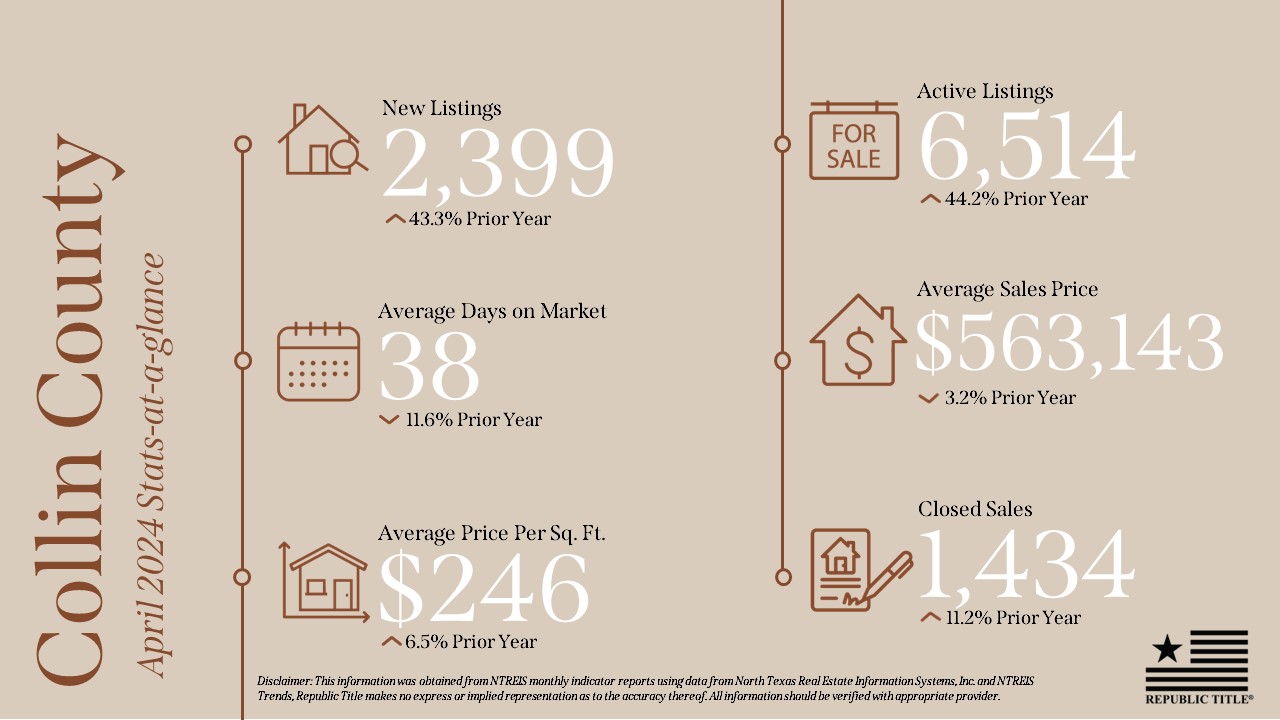
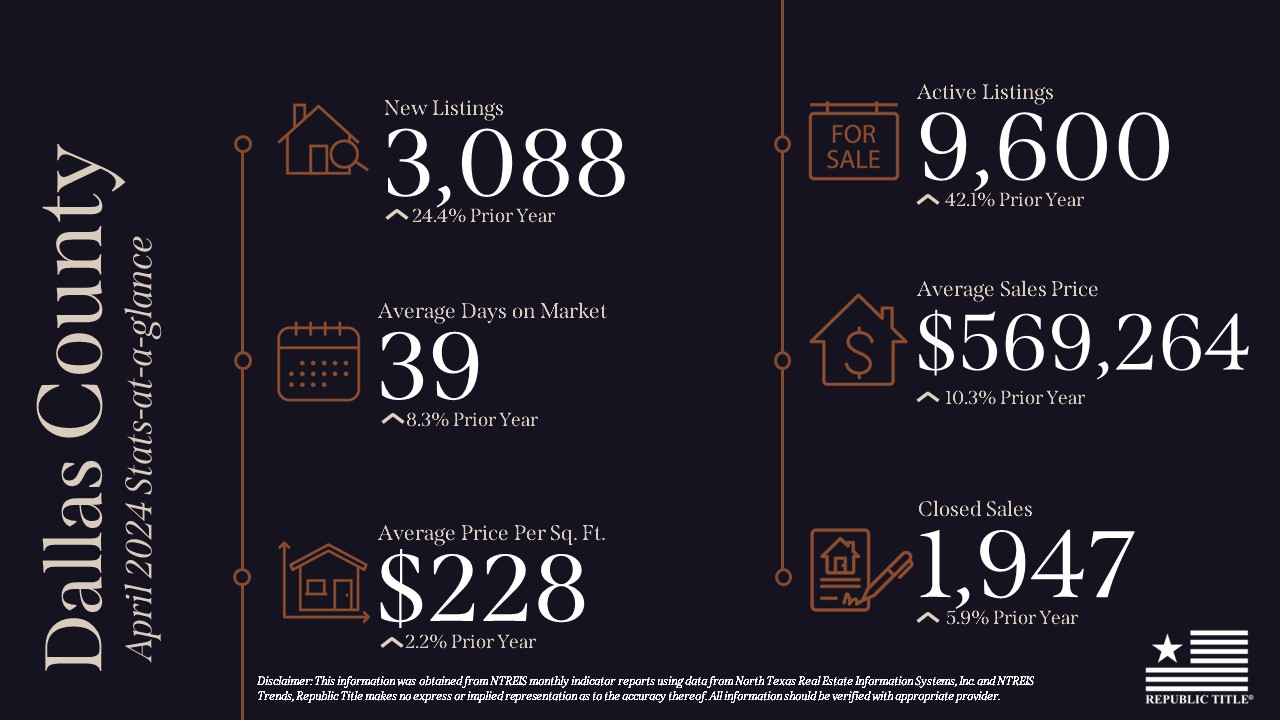
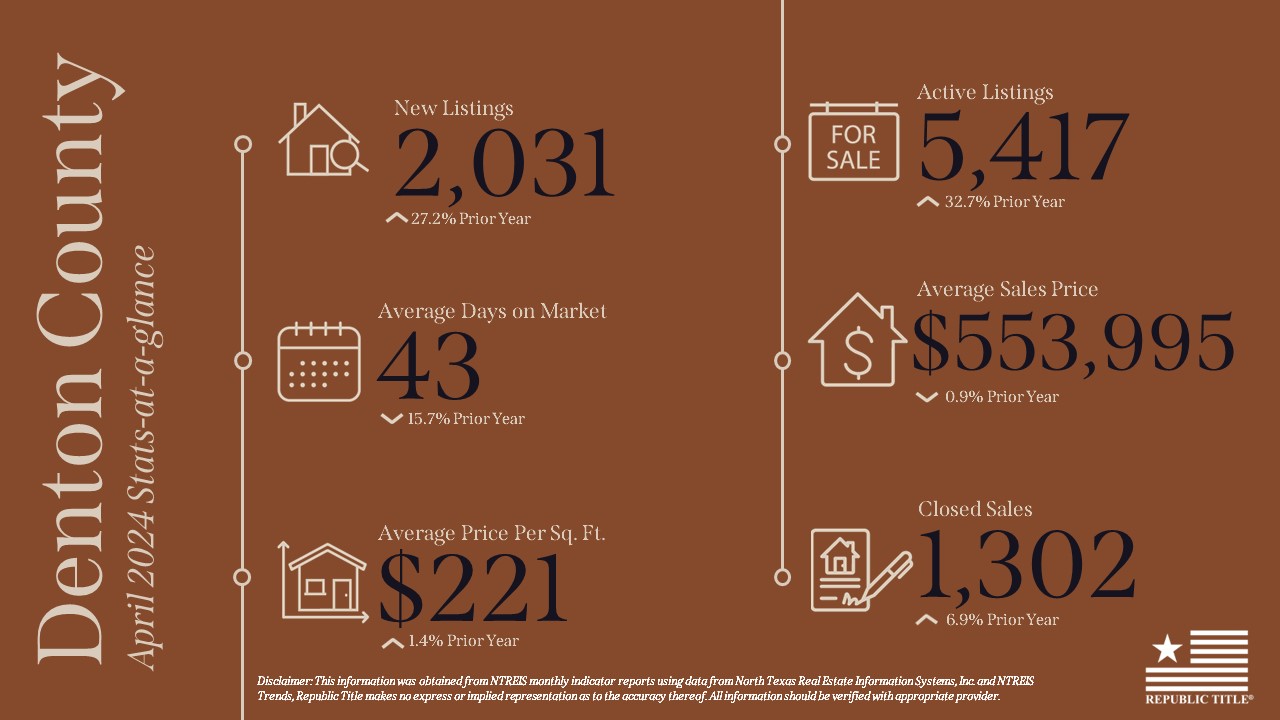
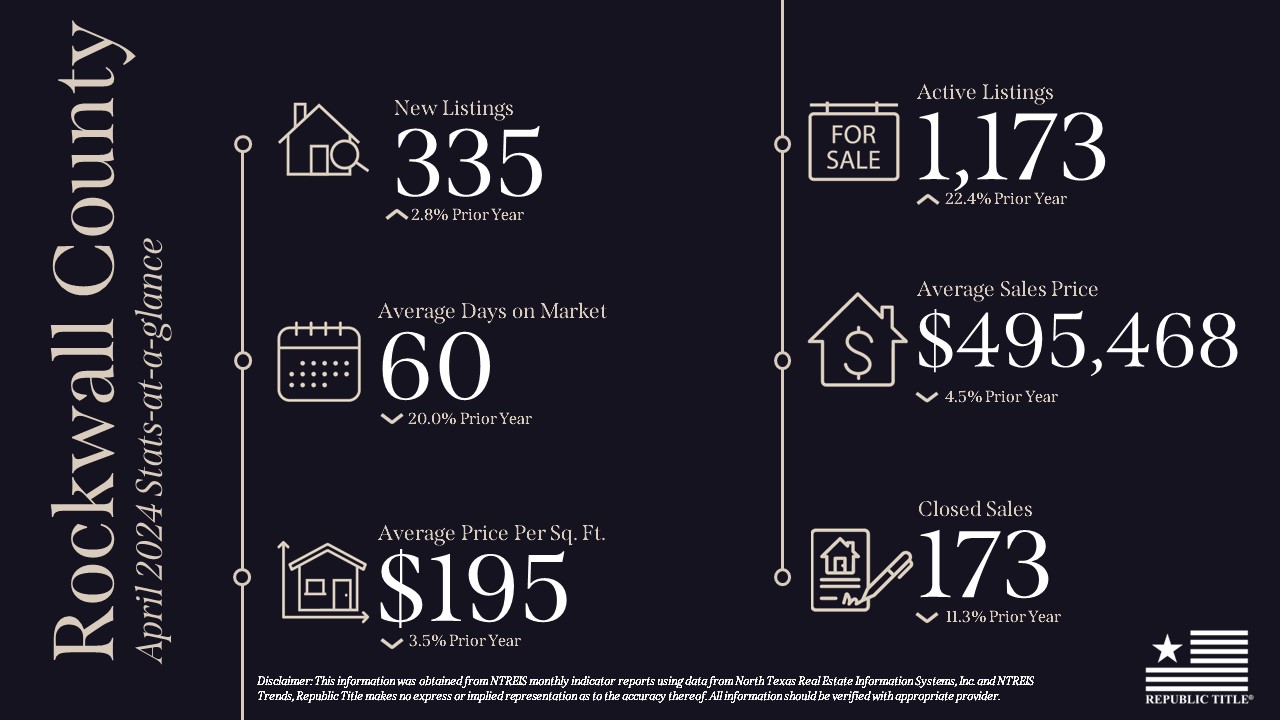
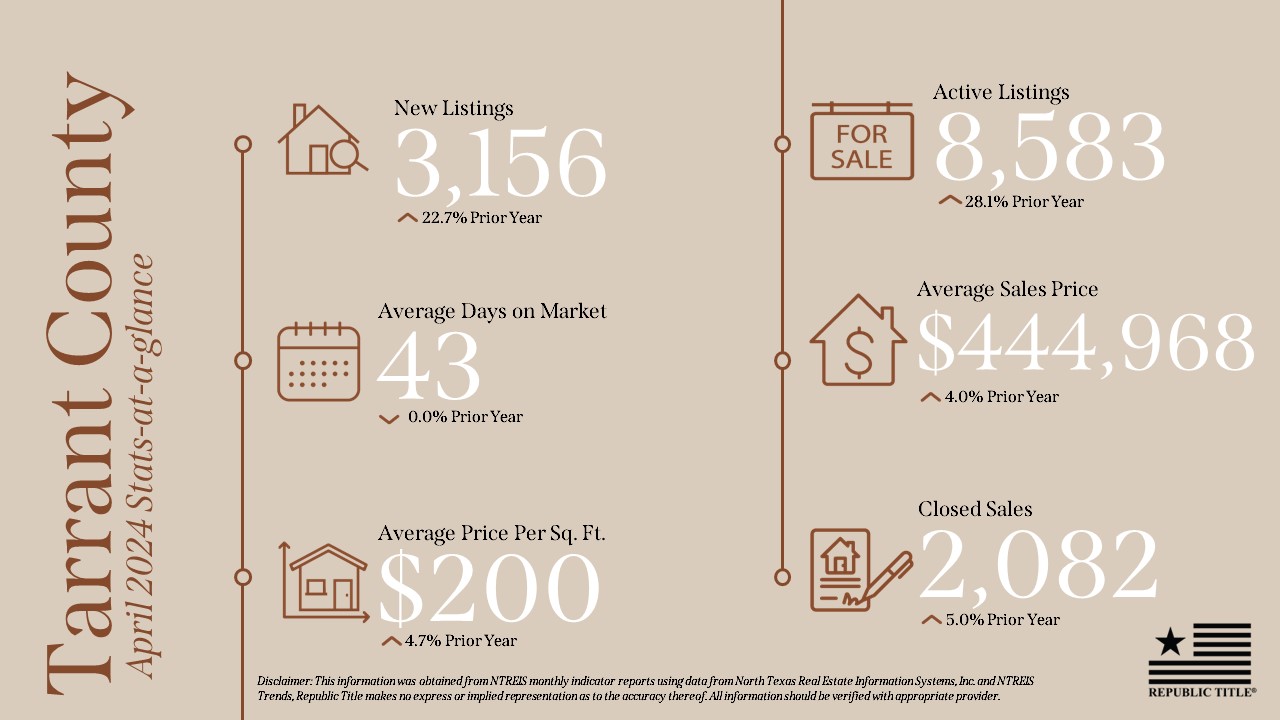
New listings surged in each county, with Collin County experiencing an impressive 43% increase, followed closely by Denton County at 27%, Dallas County at 24%, Tarrant County at 22%, and Rockwall County at 2.8%.
While Collin County saw a notable 11% decrease in average days on market, Denton County experienced the most significant decline at 15%. Conversely, Dallas County witnessed a slight 8.3% increase, while Tarrant County remained stable.
Active listings soared across the board, ranging from a 22% to 44% increase. While we are still not in a balanced market, this higher inventory will help prospective buyers.
Dallas County boasted the highest average sales price at $569,264, marking a notable 10% increase, while Tarrant County saw a more moderate 4% rise, reaching $444,968.
In summary, the real estate scene in North Texas reflects the region’s rapid population growth. Recent data shows that Dallas-Fort Worth and Collin County have experienced significant increases in population, highlighting the dynamic nature of the market. Despite differences between counties, such as varied trends in listings and prices, the overall picture is one of resilience and evolution. Staying informed is key for navigating this ever-changing landscape effectively.
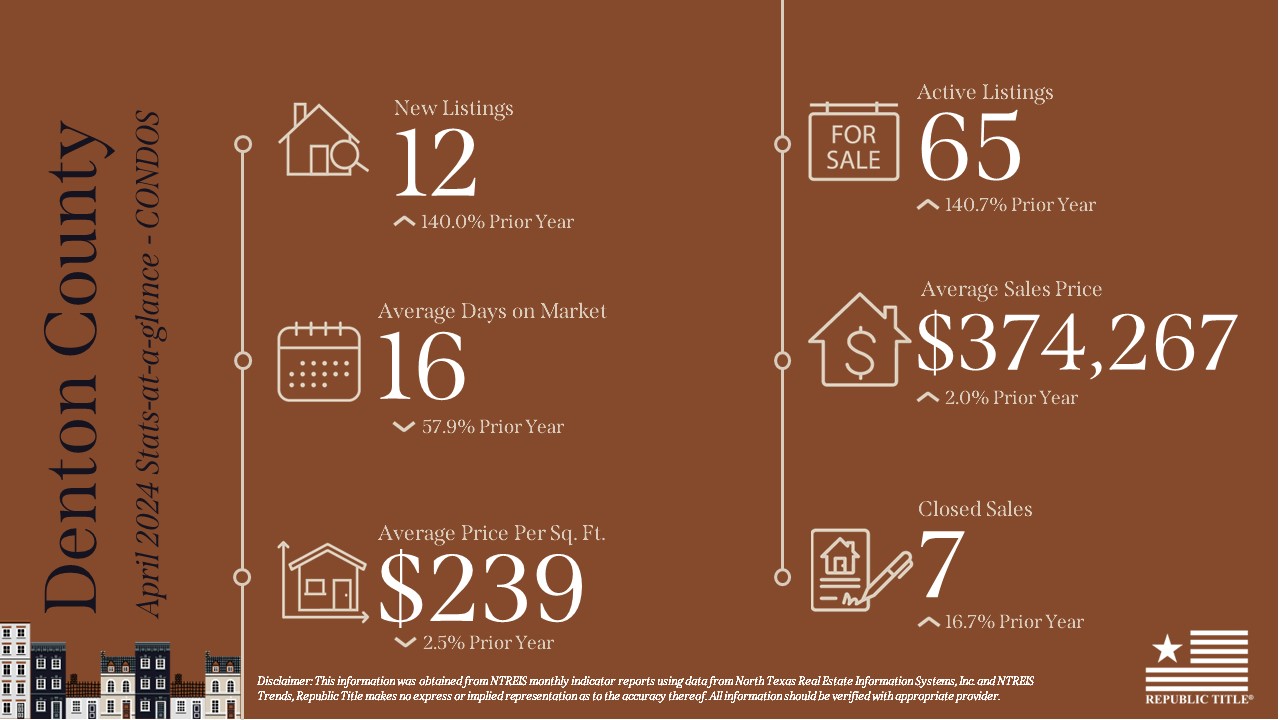
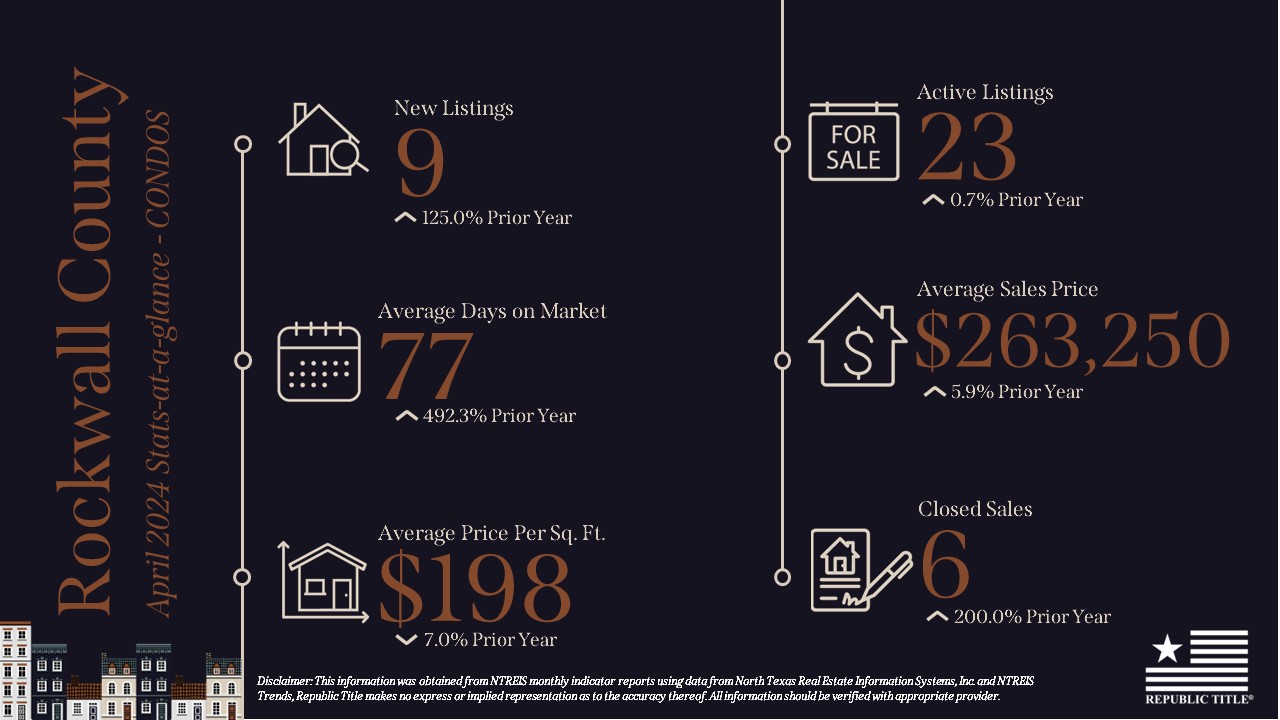
Our stats infographics include a year over year comparison and area highlights for single family homes broken down by county. We encourage you to share these infographics and video with your sphere.
For more stats information, pdfs and graphics of our stats including detailed information by county, visit the Resources section on our website at DFW Area Real Estate Statistics | Republic Title of Texas.
For the full report from the Texas A&M Real Estate Research Center, click here. For NTREIS County reports click here.