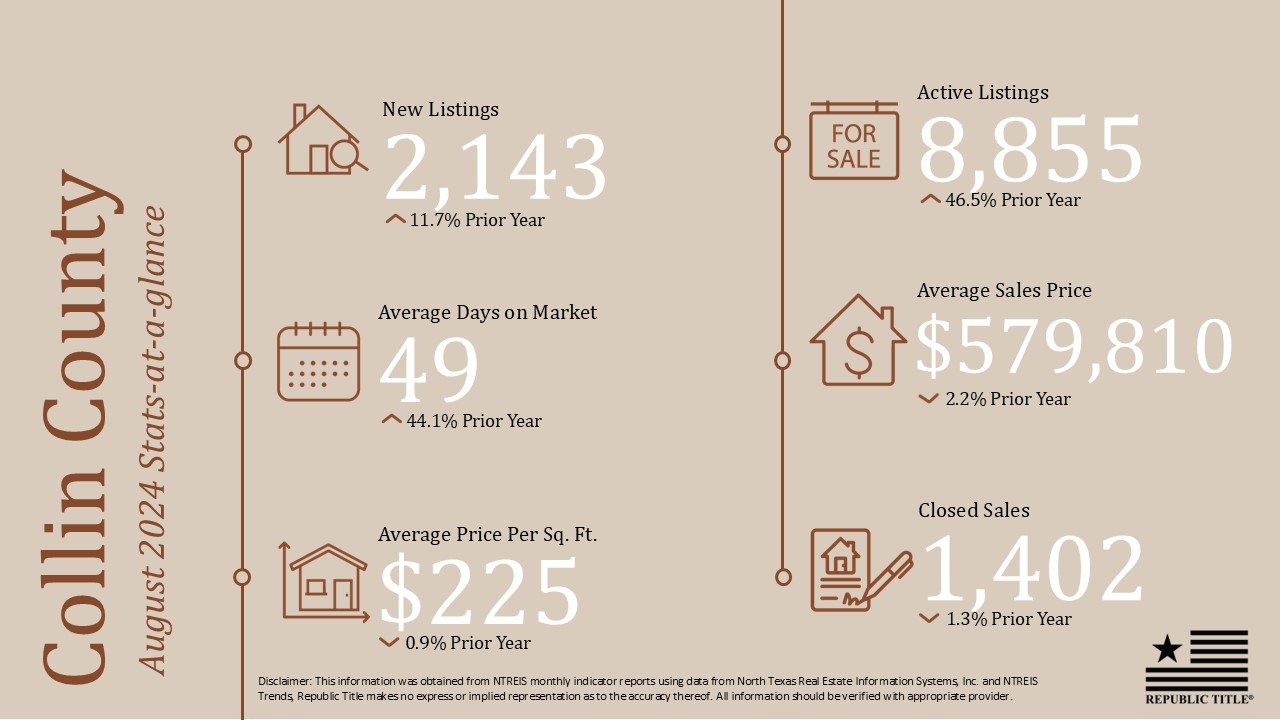
In 2024, the North Texas real estate market has shown notable changes compared to 2023, with all major counties experiencing increases in new listings and active inventory.
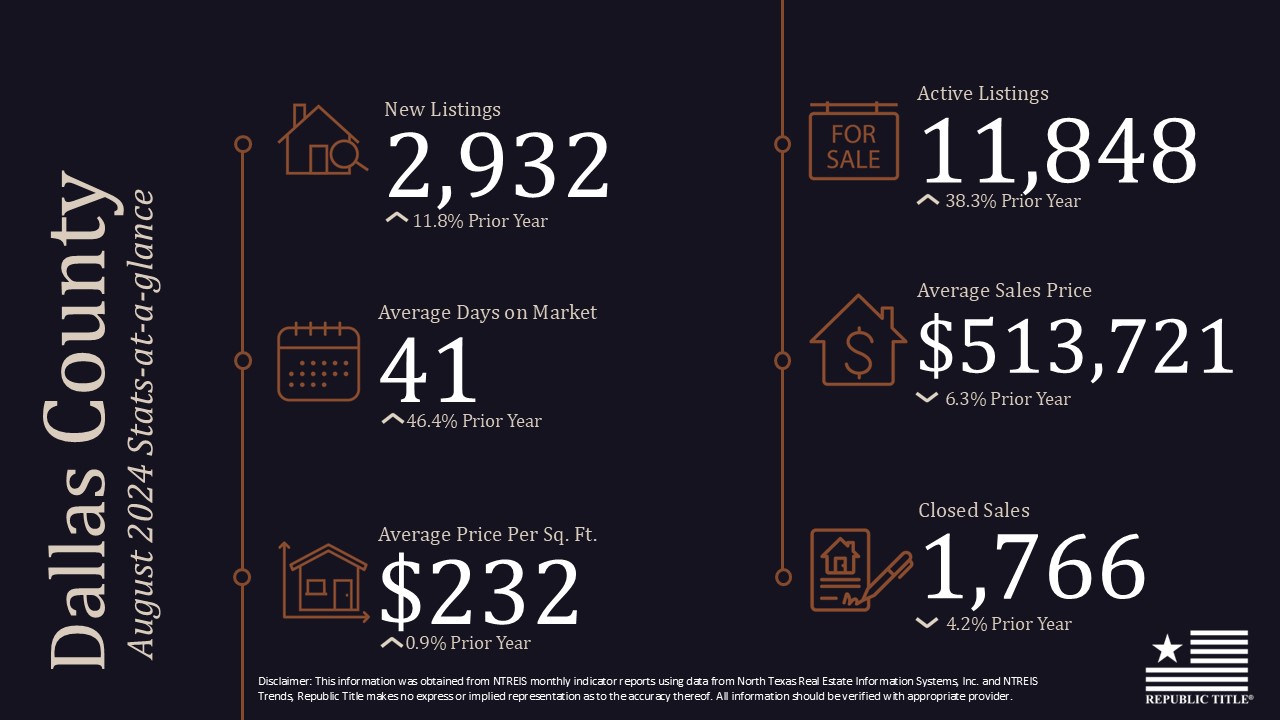
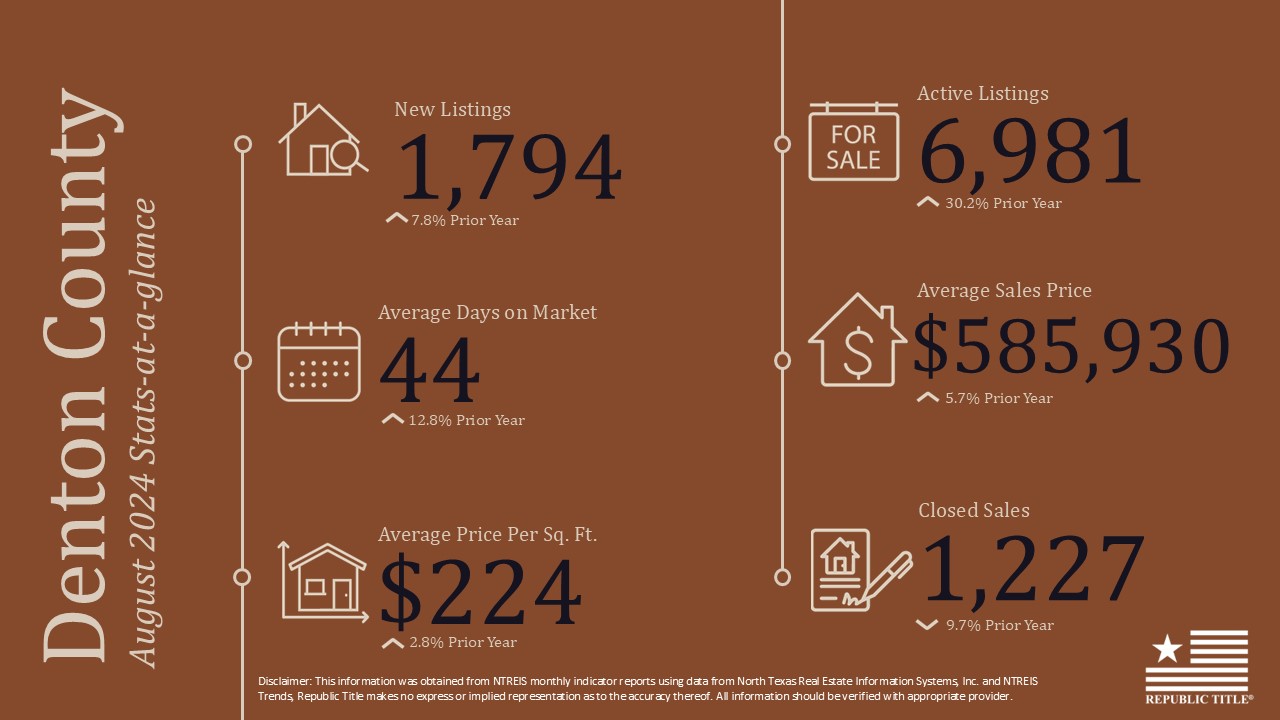
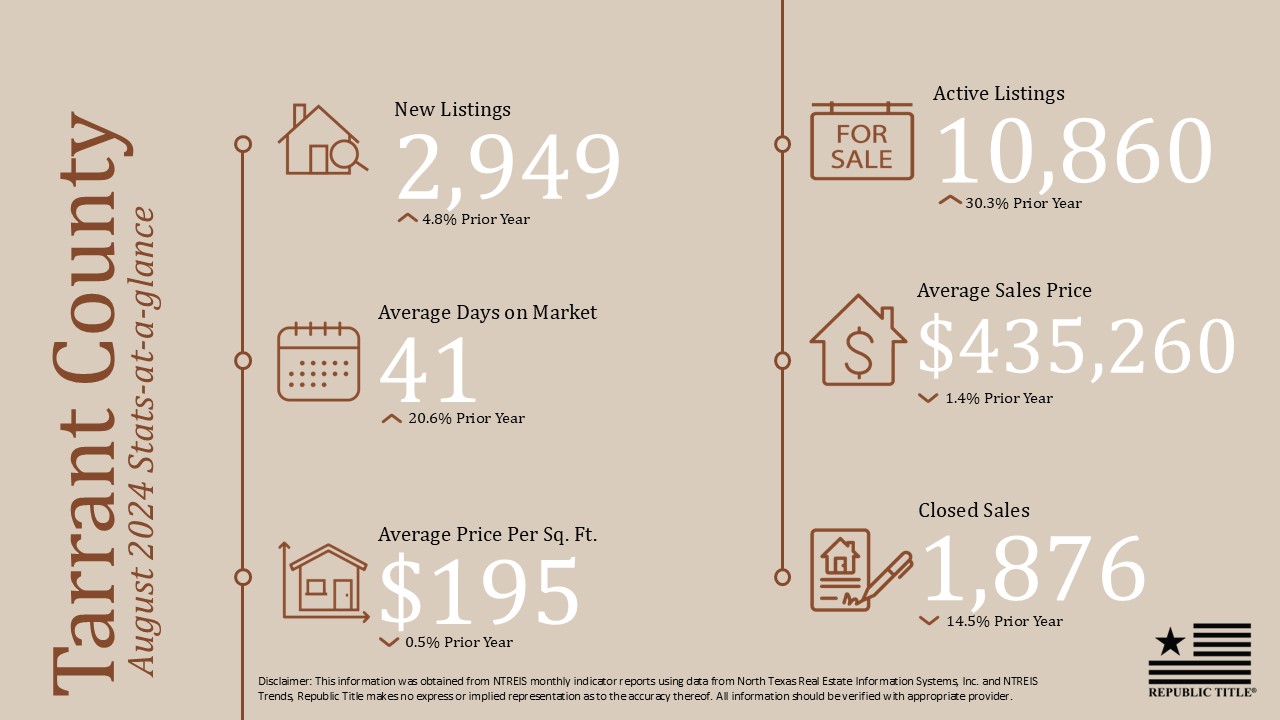
In Collin County, new listings have risen by 11.7%, while the average days on market have increased significantly by 44%. Active listings in this county have surged by 46.5%, indicating a more favorable environment for buyers. Dallas County has seen a very similar trend, with new listings up by 11.8% and the average days on market rising by 46.4%. Tarrant County and Denton County have experienced smaller increases in new listings at 4.8% and 7.8%, respectively. The average days on market in this county have increased by 20.6% in Tarrant County and 12.8% in Denton County. An increase in active listings suggests a more favorable environment for buyers but longer days on market may mean that sellers need to adjust their pricing expectations.
A significant development influencing the market is the recent Federal Reserve rate cut announced on September 18th. This decision may have far-reaching implications for mortgage rates and overall buyer sentiment. As we approach the fourth quarter of this year, it will be interesting to see how this rate cut affects buyer activity and market dynamics in North Texas.
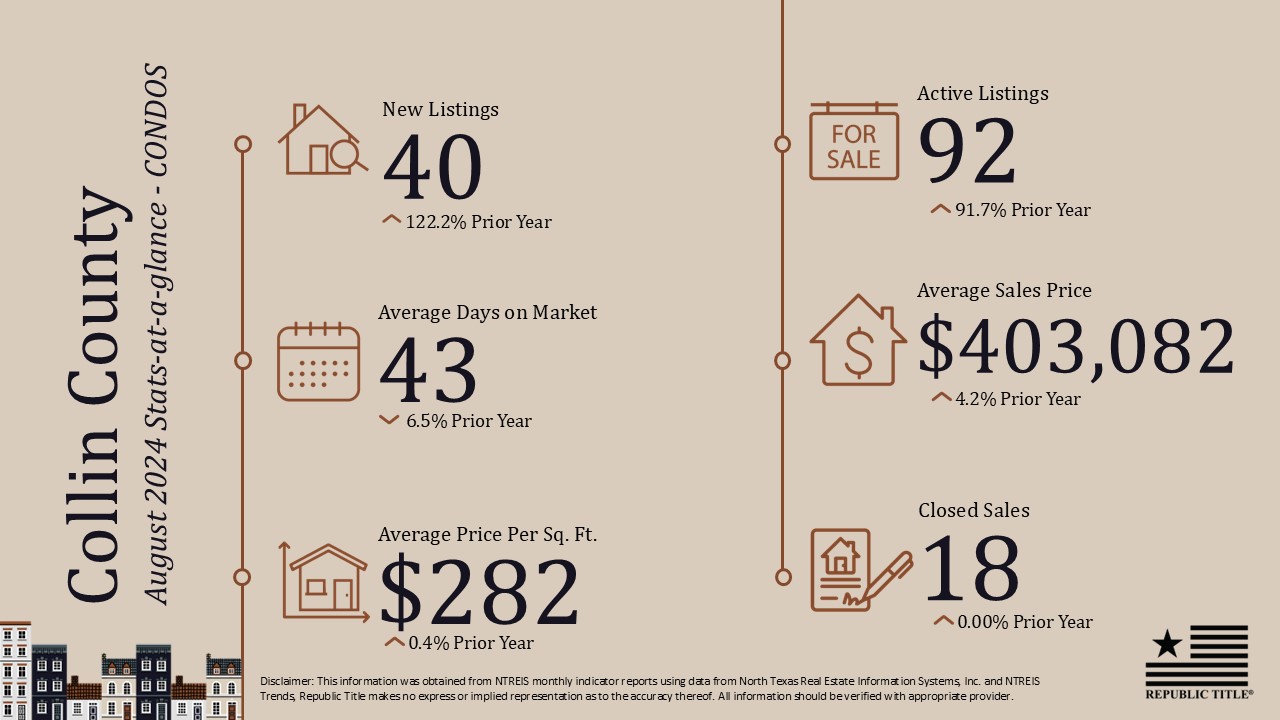
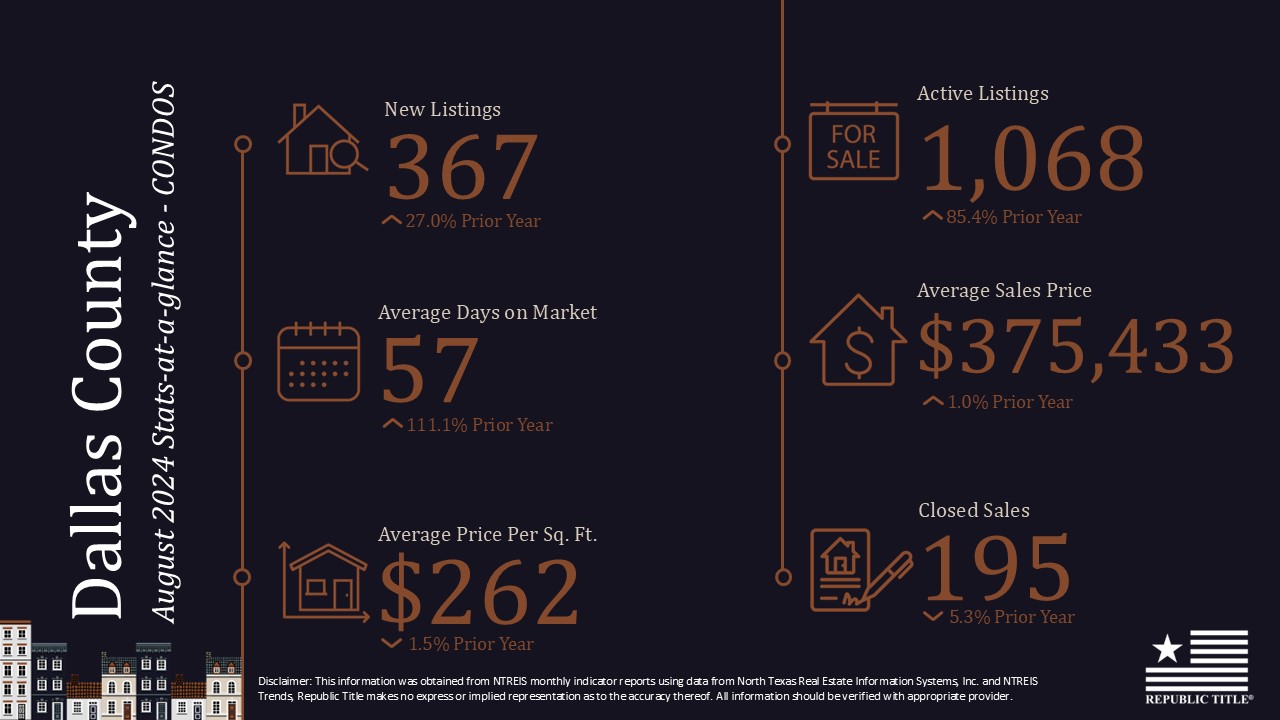
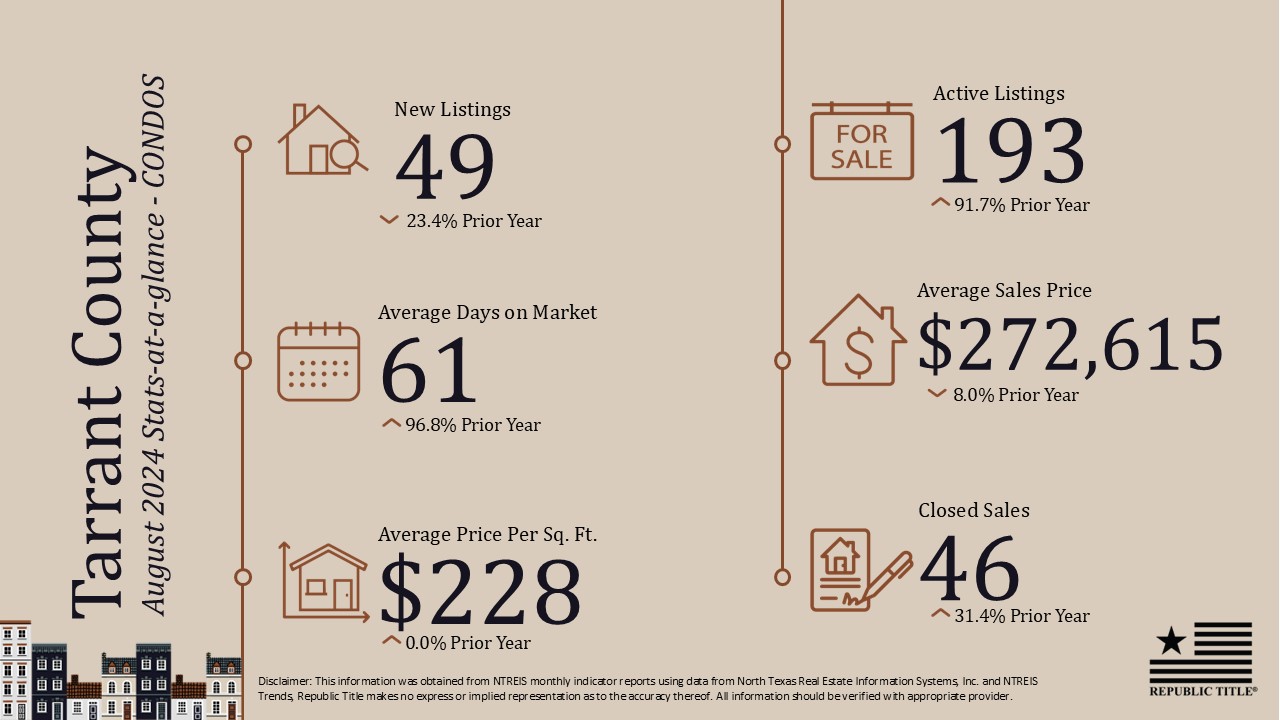
Our stats infographics include a year over year comparison and area highlights for single family homes broken down by county. We encourage you to share these infographics and video with your sphere.