Republic Title is pleased to offer a variety of continuing education classes for our customers. Join us in January for classes including:
Contract Forms Update
Join us for an overview of the latest TREC contract changes which become mandatory February 1, 2023.
January 5th
10:00 am – 11:00 am
Zoom
Simplifying Goals for Overachievement
Most business and personal development trainers have overused goal-setting. Small Business Owners/ Real Estate Professionals either give cursory effort to setting goals or they overwhelm themselves with detail and prevent their own success. Goal-setting has become an obstacle rather than a help to many. This course will help the agents identify their best “timeline” for achievement, identify the issues within traditional goal-setting techniques that have become obstacles and look at 2 different techniques for truly setting goals that are not only achievable but exceed-able.
January 10th
10:00 am – 11:00 am
Zoom
Tax Planning Program Specifically for Real Estate Agents
Join us for a Lunch and Learn with special guests from Greenlight Tax Group. They’ve designed a tax planning program specifically for REALTORS®. They will share strategies to help you minimize your tax liability and keep more of what you make year after year. Please register in advance, as seats are limited.
January 11th
11:30 am – 12:30 pm
Republic Title Park Cities
Contract Forms Update
Join us for an overview of the latest TREC contract changes which become mandatory February 1, 2023
January 11th
2:00 pm – 3:00 pm
Zoom
Contract Forms Update
Join us, in-person, for an overview of the latest TREC contract changes which become mandatory February 1, 2023.
January 17th
11:00 am – 12:00 pm
Caddo Office Suites – McKinney
Escape Hatches for Buyers
In this class licensees will become familiar with specific conditions & contingencies within the contract and related addenda that, if not adhered to, could result in a Buyer’s valid termination of the contract.
January 19th
10:00 am – 11:00 am
Zoom
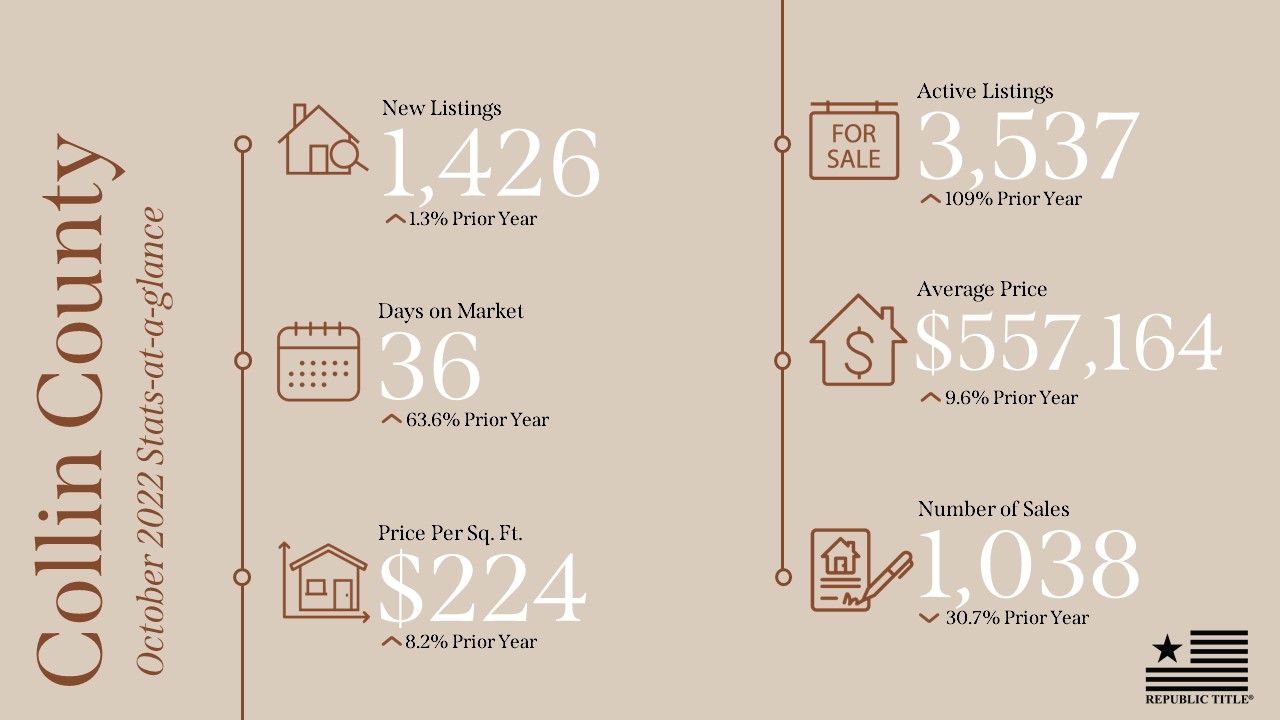
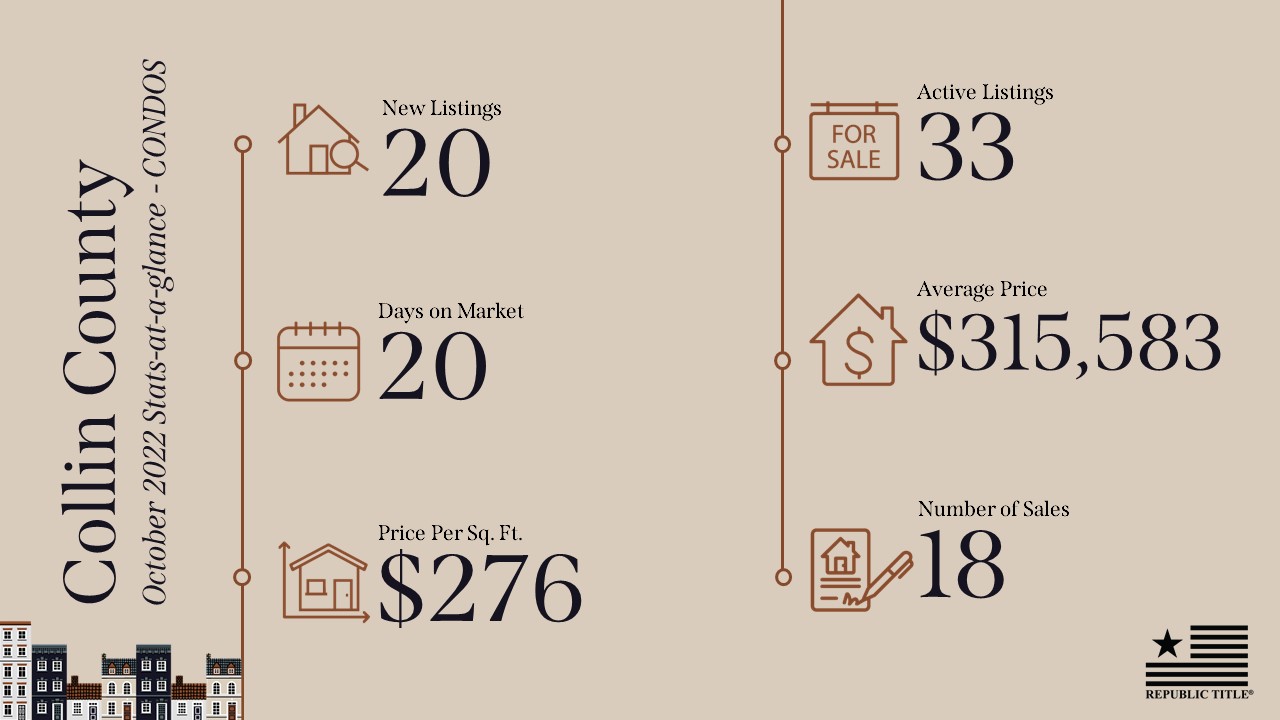
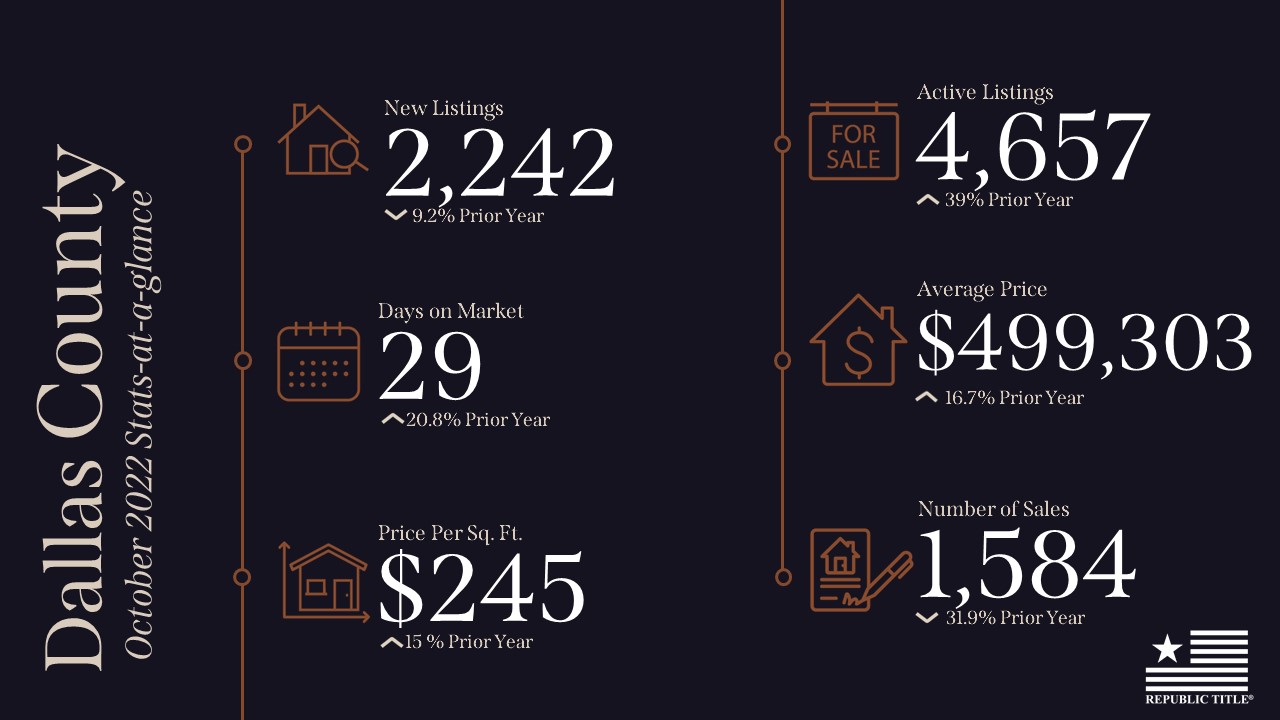
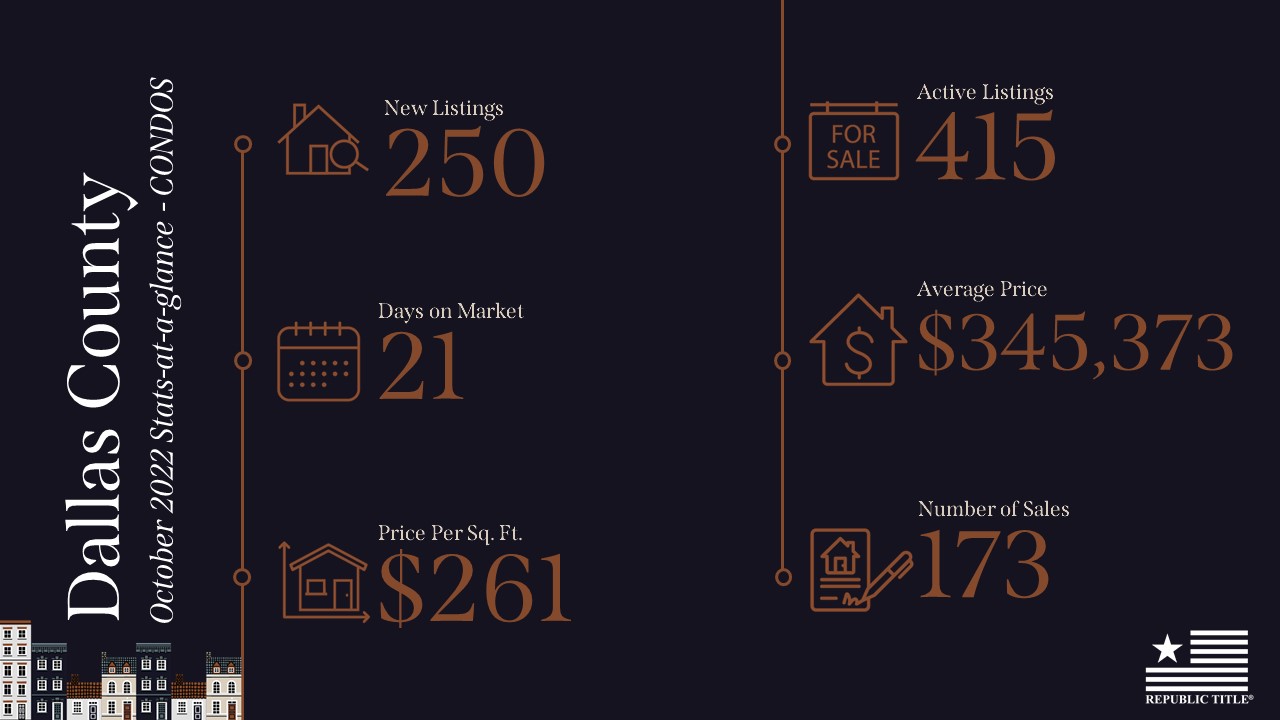
DFW Stats and Trends at your Fingertips
Successful agents know their local markets. Whether used in a casual meeting, a listing presentation or on social media, knowing how to produce market reports is essential. Join us to learn how to generate current and relevant monthly/annual stats using all the tools available to you through NTREIS.
January 19th
11:30 am – 12:30 pm
Zoom
Contract Forms Update
Join us for an overview of the latest TREC contract changes which become mandatory February 1, 2023
January 20th
10:00 am – 11:00 am
Zoom
It’s All Foreign to Me
This class will cover many areas of a transaction involving a non-US citizen including Foreign Investors Real Property Tax Act (FIRPTA), Foreign Wills, Mexican Matricula Consular and Foreign Acknowledgments.
January 24th
10:00 am – 11:00 am
Zoom
Hit The Road With The MLS-Touch App
Deals are made on the road. MLS Touch is the most advanced Mobile MLS app for agents! Come to this class to learn how to use this tool like a pro from the first time you log in. Seamless integration with Matrix, OneHome Portal, Realist Tax and more. Set up your own branded app to share with clients and on social media.
January 24th
1:00 pm – 2:00 pm
Caddo Office Reimagined – McKinney
Dominate Your Neighborhood Using Realist Tax
Become an expert on your neighborhood by learning how to efficiently use Realist® Tax, available in your NTREIS Matrix dashboard, to its full potential!
In this class, you’ll learn how to use Realist® Tax to:
– Research listings and off-market property information
– Assess market conditions and trends
– Identify comparable sales
– Market to buyers and sellers
– Create custom exports for spreadsheets and mailing labels
January 25th
10:00 am – 11:00 am
Zoom
Tax Planning Program Specifically For Real Estate Agents
Join us for a Lunch and Learn with special guests from Greenlight Tax Group. They’ve designed a tax planning program specifically for REALTORS®. They will share strategies to help you minimize your tax liability and keep more of what you make year after year. Please register in advance, as seats are limited.
January 25th
11:30 am – 12:30 pm
Republic Title Park Cities
Contract Forms Update
Join us for an overview of the latest TREC contract changes which become mandatory February 1, 2023
January 26th
2:00 pm – 3:00 pm
Zoom