Renting-to-buying

Is This The Year You Switch From Renting To Buying?

With rents on the rise this could be the perfect time for you to buy; but here’s what you need to consider first:

ADVANTAGES OF BUYING…

  • By maintaining regular mortgage payments, your credit score will increase over time.
  • If you itemize deductions, you could lower your federal tax liability by taking the mortgage interest deduction.
  • When you buy a house, you will know that the mortgage rate for the 5 to 30 years is going to be the same every month. Rent may continue to increase each year.
  • With each payment, you will build equity and increase the amount of total home ownership.
  • There may be down payment programs available in your area that can help you purchase your first home.

YOU SHOULD CONSIDER BUYING IF…

  • You want to build wealth.  Investing into real estate is the fastest way to add zeros to the end of your net worth.
  • You want to settle down, build community and know you will be in the same city or town for at least 2 years.
  • You want to invest your income into property that will hopefully provide you with a payoff should you decide to sell in the future.

YOU SHOULD KEEP RENTING IF…

  • You need flexibility and don’t want to commit to staying in the same location for the foreseeable future.
  • You have limited income or are unsure about your current job.  Renting allows you the flexibility to downsize 

If you are thinking about buying a home, reach out to your local Realtor to get started.

*Print version


Class-Calendar-Blog-Header

September Class Calendar

Republic Title is pleased to offer a variety of continuing education classes for our customers. Join us in September for classes including:

The Real Deal – Mastering the TREC One to Four Family Residential Contract
This class will cover the basics of the Contracts and Addenda you’ll need to submit each time you write an offer. We will walk through the TREC 1-4 Family Contract and learn about the parts that can make or break your offer so that you can be prepared to write the strongest contracts possible for your clients.
September 6th
10:00 am – 11:00 am
Zoom (This class is offered for informational purposes only, TREC CE is not available.)

Back-up, Contingent and Multiple Offers
This class will prepare licensees to handle the unique aspects of backup, contingent and multiple offer transactions by reviewing pertinent TREC addenda along with critical dates and deadlines. APPROVED TREC CONTRACT-RELATED COURSE
September 8th
10:00 am – 11:00 am
Zoom

The Real Deal – Getting to Know Lender Products
September 13th
10:00 am – 11:00 am
Zoom (This class is offered for informational purposes only, TREC CE is not available.)

Social Media Content Planning 101
All good social media begins with a plan. Join us to learn how effective content planning and execution will keep you top of mind with your sphere and help you win more business. In this class, you will learn tips for social media content planning, where to find great content resources, and planning tools to help you organize your social media content calendar.
September 14th
10:00 am – 11:00 am
Republic Title Park Cities

Is This Homestead and Why Do Title Companies Care?
Homestead rights can be very confusing! This class will help licensees understand how the State of Texas views homesteads and what factors influence the title company’s underwriting decisions.
September 15th
10:00 am – 11:00 am
Zoom

The Real Deal – Mastering Your MLS Dashboard
In this class we’ll explore the NTREIS MLS Dashboard and you’ll learn about all the vital tools that can help grow your business and some basic tips on how to get started.
September 20th
10:00 am – 11:00 am
Zoom (This class is offered for informational purposes only, TREC CE is not available.)

Attract New Clients using MLS Tools

Join us and discover a number of ways to use the tools provided by the MLS to help with consumer interest which can likely turn into sales and full-fledged customers.

In person only. NOTE: This class will be taught hands-on. If you would like to follow along during class, please bring your own laptop* (*smart phones and iPads will not work).
September 22nd
10:00 am – 12:00 pm
Republic Title Southlake

Taxation and the Real Estate Agent
This class will cover issues to help REALTORS® with their personal taxes, with removing Federal Tax Liens when closing sales, and with IRS problem they or their client may have. Some of the topics discussed in this one-hour class include: Tips on Keeping Records & Recommended Forms to File, Tax Deductions You Should be Taking, How to Make Estimated Taxes Work with your Cash Flow, Tax Areas of Special Interest to REALTORS®, and How to Use the Home Office Deduction.
September 22nd
Lunch – 11:30 am – 12:00 pm
Class – 12:00 pm – 1:00 pm
Republic Title Preston Frankford 

Mapping Tools in Matrix
One of the strongest tools available to NTREIS MLS Subscribers is the mapping tool in Matrix, but are you using it to its fullest ability? In this class, licensees will explore all the map tool functions in Matrix so you can create powerful searches for your clients who want to live in specific neighborhoods, near points of interest or certain distances to where they work.
September 23rd
10:00 am – 11:00 am
Zoom 

Appraisals 201 – Perfecting the CMA Process – Presented by Supreme Lending
Take the guesswork out of the CMA process by learning how to make adjustments from an appraiser’s point of view. This one hour class will be presented by Sean Bone of Supreme Lending.
September 27th
10:00 am – 11:00 am
Republic Title Southlake

The Real Deal – zipForm and Digital Signatures
In this class we’ll take a look at the technology tools that enable real estate agents to quickly and efficiently create digital transaction files, complete and fill in contract details, attach documents and even get them electronically signed by buyers, sellers and other parties involved in a real estate transaction.
September 27th
10:00 am – 11:00 am
Zoom (This class is offered for informational purposes only, TREC CE is not available.)

To see a current list of available classes and to register, please visit www.republictitle.com/residential-education.

Website-Graphics-School-Ratings

2021-2022 DFW Area School Ratings

The Texas Education Agency (TEA) recently released 2022 A–F accountability ratings for districts and campuses, the first to be issued since 2019 due to two years of COVID-related pauses. 1,195 districts and 8,451 campuses were rated this year, with returns showing promising signs of progress in Texas’s efforts to catch students up academically. Driven by significant gains in student academic growth, 2022 saw 25% of districts and 33% of campuses improve their letter grade from 2019.

Established by House Bill 22 during the 85th Texas Legislature, the A–F accountability system provides educators, parents, and communities with a transparent view of the academic performance of Texas public schools based on three domains: Student Achievement, School Progress, and Closing the Gaps. This year, to align with Senate Bill 1365, districts and campuses received an A, B or C rating or were assigned a label of Not Rated: Senate Bill 1365, both overall and in each domain. This Not Rated: Senate Bill 1365 label was applied when the domain or overall scaled score for a district or campus was less than 70. 42 districts and 564 campuses received this label. 

To view the accountability ratings for DFW area districts and campuses, download our School Accountability Ratings guide.

Source: tea.texas.gov


Housing-Insight-June-2022

Texas Housing Insight June 2022 Summary

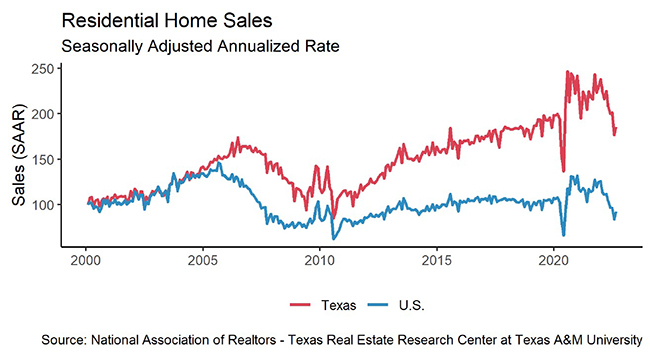
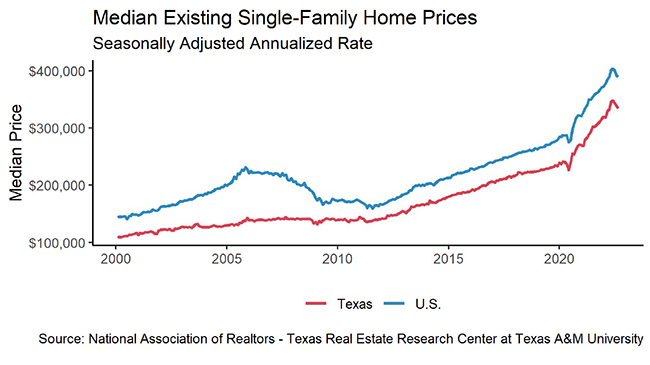
Texas’ housing market continues to cool as sales volume declines and housing inventories rise. While the pace of new listings begins to overcome housing sales, home prices are still elevated due to the tremendous housing pressures realized after the start of the COVID-19 pandemic. Even though home prices are still high, price growth is now retreating, providing a respite for potential buyers.

Supply*

According to Zonda, supply-side activities at the earliest stage of the construction cycle flattened at first quarter levels as inventory losses in Austin’s vacant developed lots (VDLs) offset gains in Dallas, Houston, and San Antonio. The number of new VDLs in Austin shrank 24 percent from last year’s quarterly average. Lot development in the $300k-$500k price cohort composed half of Austin’s total VDL investment, but it saw a double-digit reduction quarter over quarter (QOQ) while the same investment cohorts in other metros advanced.

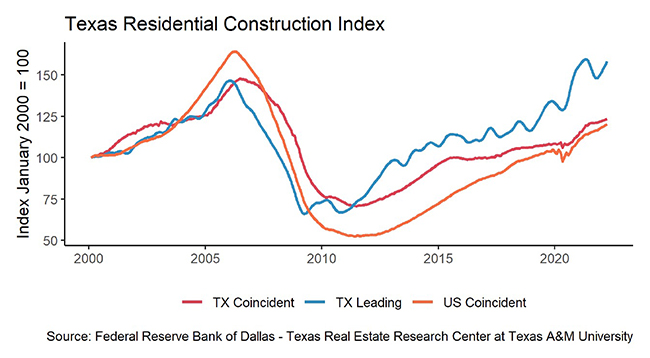
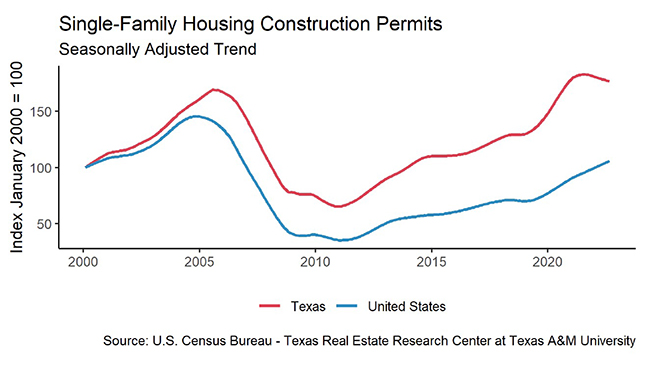
Starting in May, Texas’ single-family construction permits retreated below 15,000 per month, declining 5.2 percent QOQ. Building permits fell significantly in Austin and Houston. Despite the drop, Houston and DFW remained the top two metropolitan areas on the national permit list. Each had a seasonally adjusted rate of over 4,000 permits for new-structure building or existing-structure renovation. In Central Texas, Austin issued 1,800 permits, while San Antonio issued 900. Meanwhile, Texas’ multifamily sector surged to 9,900 construction permits in June, the highest level since 2015. Permits for two-to-four units and five-or-more units expanded at 39.8 percent and 26.3 percent QOQ, respectively.

Lumber price trended downward, declining 19.6 percent in a month. As the lumber price reduction lowered the framing cost by nearly one fifth, total Texas housing starts increased 6.2 percent QOQ. Zonda data revealed roughly 38,800 homes broke ground in the major metros over 2Q2022. Amid the construction expansion, all metros saw an uptick except Houston, where housing starts contracted 1.5 percent. Dallas had the most housing starts and luxury home construction projects. For every six houses built in the median price cohort of $400k-$499k, one house priced over $1 million was built. While housing starts inched up, single-family private construction values tumbled to a six-month low, corroborating the lowered construction costs. All major metros except San Antonio reported negative quarterly growths. 

While Texas’ overall housing supply remains historically low, inventory throughout the state is currently on the rise. Texas’ months of inventory (MOI) has gradually increased over the past few months, doubling from one month in February to two months in June. At the metropolitan level, inventories grew most robustly in Austin. Austin’s MOI surpassed DFW’s and Houston’s for the first time since 2019. By price cohort, inventories jumped for homes priced between $300,000 and $500,000.

Prices

The Texas median home price may have reached a peak as the June value leveled out at a seasonally adjusted rate of $349,000, which is $3,000 below May and the first drop in home prices since December 2020. While home price growth may be slowing, current prices remain significantly higher than before the pandemic. Except for San Antonio, each of the big four metros had a slight dip in median home prices for June. Austin had the largest seasonally adjusted single-month dip in June at 3.7 percent, while DFW fell 0.8 percent.

The Texas Repeat Sales Home Price Index, which accounts for compositional price effects, corroborated substantial home-price appreciation as the index inched up 17.1 percent year over year (YOY). The falling prices pulled down YOY statewide growth by 3 percent in the last six months. Austin fell from the fastest appreciating metro to third place behind Dallas and Fort Worth.

The Texas Housing Affordability Index (THAI) reflects the relationship between the median family income in a locale and the computed amount required to purchase a median-priced home. A higher THAI indicates relatively greater affordability. Measured by the THAI metric for first-time homebuyers, Houston was the most affordable metro, followed by San Antonio, Fort Worth, Dallas, and Austin, respectively. Despite the marginal median price decline, Austin remained the most unaffordable metro in the state.

Demand

Record home prices and rapidly rising mortgage rates continued to discourage buyers and cool the market. In June, over 37,000 homes were sold throughout the state, 9.4 percent below June 2021 sales. According to seasonally adjusted sale estimates, the slowdown actually began in January of this year, but June had the biggest single-month dip. Even though June sales were down from last year, they’re almost identical to June 2019 sales, which was the last record-setting year before COVID. The drop in home sales coincides with the rapid increase in mortgage rates that began in January but picked up steam in recent months.

Because of softening housing demand, Texas’ average days on market (DOM) has begun to creep up. Seasonally adjusted DOM increased to 34 days, up from 28 days in March. Normally, home sales accelerate in the summer and DOM decreases. That has not happened this summer. Homes sold the fastest in Austin and Dallas, leaving the market in 21 days. Houston’s and San Antonio’s DOMs remained around a month. The DOM for new homes was notably higher than the DOM for existing homes, especially in the Houston area, where new homes on average lasted 60 days on the market while existing homes lasted 23 days. 

Homes priced in the $300k and the $400k cohorts were fastest at getting sold, typically leaving the market in 27 days. On the other hand, homes under $300k had a conspicuously longer market duration.

Household Pulse Survey

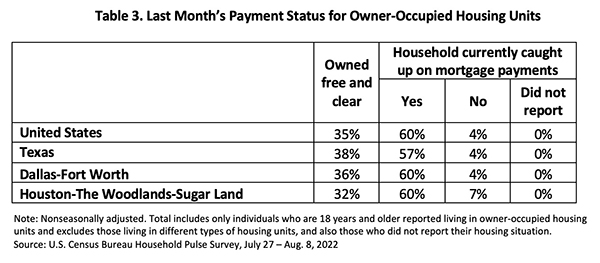
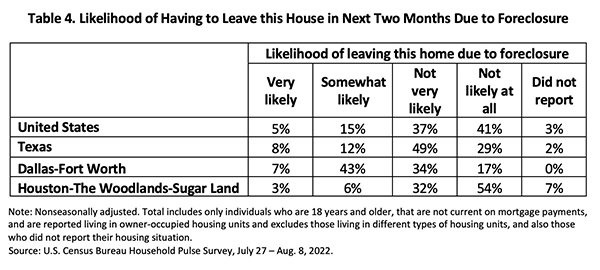
According to the U.S. Census Bureau’s Household Pulse Survey, homeowners are benefiting from last year’s low-interest loans and rising wages. The share of homeowners behind on mortgage payments shrank 1 percent YOY at both the national and state levels (Table 1). Owners’ improved ability to pay their mortgage was notable in Dallas and Houston, as owned free/clear homes in each metro had a 4 percent increase YOY. Furthermore, fewer Texas homeowners who struggled to keep up with mortgage payments faced the possibility of foreclosure. The proportion of delinquent individuals at risk of foreclosure plummeted 70 basis points to 2 percent (Table 2). The share who were “not very likely” to leave their homes in the next two months rose 17 percentage points to 61 percent in Dallas.

________________

* All measurements are calculated using seasonally adjusted data, and percentage changes are calculated month over month, unless stated otherwise.

Source – Joshua Roberson, Weiling Yan, and Rajendra Patidar (August 17, 2022)

https://www.recenter.tamu.edu/articles/technical-report/Texas-Housing-Insight

Slide1

July 2022 DFW Area Real Estate Stats

July stats are here and we have the numbers! 

Home prices continue to increase in North Texas! Collin County leads the pack with an average price of $602,166 which is up 19.2% over July 2021. According to a report from Texas Realtors, house prices are climbing faster in North Texas than they are in any other Texas metro area. The good news is that active listings are also up in each county including 3,532 active listings in Collin County (up 69.1% over July 2021) to 3,370 active listings in Denton County (up 77.4% over July 2021).  

Our stats infographics include a year over year comparison and area highlights for single family homes broken down by county. We encourage you to share these infographics and video with your sphere.

For more stats information, pdfs and graphics of our stats including detailed information by county, visit the Resources section on our website at DFW Area Real Estate Statistics | Republic Title of Texas.

For the full report from the Texas A&M Real Estate Research Center, click here. For NTREIS County reports click here.

Housing-Insight-May-2022

Texas Housing Insight May 2022 Summary

Both U.S. and Texas’ construction permits shrank, posting the third decline in the last four months, signaling a future slowdown in national and state homebuilding. Although the projection on Texas’ year-end supplies decelerated, current supplies expanded as new listings and active listings grew. Record-high housing prices and robustly rising mortgage rates deterred many potential buyers. Housing sales lost nearly 5,600 transactions from January’s record level, shrinking 14.5 percent. Price disparities were conspicuous between Austin’s new-home and existing-home markets. Prices for the former were considerably less than the latter as pressure in the existing market intensified.

Supply1

Texas had been the No. 1 state for issuing housing permits since May 2006. In 2022, for every six single-family homebuilding permits issued in the U.S., one permit originated in Texas. Despite the large market share, under the projection of cooling housing markets, both national and Texas permits had a mid-single-digit reduction in May. The Lone Star State retreated 1,000 permits to a seasonally adjusted (SA) monthly rate of 15,000 units. Dallas—the second largest metro on the national list—contracted by 700 permits for the month. Furthermore, multifamily construction permits for Texas’ two-to-four units and five-plus units saw a double-digit reduction. This signals a forthcoming deceleration of housing supplies.

Lumber prices moderated at April’s price level, falling 14.5 percent year-over-year (YOY). Texas’ total housing starts hit a three-decade high last month with 26,915 SA units. The number returned to the year-ago average, hovering around 20,000 SA units this month. As starts for housing projects dipped, Texas’ single-family private construction values fell 10.4 percent month-over-month (MOM) to $3.7 billion, the largest monthly decline since last July. Private construction values shrunk in all metros except Austin as finished projects exited the local construction market faster than new projects entered. Although only falling marginally in May at an annualized rate, Dallas’ single-family construction appears to have lost momentum compared with Houston.

While new listings for existing homes continue to climb, new listings for new construction through the Multiple Listing Services (MLS) grew aggressively at 17.5 percent MOM. Overall, new listings grew for all four major metros and across all price cohorts. Overall active listings reflected the same trend. The rising number of homes ready for sale pulled Texas’ months of inventory (MOI) up to 1.5 months. A six-month MOI is considered a balanced housing market (Table 1). After hovering below the one-month benchmark for 19 consecutive months (since October 2020) and hitting a record low of 13 days in May 2021, Austin’s MOI finally rebounded above 31 days. The rising MOI means the sales pace to the number of available properties is improving. As Texas’ housing market frenzy started to ease, MOIs in the major metros all advanced four to ten days.

Prices

Although housing inventories slowly started to build up, housing prices did not immediately reflect the supply shift. The Texas median home price hit a record high every month starting in January 2021, and the median price rose to a record-breaking $354,000 this month, climbing over 25 percent since the beginning of 2021 (Table 2). All metros hit new price levels. Austin ($534,000) and Dallas ($446,000) were the two most expensive metros in which to own a single-family home. Amid all expanding metros, the median price growth was most notable in Austin where it rose almost 40 percent since January 2021. Data suggest in Austin it may be more affordable to buy a new home than hunt for an existing one. The median price for new homes sold in Austin through the MLS was $437,000, more than $100,000 less than the price of existing homes. In either case, housing in Austin is still out of reach for many potential buyers. Median prices in San Antonio ($337,000), Houston ($341,000), and Fort Worth ($373,000) advanced at a double-digit rate, albeit at a slower rate.

The Federal Reserve is expected to reduce its balance sheet assets and increase the Federal Funds rate several more times by the end of 2022. The ten-year U.S. Treasury bond yield shot up to 2.9 percent2, increasing 15 basis points in one month. The spread difference between the ten-year and the two-year bond yields rebounded 7 basis points to 0.3 percent, yet the spread between the two was still alarmingly low, signaling economic uncertainties and rising risks in the near future. The Federal Home Loan Mortgage Corporation’s 30-year fixed-rate, which for years hovered around 3 percent, elevated to 5.23 percent. The last time the mortgage rate was this high was in 2008. For more information on the effect of mortgage interest rates on purchase affordability, see “How Higher Interest Rates Affect Homebuying.”

The Texas Repeat Sales Home Price Index accounts for compositional price effects and provides a better measure of changes in single-family home values. Texas’ index corroborated substantial and unsustainable home-price appreciation, soaring 18.7 percent YOY. Dallas’ and Fort Worth’s index rose 26.4 and 24.6 percent, respectively, as home-price appreciation shot up in North Texas. Meanwhile, the metrics climbed around 19 percent in a year for the other three metros. Increasing home prices pressure housing affordability, particularly in an economic environment where mortgage rates are hiking and real wage growths are slow.

Demand

Record home prices and rapidly rising mortgage rates discouraged buyers and cooled the market. According to the MLS, total Texas housing sales peaked in January with nearly 39,000 transactions. Sales have declined each month since then. Total housing sales fell to a seasonally adjusted rate of 33,097, down 1,080 deals from April’s housing transactions. Sales in all major metros declined under the price pressures. Houston closed 9,100 sales, contributing one-third of the state’s total lost transactions. Dallas followed with 5,700 closed deals. Austin, Fort Worth, and San Antonio hovered around 3,000 units, each losing around 100 home transactions. Home appreciation drastically changed the price structure of home purchases. Housing sales slipped by double-digit percent for homes priced below $400,000, while transactions for more expensive homes (greater than $750,000) accelerated for the sixth month.

Texas’ average days on market (DOM) inched down to 28 days, the lowest on record. The historical low DOM indicated buyers’ eagerness to own a house. Austin and North Texas’ home purchases were the most frequent, closing in 20 days. Houston and San Antonio’s DOM inched down to 29 and 30 days, respectively. When days on market were differentiated based on the home market, the new home’s DOMs were notably higher than existing home’s, especially in the Houston area where homes lasted 61 days on average in the former market and 23 days in the latter. The existing-home market is hot. 

Homes in the $300K and $400K price cohorts sold fastest, typically leaving the market in 27 days. Homes under $300K had a longer market duration. Many of these homes may be older and not market-ready.

Note: Data collection for Household Pulse Survey was paused in May because the U.S. Census Bureau was making survey revisions. The survey analysis will resume in June.

________________

1 All measurements are calculated using seasonally adjusted data, and percentage changes are calculated month over month, unless stated otherwise.
2 Bond and mortgage interest rates are nonseasonally adjusted. Loan-to-value ratios, debt-to-income ratios, and the credit score component are also nonseasonally adjusted.

Source – Joshua Roberson and Weiling Yan (July 25, 2022)

https://www.recenter.tamu.edu/articles/technical-report/Texas-Housing-Insight

August-Landscape-tips

August Landscape & Gardening Tips & To-Do’s

Need help planting a successful garden or landscape? Here are some August planting tips from the Dallas Arboretum horticulture staff and the Dallas County Master Gardeners that can help keep your home garden looking beautiful this Fall. Lawn and garden maintenance should be your focus in August.

  • Proper watering is crucial in August. Apply one to two inches of water per week to -landscaping.
  • Keep an eye out for webworms in trees. Use a garden hose to blast them out of the trees with water or cut them out with pole pruners.
  • Plant vegetable crops, including corn, tomatoes, and beans, for fall harvest.
  • Plant seasonal annuals such as marigolds and ornamental peppers for fall interest.
Favorite-Indoor-Spots

Favorite Spots for Indoor Fun in DFW

Another Round | Indoor Putt Putt | Dallas
Chicken & Pickle | Pickleball | Grand Prairie
Children’s Aquarium at Fair Park | Dallas
Crayola Experience | Plano
Crush It | Virtual Sports | Grapevine
Dallas Circus Center | Dallas
Electric Gamebox | Virtual Gaming | The Colony
Electric Shuffle | Shuffleboard | Dallas
Evo Cinemas | Entertainment Center | Southlake
Farm & Feed | Indoor Gaming | Plano
Frontiers of Flight Museum | Dallas
Gatsplat | Indoor Paintball | Ft. Worth
House of Shine | Interactive Museum | Grapevine
Kidzania | Children’s Amusement Center | Frisco
Kimball Art Museum | Ft. Worth
Legoland | Family Theme Park | Grapevine
Medieval Times | Dinner Theatre | Dallas
Modern Art Museum | Ft. Worth
Museum of Illusions | Dallas
National Video Game Museum | Frisco
Rainbow Vomit | Immersive Art | Dallas
Seaquest | Interactive Aquarium | Ft. Worth
Super Fort Wars | Fort Building | Ft. Worth
The 6th Floor Museum | Dallas
The Dallas World Aquarium | Dallas
The Perot Museum | Dallas
UTA Planetarium | Arlington
Whirlyball | Indoor Sport | Plano

NEED MORE ACTIVITY IDEAS? CHECK YOUR AREA FOR:
• arcades
• antique shopping
• axe throwing
• bowling alleys
• breweries
• escape rooms
• ice skating
• inflatable indoor playgrounds
• indoor obstacle courses
• Indoor rock climbing
• indoor sky diving
• indoor water parks/natatoriums
• movie theaters
• painting/art studios
• roller skating
• shopping malls
• trampoline parks

Important-After-Closing-Reminders-for-Buyers

Important After Closing Reminders for Buyers

Congratulations! You’ve just closed on the purchase of your new home! Here is a helpful list of important to-dos and reminders for after closing:

  1. A copy of the recorded Warranty Deed
    that transferred title of the property will be sent to you via email with your Owner’s Title Policy approximately one month after closing. Your Owner’s Title Policy should be printed and stored for safe keeping and/or saved on your personal computer.
  2. It is the taxpayer’s responsibility to be certain the property is rendered in the current taxpayer’s name
    for the upcoming tax year. Contact the County Appraisal District (CAD) for assistance in making certain this is done.
  3. Make certain to file your homestead designation with the County Appraisal District.
    If you have any questions about your homestead exemption for property tax purposes, or any other exemption which may be available to you, please contact your County Appraisal District. The forms necessary to apply for exemptions are available online from your Appraisal District at no cost. See the reverse side of this card for area County Appraisal District’s website and contact information.
  4. Contact the Home Warranty company if you received a home warranty and want additional coverage.
    If you received a Home Warranty (also known as a Residential Service Contract) in connection with your recent closing and wish to add additional coverage, please contact the Home Warranty company directly.

Collin County
Collin County Central Appraisal District
collincad.org | 469.742.9200

Dallas County
Dallas County Central Appraisal District
dallascad.org | 214.631.0520

Denton County
Denton County Central Appraisal District
dentoncad.org | 940.349.3800

Grayson County
Grayson County Central Appraisal District
graysonappraisal.org | 903.893.9673

Johnson County
Johnson County Central Appraisal District
johnsoncad.com | 817.648.3000

Kaufman County
Kaufman County Central Appraisal District
kaufman-cad.org | 972.932.6081

Rockwall County
Rockwall County Central Appraisal District
rockwallcad.com | 972.771.2034

Tarrant County
Tarrant County Central Appraisal District
tad.org | 817.284.0024

Exemption forms can be downloaded from the Central Appraisal District’s website for the county in which the property is located.

Click here for print version