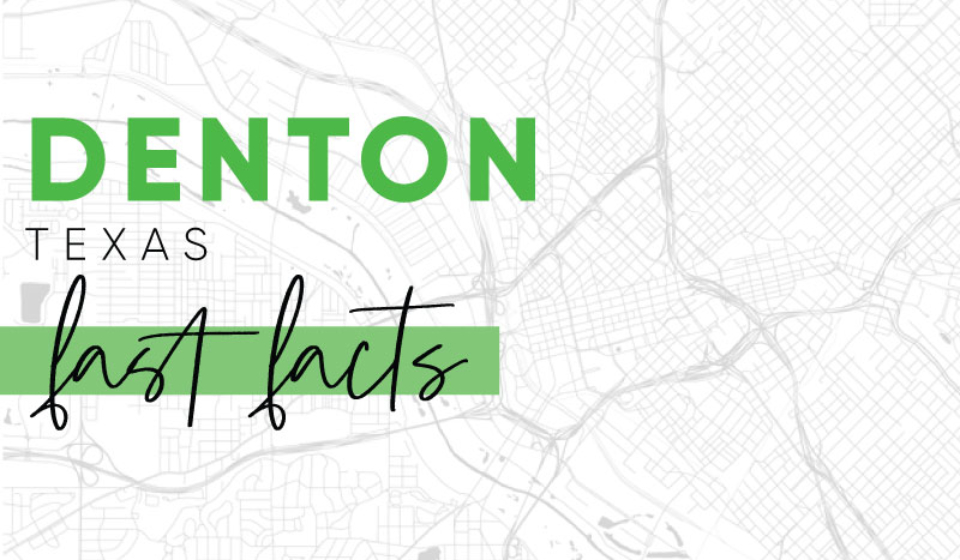
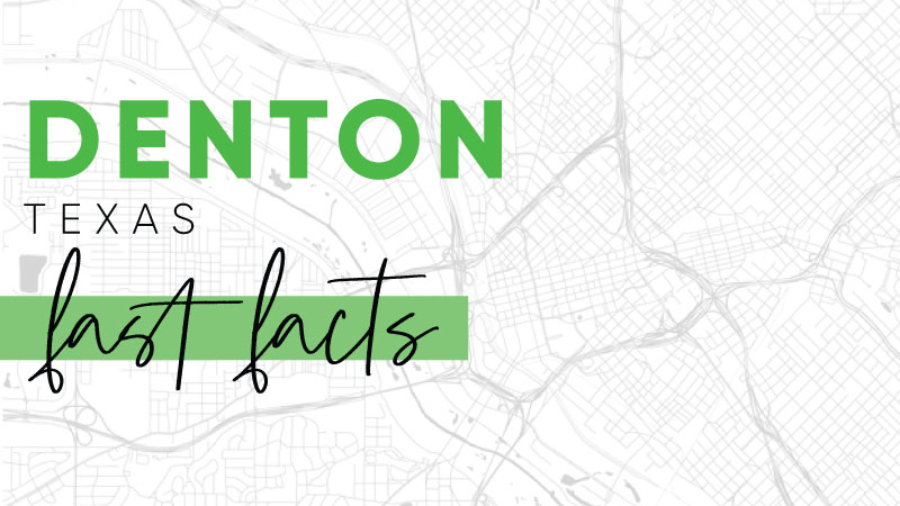
Whether you’re a lifelong resident or new to the area, there’s always something new to discover about your neighborhood. With that in mind, we created a Fast Facts sheet for cities and neighborhoods all over the DFW area. Our DFW Area fast facts have detailed real estate insights, things to do, places to shop and some of our favorite restaurants in each area.
Denton, Texas, is a vibrant and eclectic city located just north of the Dallas-Fort Worth metroplex. Known for its lively arts scene, historic downtown square, and prestigious universities, including the University of North Texas and Texas Woman’s University, Denton offers a unique blend of culture, music, and academic energy. The city hosts numerous music festivals and cultural events, making it a hub for creativity, while its charming neighborhoods and strong sense of community make it an inviting place to live and visit.
POPULATION
150K
AVERAGE HOUSEHOLD INCOME
$72K
MEDIAN AGE
30
HOUSING
49% OWN 51% RENT
AVERAGE SALES PRICE
$296K
AREA ACTIVITIES & FEATURES
• COURTHOUSE ON THE SQUARE • BAYLESS-SELBY HOUSE MUSEUM • CLEAR CREEK NATURAL HERITAGE CENTER • BLAGG-HUEY LIBRARY • IRONWOOD AXE THROWING • ANDY B’S | BOWLING • BATTLEFIELD NERF WAR ARENA • PATTERSON-APPLETON ARTS CENTER • LANTANA GOLF CLUB • BLACK MUSTANG RANCH | HORSE RIDING
FAVORITE LOCAL DINING & DRINK SPOTS
• THE GARDEN GRILLE • NORTH POINT CAFE • MI RANCHITO • GRAFFITI PASTA • ROYAL YUM • TWO GENTLEMEN OF VERONA • ANDY’S BAR • BARLEY & BOARD • BIG FATTY’S FLAMING FOODS • BLIND FOX • FREDDY’S TACOS • GROOVY CHICKEN & WAFFLES • HANNAH’S OFF THE SQUARE • WILD CACTUS CANTINA • COOL BEANS • EAST SIDE DENTON • HARVEST HOUSE • HORNY TOAD CAFE • L’AMITIE • 407 BBQ • ANDAMAN THAI • BACK DOUGH • JUICY PIG •
FAVORITE LOCAL SHOPPING
• CHRYSALIS GALLERY • PATCHOULI JOE’S BOOKS • TWICE AS NICE • THE DIME STORE • LA DI DA • LIMOLI’S • VINTAGE LIZARD • MADNESS COMICS • VAGABOND VINTAGE •
AVERAGE DRIVE TIMES
• DOWNTOWN DALLAS | 50 MINUTES • DALLAS LOVE FIELD AIRPORT | 45 MINUTES • DFW INTERNATIONAL AIRPORT | 30 MINUTES • AT&T STADIUM & GLOBE LIFE FIELD | 55 MINUTES • DOWNTOWN FORT WORTH | 40 MINUTES
All measurements are calculated using seasonally adjusted data, and percentage changes are calculated month-over-month, unless stated otherwise.
The latest housing data show conditions have shifted in favor of homebuyers as the spring homebuying gets underway. In particular, the housing inventory has been building up for some time now and reached levels not seen in a long time. The supply of new listings coming to the market has accelerated in recent months, partly because new construction has ramped up at a record pace during 2024. Economic uncertainty, persistent inflation, and global trade tensions are prompting increased market-timing and profit-taking activity by buyers and sellers.
Home sales pace has slowed in recent months, as reflected in rising days on the market and declining inventory turnover ratio. Year-over-year (YoY) home sales were up in January, driven primarily by a more active market for higher-end homes. Market liquidity for lower-priced homes remains constrained by high mortgage rates.
In 2024, new housing starts registered the highest annual growth in a decade, even outpacing the peak of the pandemic housing boom in 2021. That momentum has carried over into 2025.
Home prices are rising steadily and slowly. The large inventory build-up and the record number of new constructions that are underway will continue to put downward pressure on home prices.
In the near term, mortgage rates will remain in the mid-6 percent range with some narrow fluctuations. In the absence of meaningful improvement in mortgage rates, housing affordability will continue to remain a challenge. The Federal Reserve has taken a wait-and-see approach to future interest rate decisions. A decline in the job market and broad economic conditions will likely be necessary for an interest rate reduction to take place.
Home Sales in January Pulled Back Under Rising Mortgage Rates
Before heading into 2025, particularly in the fourth quarter of 2024, home sales were rising quickly. But the strong upward momentum subsided as mortgage rates moved higher following the Federal Reserve’s December rate cut, amid concerns of inflation re-acceleration.
In January 2025, statewide home sales of new and existing homes were at a seasonally adjusted annual rate of 343,240, up by 1.2 percent from the same period a year ago. Nationally, the National Association of Realtors (NAR) reported a 2 percent YoY rise in existing home sales. Statewide median home price was $328,000, up slightly from a year ago at $325,000.
Sources: Texas Real Estate Research Center and National Association of Realtors
Sales of Low-to-Moderate Income Homes Lagged High-End Homes
The pullback in homes sales is more evident among lower-priced homes. In January, sales declined 2.8 percent YoY among homes priced between $250,000 and $350,000. Sales were relatively flat among homes priced below $250,000.
In contrast, sales in the high-end market (more than $750,000) rose 9.4 percent in January, followed by a modest 3.7 percent for homes priced between $500,000 and $750,000. The uneven pace of sales growth was also evident at the tail end of 2024. During 4Q2024, the high-end market was the most active and the bottom-tier the weakest. The mid- to upper-tier homes fell in between.
Source: Texas Real Estate Research Center
Inventory at Decade-High, Home Sales at Decade-Low Pace
The supply of new listings has accelerated in recent months, expanding active inventory to levels not seen in a decade. The end of January saw 120,100 active listings, up nearly 30 percent YoY. Months’ supply climbed to about 4.5 months, the highest in a decade and above pre-pandemic levels. Prior to the pandemic, months’ supply fluctuated near 3.5 months while active listings sat around 100,000.
Source: Texas Real Estate Research Center
A total of 46,410 new listings hit the market in January, a 17.3 percent YoY increase. In the preceding 12 months, the momentum has built up rapidly, where new listings surged at about 13 percent each month, something not seen for a long time.
Source: Texas Real Estate Research Center
Homes stayed on the market a median of 51 days in January, up eight days from the year before. Home sales pace, measured alternatively as the rate of inventory turnover, has dropped to levels not seen since 2016 and was below what normally fluctuated in a relatively balanced market. Before the pandemic, about one in five homes (20 percent) were typically sold during the month. In the last 13 months (including January 2025), the rate of inventory depletions averaged at about 15 percent.
Source: Texas Real Estate Research Center
New Housing Starts Continue to Post Strong Growth
Since the pandemic, Texas has experienced a surge in new-home construction as the state’s robust economy, friendly business environment, job opportunities, and affordable housing costs have attracted businesses and new residents. In January, single-family home starts were at a seasonally adjusted annual rate of 165,050, up 10.9 percent YoY. Housing starts were down seasonally by 5.6 percent from December 2024. Texas accounts for 16.6 percent of the nation’s total new home starts.
Sources: Texas Real Estate Research Center and U.S. Census Bureau
After a two-year setback triggered by the Fed’s monetary tightening and interest rate hikes, new home starts came roared back in 2024. Between 2023 and 2024, they jumped 24.7 percent, the largest rise seen in a decade and outpacing what was recorded at the peak of the pandemic housing boom. As the spring homebuying season gets underway, buyers can expect an influx of new homes entering the market.
Sources: Texas Real Estate Research Center and Dodge Construction Network
Home Prices Rising, Slowly and Steadily
Statewide, home prices are rising slowly and steadily. In January, the TRERC Home Price Index (HPI) recorded a 1.7 percent YoY increase, slightly smaller than in the previous two months. Nationally, the average home price appreciation captured by the S&P CoreLogic Case-Shiller HPI was at a faster rate of 3.9 percent. The Case-Shiller 20-City Composite HPI measures home price trends in the country’s largest and most densely populated cities (including Dallas, the only Texas city in the index), so it’s no surprise that the index’s annual home price appreciation rate typically outpaces Texas’ statewide rate. TRERC’s HPI is based on all geographic transactions, rural or urban, in the state of Texas.
Sources: Texas Real Estate Research Center and FRED Economic Data
Metro Housing Benchmarks
January 2025 Homes Sales, Ordered by Year-Over-Year Change
Source: Texas Real Estate Research Center
January 2025 Inventory Velocity, Ordered by Year-Over-Year Change
Source: Texas Real Estate Research Center
New Construction Growth 2015-24, Ordered by One-Year Growth
Source: Texas Real Estate Research Center
Home Price Appreciation for Select MSA and MSA Divisions
Spring is in the air, and it’s time to start planning for some al fresco dining in the beautiful outdoor spaces that Dallas-Fort Worth has to offer. Whether you’re looking for a romantic spot for a date night or a place to catch up with friends over brunch, there are plenty of patios to choose from. Here are some of the best patios for al fresco dining in DFW this Spring.
One of the most picturesque patios in DFW can be found at Paradiso in the Bishop Arts District in Dallas. The vibrant colors of the surrounding foliage create a stunning backdrop to enjoy brunch and a signature cocktail. The patio is also pet-friendly, so you can bring along your furry friend to enjoy the warm weather too.
Republic Title is pleased to offer a variety of continuing education classes for our customers. Join us in April for classes including:
Dodging Contract Danger Zones This class focuses on specific sections within the TREC 1-4 Family Contract and other related contract forms that licensees should have a clear understanding of in order to steer clear of potential challenges. April 3rd 10:00 am – 11:00 am Republic Title – Preston Legacy Office
Mastering Your Circus Realtors, are you struggling to stay organized, be creative, and find consistent success in this circus known as real estate? If so, then step right up and get your ticket to a fun, whimsical, and wild circus adventure with Lisa Johnson Juden as your master ringleader. With 23 years of experience as a Realtor, Lisa shares with you her secrets to fostering creativity, igniting inspiration, and reaching your greatest goals in today’s real estate marketplace. Packed with insights, tips, and clever techniques to help guide you, this book offers a vibrant upfront, and entertaining approach that takes you back to the basics of your business. Let’s get this act on the road with you as the ringleader to the greatest show in town. April 3rd 12:00 pm – 1:00 pm Republic Title – North Dallas Office
Top Ten Contract Addenda Join us to review 10 of the most commonly utilized TREC contract addenda including Third Party Financing Addendum, Addendum for Backup Contract and more. April 9th 10:00 am – 11:00 am Zoom
Mortgage Fundamentals Take a dive into the essential details of mortgage programs and how they impact your business. By understanding these basics, you will be equipped to guide your clients more effectively, reduce the level of stress in a transaction, build wealth, and strengthen your reputation in the real estate industry. April 9th 12:00 pm – 1:00 pm Republic Title – North Dallas Office
Thrive in 25 Part 2: A Fresh Twist On Buyer Mastery Level up your business by improving the way you work with buyers! This class covers managing buyer expectations in today’s market, helping clients get to contract faster, and creating a smooth, positive experience. Agents will also learn how to generate more referrals, strengthen their buyer consultations, and navigate negotiations more effectively, and enhance their buyer consultations with proven techniques that build trust and confidence. While focused on buyer strategies, this class also offers valuable insights for listing agents working with buyer’s agents. April 10th 9:30 am – 11:00 am Republic Title – Corporate Headquarters
Is This Homestead and Why Do Title Companies Care? Homestead rights can be very confusing! This class will help licensees understand how the State of Texas views homesteads and what factors influence the title company’s underwriting decisions. April 16th 11:00 am – 12:00 pm Republic Title – Frisco Office
BROKER OPEN – Dodging Contract Danger Zones This class focuses on specific sections within the TREC 1-4 Family Contract and other related contract forms that licensees should have a clear understanding of in order to steer clear of potential challenges. April 16th 11:30 am – 12:30 pm 6501 Blanch Circle, Dallas 75214
Death, Divorce & Real Estate This class focuses on specific sections within the TREC 1-4 Family Contract and other related contract forms that licensees should have a clear understanding of in order to steer clear of potential challenges. April 17th 10:00 am – 11:00 am Republic Title – Preston Legacy Office
How To Protest Your Property Value With The Appraisal District Property owners across Texas are faced with increases in property values. These increases lead to many property owners protesting their values with the Central Appraisal District. Real estate agents are often contacted to provide information to be used in these protests. This course will provide information to real estate agents that they can pass along to property owners that will help to ensure correct values are placed on property with the Central Appraisal Districts. April 18th 9:00 am – 10:00 am Republic Title – Corporate Headquarters
Ins And Outs Of The Residence Homestead Tax Exemption The objective of this course is to provide a complete understanding of the homestead exemption. The class will cover: how the homestead exemption impacts the value of property for the calculation of property taxes; how and when to apply for the homestead exemption; the impacts of the over-65/disabled persons exemption on property taxes; how to transfer the over-65/disabled persons exemption when moving homesteads; and how the homestead exemption is used when located with agricultural property. April 18th 11:00 am – 12:00 pm Republic Title – Corporate Headquarters
Video Marketing For Real Estate This session will teach you everything you need to know to showcase your business with videos. Learn the hardware and software you need to be an effective video influencer. View important video benchmarks to help you earn thousands of dollars a year. During the workshop, you will create your own video channel and more! April 23rd 1:00 pm – 3:00 pm Republic Title – Corporate Headquarters
Lost Art Of Open Houses Most real estate agents believe that open houses are a waste of time. Many only do open houses to satisfy sellers and to demonstrate that they are doing “something” other than waiting for someone else to sell the home. Done correctly, open houses are a phenomenal way to increase the chances a home will sell faster and a higher price while also giving the real estate agent a opportunity to grow a farm and/or create new buying and selling opportunities. April 24th 11:00 am – 1:00 pm Republic Title – Republic Title Prosper Office
Escape Hatches For Buyers In this class licensees will become familiar with specific conditions & contingencies within the contract and related addenda that, if not adhered to, could result in a Buyer’s valid termination of the contract. April 29th 2:00 pm – 3:00 pm Republic Title – Republic Title Frisco Office
February brought continued strength to the North Texas real estate market, with rising inventory, steady sales activity, and moderate price growth signaling a strong start to the year. Buyers are gaining more options while sellers continue to benefit from solid property values and increased demand. As we watch 2025 unfold, the numbers suggest that North Texas remains a vibrant, opportunity-filled market.
Key Market Trends by County
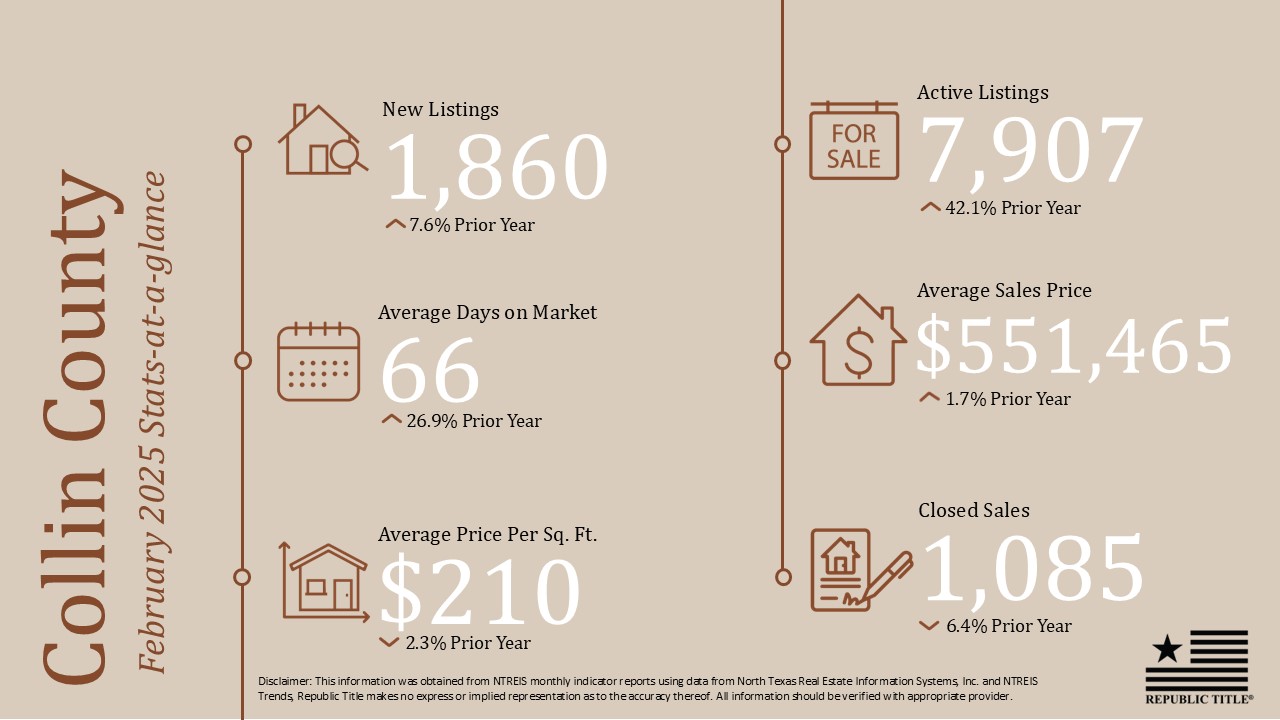
Collin County Inventory growth continues to lead the region with 7,907 active listings, a 42.1% increase from last year. New listings also rose to 1,860, up 7.6%, providing fresh opportunities for buyers. Closed sales declined 6.4% to 1,085. The average sales price rose modestly to $551,465, up 1.7, while the average days on market increased to 66, suggesting that while homes are still selling, buyers may be taking a little more time to make decisions.
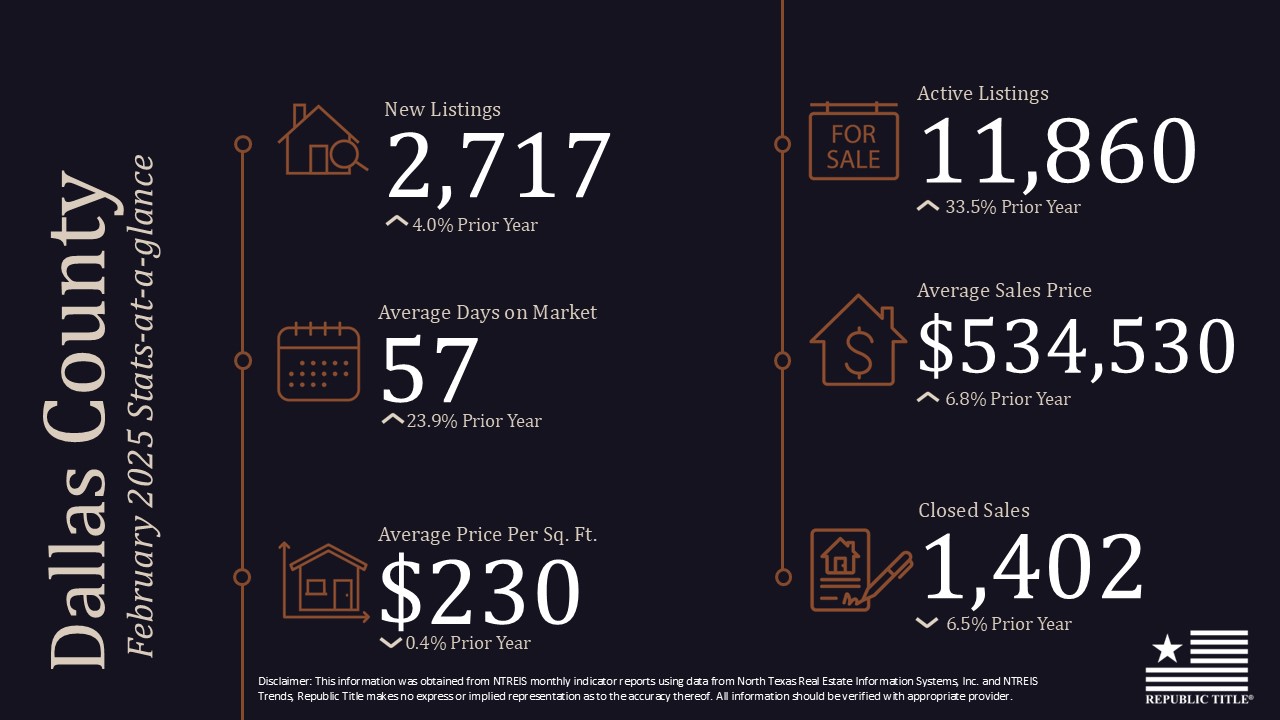
Dallas County Dallas County continues to reflect strong market activity. Active listings reached 11,860, a 33.5% increase, while new listings edged up 4% to 2,717, keeping inventory levels refreshed. Closed sales were down 6.5%, totaling 1,402, and the average sales price rose 6.8% to $534,530—a notable jump that underscores buyer confidence. Homes are staying on the market longer, with average days on market up to 57, a 23.9% increase.
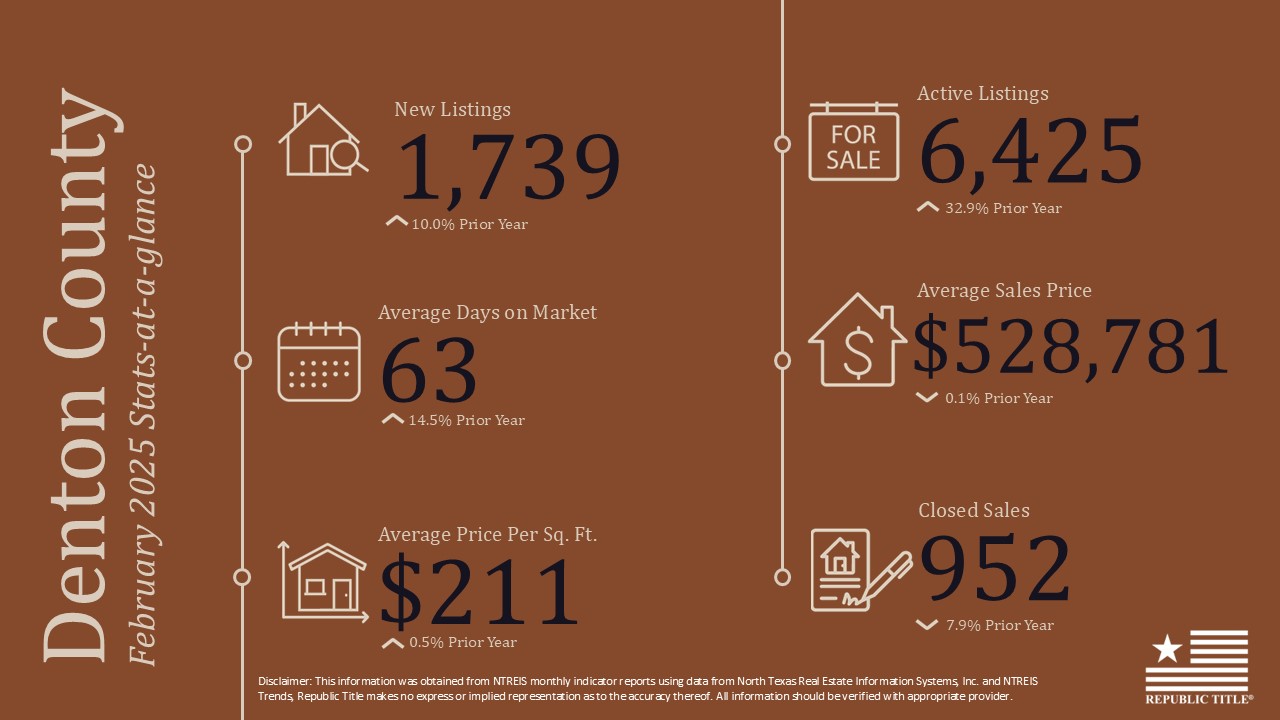
Denton County Denton is holding strong with 6,425 active listings, a 32.9% jump from last year. New listings hit 1,739 (up 10%) while closed sales dropped by 7.9%, reaching 952. Although the average sales price held nearly flat at $528,781 (down just 0.1%), the consistent activity and modest pricing make Denton a balanced and competitive market. Homes are selling a bit more slowly, with days on market up 14.5% to 63 days.
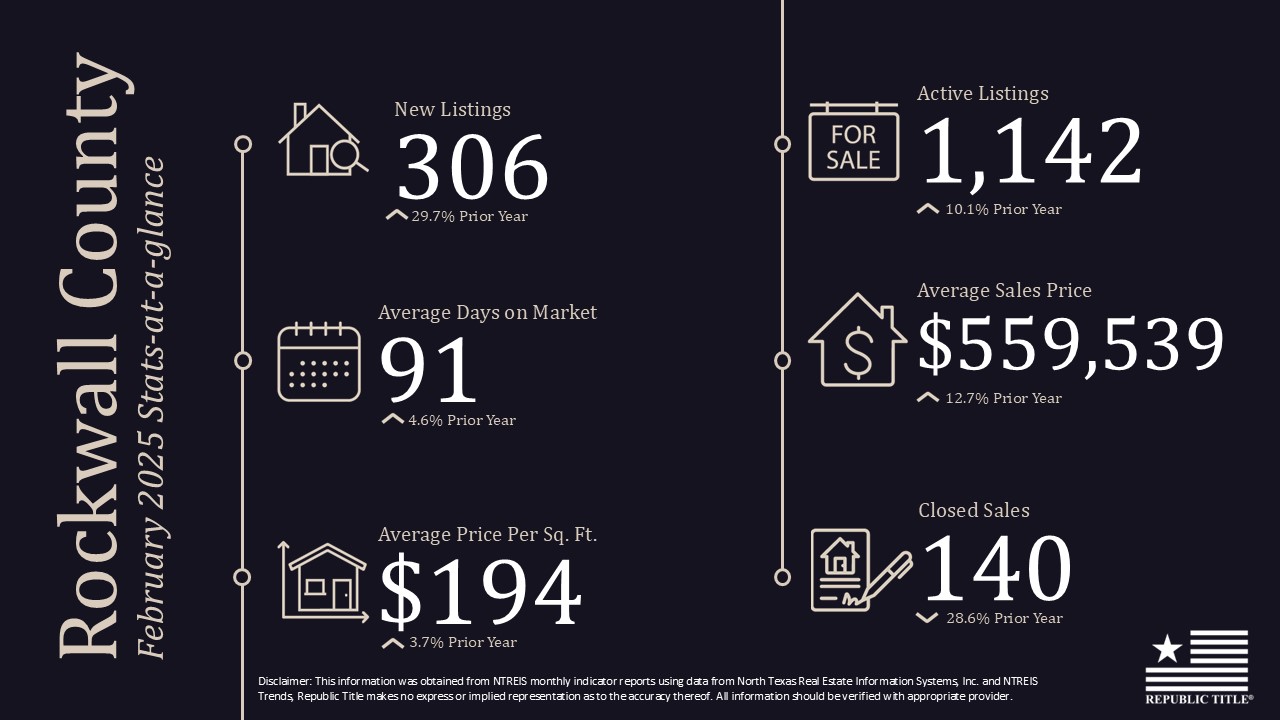
Rockwall County Rockwall continues to shine, especially for a smaller market. New listings surged 29.7% to 306. Similar to other North Texas counties, closed sales had a 28.6% decrease, totaling 140. The average sales price climbed a robust 12.7% to $559,539, reflecting increased demand and value in this growing community. Active listings also rose 10.1% to 1,142, while homes are spending an average of 91 days on the market, up just slightly from last year.
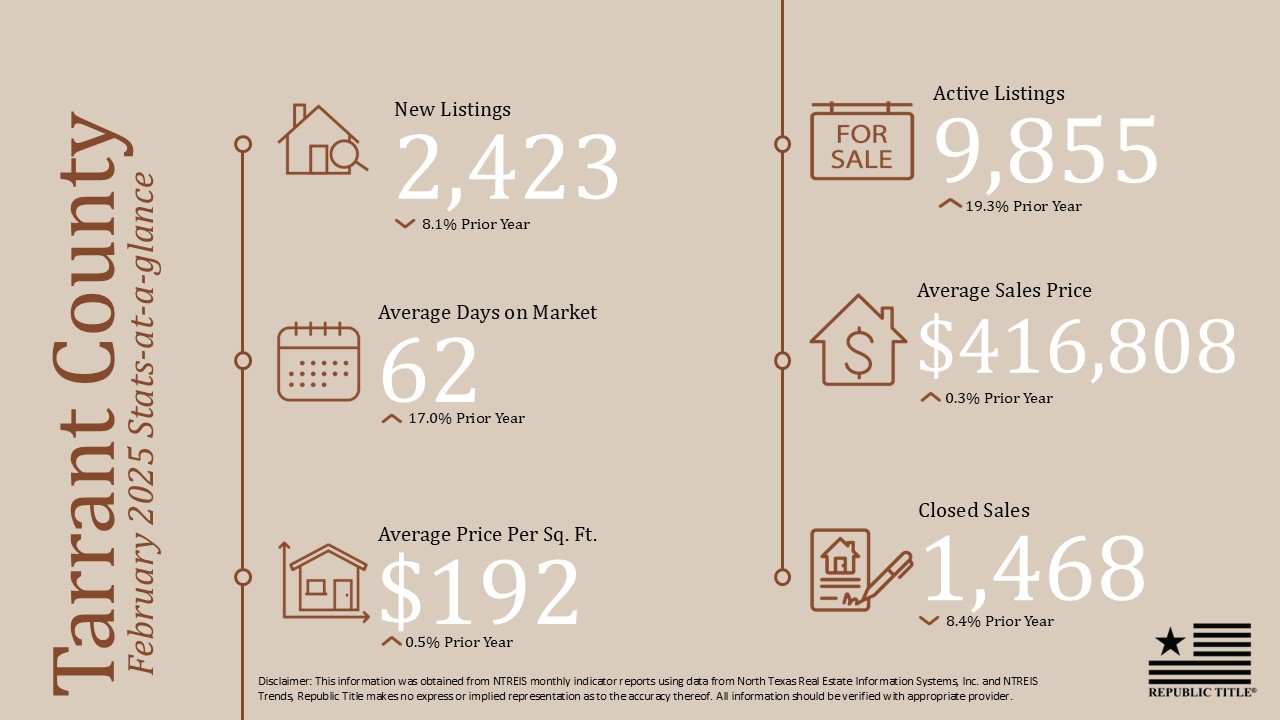
Tarrant County In Tarrant County, active listings grew to 9,855, up 19.3%, and new listings dropped 8.1% to 2,423. Closed sales were also down, decreasing 8.4% to 1,468. The average sales price rose slightly to $416,808 (up 0.3%), showing price stability in a popular and competitive county. The average days on market increased by 17%, landing at 62 days—indicating more thoughtful purchasing behavior from buyers.
With inventory rising and home prices showing modest but steady gains, North Texas enters the spring season with a balanced outlook. Buyers have more to choose from, sellers are still benefiting from strong values, and the pace of sales is giving everyone a little more breathing room.
At Republic Title, we’re committed to helping you navigate whatever the market brings. Whether you’re buying, selling, or investing in 2025, trust our team of experts to deliver smooth, secure transactions backed by unmatched local insight.
Our stats infographics include a year over year comparison and area highlights for single family homes broken down by county. We encourage you to share these infographics and video with your sphere.
Whether you’re a lifelong resident or new to the area, there’s always something new to discover about your neighborhood. With that in mind, we created a Fast Facts sheet for cities and neighborhoods all over the DFW area. Our DFW Area fast facts have detailed real estate insights, things to do, places to shop and some of our favorite restaurants in each area.
Carrollton, Texas, is a diverse and rapidly growing city located in the Dallas-Fort Worth metroplex. Known for its strong community vibe, excellent schools, and variety of parks, Carrollton offers residents a well-balanced lifestyle with easy access to both suburban comforts and urban amenities. The city is also home to a variety of dining, shopping, and entertainment options, making it a popular choice for families and young professionals alike.
POPULATION
134K
AVERAGE HOUSEHOLD INCOME
$95K
MEDIAN AGE
38
HOUSING
58% OWN 42% RENT
AVERAGE SALES PRICE
$327K
AREA ACTIVITIES & FEATURES
• NOB HILL GREENBELT | NATURE TRAIL & PARK • THE FINISHING TOUCH ANTIQUE SHOP • DALLAS CHOCOLATE CLASSES • COYOTE RIDGE GOLF CLUB • ELM FORK NATURE PRESERVE • BOARDWALK GAMES • A.W. PERRY HOMESTEAD MUSEUM • NICKELMANIA | ARCADE • ROSEMEADE RAINFOREST AQUATIC COMPLEX
FAVORITE LOCAL DINING & DRINK SPOTS
• BARREL & BONES CRAFT BAR • BB.Q CHICKEN • • SUM FUSION KITCHEN • KIN’S RESTAURANT • • GOLD SPOON • GARLAND CAFE • AMICI • NICO’S COCINA • KUROBUTA • LEO’S BRUNCH HOUSE • POUR CHOICES • LA VISTA COCINA • OKATSU & SANDO BAR • CUBA BELLA CAFE • EGGSELLENT CAFE • BARO BARO KIMBAP • AWAKE • TOO THAI STREET EAT STED ROOT BURGER CO. • CANE ROSSO • C TATION • OH K DOG • BCD TOFU HOUSE • HANABI RAMEN •
AVERAGE DRIVE TIMES
• DOWNTOWN DALLAS | 30 MINUTES • DALLAS LOVE FIELD AIRPORT | 25 MINUTES • DFW INTERNATIONAL AIRPORT | 20 MINUTES • AT&T STADIUM & GLOBE LIFE FIELD | 30 MINUTES • DOWNTOWN FORT WORTH | 35 MINUTES
Happy first day of Spring! It’s time to get your home ready for the warmer weather! Get ahead of the game with our helpful tips for spring cleaning and maintenance. From deep cleaning your kitchen to exterior inspections, we have all the tips you need to make your home sparkle and shine.
INTERIOR
• Inspect and change out HVAC filters. • Clean kitchen sink disposal. • Clean range hood filters. • Inspect your fire extinguisher(s). • Get your air conditioning system ready for summer; empty drain pans, check hose connections for leaks. • Consider getting an HVAC technician to service your system biannually. This will help it run optimally year-round. • Inspect your attic crawl spaces. Look for signs of vermin infestation. Contact a pest control professional if any concerns arise. • Run water and flush toilets in unused spaces. • Check water softener and add salt if needed. • Test your water heater’s pressure relief valve. • Test smoke/carbon monoxide detectors and replace batteries if necessary. • Spring cleaning! Now is the time to give your house a deep clean.
EXTERIOR
• Get your lawn ready for the warm temperatures. Clear your yard of any debris and aerate your lawn if needed (you might need a professional to do this.) • Early spring is the best time to lay pre-emergent herbicide. This will prevent weeds from growing. • Check exterior drainage & clean out gutters. • Inspect the exterior of your home for soil erosion and add fill dirt/sod if needed. • Inspect roof for damage, leaks and missing shingles. • Inspect exterior walls including eaves for any cracks or holes where insects or critters could enter. • Check seals around windows, caulk if necessary. • Check for loose, warped or splintered boards on your deck/patio. Now is a good time to seal/stain if needed. • If you stored your lawn furniture for the winter, bring it outdoors and give it a rinse or wash with a mild detergent. • Go ahead and have a little fun! Plant seasonal flowers to add color to your landscape. Flowers that thrive in spring in North Texas are cosmos, marigolds, zinnias and pentas.
All measurements are calculated using seasonally adjusted data, and percentage changes are calculated month-over-month, unless stated otherwise.
In a sign of stabilization, Texas’ home sales rose significantly in December to deliver a strong fourth-quarter finish going into 2025. Rising sales were seen broadly across all major markets (Austin, Dallas-Fort Worth, Houston, and San Antonio) as well as in smaller markets outside the Big Four. 4Q2024 marks the first time since the beginning of the housing recession that home sales rebounded strongly to end the year with double-digit year-over-year (YoY) growth.
Home prices remained steady and ended the year higher than a year ago. Positive year-end trends also captured rising new listings and rising inventory amid strong fourth-quarter sales momentum. Mortgage rates remained high going into 2025 despite a third round of interest rate cuts by the Federal Reserve in December. Mortgage rates are likely to stay near where they are during persisting signs of market jitters over inflationary pressure.
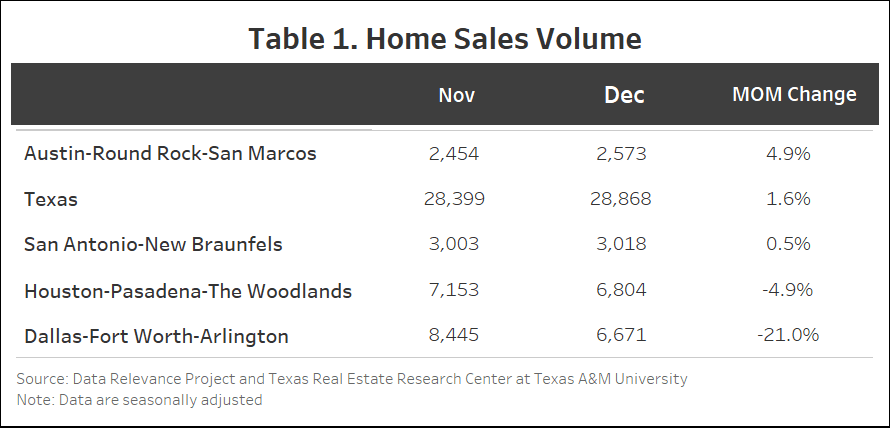
December’s Seasonality: Small Market Sales Up, Big Four Sales Down
In most years, sales rebound in December after a weak November, and this year is not any different. What was different was that December’s seasonal rebound was driven by strong sales in markets outside the Big Four. Statewide, there were 28,868 home sales in December, up 1.6 percent from November. In the major metros, aggregate sales volume (19,066) declined by 9.4 percent, driven by a 21 percent drop in DFW and a 4.9 percent drop in Houston. Sales were up 4.9 percent in Austin and 0.5 percent San Antonio. Outside the major markets, total home sales (9,802) surged 33.5 percent from November (Table 1).
First Positive YoY Sales Since 2022
Total statewide home purchases were up 10.7 percent from a year ago, marking the first time since the 2022 housing recession that sales volumes came in higher than the year before. These strong fourth-quarter sales were broadly seen across various markets. In the Big Four, was Austin saw 7.6 percent sales growth, DFW 16.4 percent, Houston 16.5 percent, and San Antonio 8.2 percent. Home sales were up an average of 6.7 percent in smaller markets.
Positive Trends in New Listings and Inventory
Statewide new listings were up slightly in December on a month-over-month (MoM) basis. Among the Big Four, new listings rose 2.7 percent in Austin, 2.6 percent in San Antonio, and 1.6 percent in Dallas, but declined in Houston by 2.4 percent. On a YoY basis, new listings were up 7.6 percent statewide, 7 percent in Austin, 10.8 percent in DFW, 14.9 percent in Houston, and 8.4 percent in San Antonio.
During December, statewide average days on market (DoM) was 63 days, comparable to the pre-pandemic turnover pace. Average DoM was 58 days in DFW, 77 days in Austin, 53 days in Houston, and 75 days in San Antonio.
At year-end, statewide active listings totaled 123,364, slightly lower than the previous month. Austin’s MoM decline (12.3 percent) was its slowest pace of MoM decline for a December since 2021. Active listings were down slightly in San Antonio (1.5 percent) and DFW (1.4 percent). Houston’s active listings were relatively unchanged in December.
Interest Rates Remain High During Inflation Concerns
In December, the average yield on the ten-year U.S. Treasury bond increased by 3 basis points to 4.39 percent despite the Fed cutting its policy rate target by another 25 basis points. Inflation has remained persistently above the Fed’s 2 percent target, and the December Consumer Price Index (CPI) data showed signs of re-acceleration. The Freddie Mac Primary Mortgage Market Survey’s 30-year fixed-rate mortgage ended December at 6.85 percent, up 16 basis points higher than at the start of the month.
New-Home Starts Increased
Statewide, building permits increased a sharp 17.7 percent MoM in December. Newly authorized permits surged 24.7 percent in DFW, while Houston and San Antonio maintained a modest upward trend, rising 5.8 percent and 2.5 percent, respectively. Building permits were relatively flat in Austin, down 1.7 percent.
Seasonally adjusted statewide single-family starts increased 9 percent MoM to 14,207 units. Houston and DFW had the highest increases at 14.4 percent (4,491) and 11.6 percent (3,670), respectively. New housing starts were up 8.4 percent (1,567) in Austin. Despite a small positive increase in building permits, San Antonio’s new single-family starts (802) dropped 14.8 from the previous month.
The state’s total value of single-family starts climbed from $29.8 billion in December 2023 to $40 billion in December 2024.
Texas HPI Up 2.1 Percent
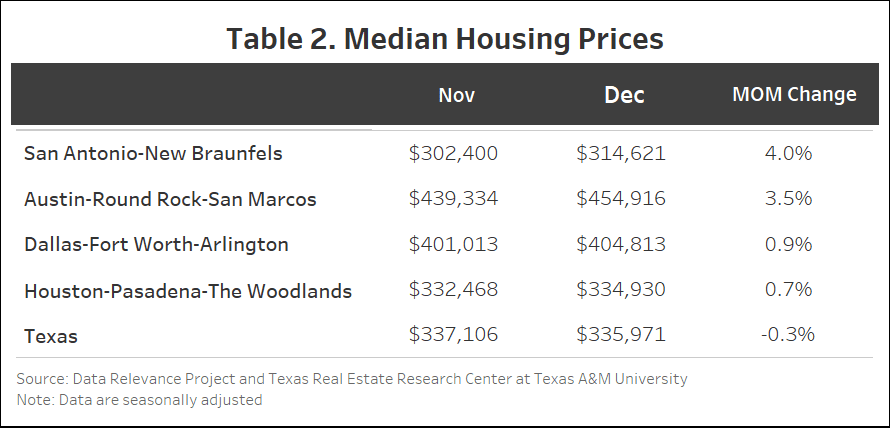
Texas’ median sales price was $335,971 in December, a 0.3 percent MoM drop (Table 2). San Antonio was up 4 percent to $314,621, Austin 3.5 percent to $454,916, DFW 0.9 percent to $404,813, and Houston 0.7 percent to $334,930.
The Texas Repeat Sales Home Price Index, which more accurately captures home price change over time than median sales price, fell 0.1 percent month over month in December but increased 2.1 percent from a year ago.
Spring is a wonderful time to explore the Dallas-Fort Worth area and experience some of the exciting festivals and events that take place during this season! From cultural celebrations to food festivals, there’s something for everyone to enjoy. Check out some of our favorite Spring Festivals below or download our list of Spring Festivals and Events in the DFW Area Resources section on our website here: https://www.republictitle.com/dfw-area-resources/
Whether you’re a lifelong resident or new to the area, there’s always something new to discover about your neighborhood. With that in mind, we created a Fast Facts sheet for cities and neighborhoods all over the DFW area. Our DFW Area fast facts have detailed real estate insights, things to do, places to shop and some of our favorite restaurants in each area.
Bedford, Texas, is a vibrant suburban city located in the heart of the Dallas-Fort Worth metroplex. Known for its family-friendly atmosphere, well-maintained parks, and strong community spirit, Bedford offers residents a comfortable and convenient lifestyle. The city features a range of amenities, including shopping centers, restaurants, and recreational opportunities, making it an ideal place to live for those seeking a blend of suburban tranquility and urban accessibility.
POPULATION
50K
AVERAGE HOUSEHOLD INCOME
$93K
MEDIAN AGE
38
HOUSING
53% OWN 47% RENT
AVERAGE SALES PRICE
$361K
AREA ACTIVITIES & FEATURES
• NRH20 INDOOR WATERPARK • VILLAGES OF BEAR CREEK PARK • TEXAS STAR GOLF COURSE • ALLEY CATS ENTERTAINMENT • CHISHOLM AQUATIC CENTER • LASERWHIRLD WHIRLEYBALL • C.R. SMITH AMERICAN AIRLINES MUSEUM • QUARTER LOUNGE ARCADE • BOWLERO ENTERTAINMENT CENTER • ONSTAGE IN BEDFORD THEATER
FAVORITE LOCAL DINING & DRINK SPOTS
• SAVIANO’S • YORI • HALA CAFÉ • KORACHA THAI RESTAURANT • OLDWEST CAFÉ • WOOD & GRAIN BISTRO • • TWO SISTER’S RESTAURANT • EVERYTHING GERMAN • • ZENA SUSHI • BIZZI’S BISTRO & WINE BAR • • FRED’S DOWNTOWN PHILLY • BRONCO’S SPORTS BAR & GRILL • GARDEN GRILLE RESTAURANT & BAR • RAMEN JOY • • ANA’S ISLAND GRILL • FROM ACROSS THE POND • ROSAKO’S SOUL FOOD & BBQ • PINEAPPLE GRILL • • AHOYAMA • FAZENDA GAUCHA • MID CITIES CAFE • • SUSHI SOHO • TEXAN KITCHEN • BAMBOO HOUSE • • LIZZANO’S PIZZA • RAVEN’S GRILLE • CRABS PEAK •
FAVORITE LOCAL SHOPPING
• SHOPS AT NORTHEAST MALL • THE TRAVELING SISTERS • • SHINE UNIQUE BOUTIQUE • HURST MARKETPLACE AND CREATIVE CENTER • GIRLIGIRL BOUTIQUE • DEEP DIVE VINTAGE • KELLY’S KLOSET •
AVERAGE DRIVE TIMES
• DOWNTOWN DALLAS | 45 MINUTES • DALLAS LOVE FIELD AIRPORT | 40 MINUTES • DFW INTERNATIONAL AIRPORT | 15 MINUTES • AT&T STADIUM & GLOBE LIFE FIELD | 23 MINUTES • DOWNTOWN FORT WORTH | 25 MINUTES