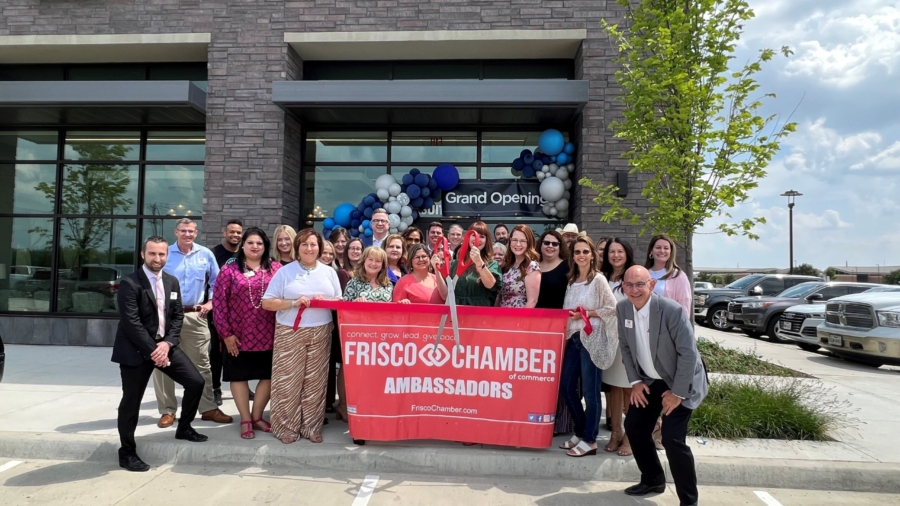
Housing-Insight-May-2022

Texas Housing Insight May 2022 Summary

Both U.S. and Texas’ construction permits shrank, posting the third decline in the last four months, signaling a future slowdown in national and state homebuilding. Although the projection on Texas’ year-end supplies decelerated, current supplies expanded as new listings and active listings grew. Record-high housing prices and robustly rising mortgage rates deterred many potential buyers. Housing sales lost nearly 5,600 transactions from January’s record level, shrinking 14.5 percent. Price disparities were conspicuous between Austin’s new-home and existing-home markets. Prices for the former were considerably less than the latter as pressure in the existing market intensified.

Supply1

Texas had been the No. 1 state for issuing housing permits since May 2006. In 2022, for every six single-family homebuilding permits issued in the U.S., one permit originated in Texas. Despite the large market share, under the projection of cooling housing markets, both national and Texas permits had a mid-single-digit reduction in May. The Lone Star State retreated 1,000 permits to a seasonally adjusted (SA) monthly rate of 15,000 units. Dallas—the second largest metro on the national list—contracted by 700 permits for the month. Furthermore, multifamily construction permits for Texas’ two-to-four units and five-plus units saw a double-digit reduction. This signals a forthcoming deceleration of housing supplies.

Lumber prices moderated at April’s price level, falling 14.5 percent year-over-year (YOY). Texas’ total housing starts hit a three-decade high last month with 26,915 SA units. The number returned to the year-ago average, hovering around 20,000 SA units this month. As starts for housing projects dipped, Texas’ single-family private construction values fell 10.4 percent month-over-month (MOM) to $3.7 billion, the largest monthly decline since last July. Private construction values shrunk in all metros except Austin as finished projects exited the local construction market faster than new projects entered. Although only falling marginally in May at an annualized rate, Dallas’ single-family construction appears to have lost momentum compared with Houston.

While new listings for existing homes continue to climb, new listings for new construction through the Multiple Listing Services (MLS) grew aggressively at 17.5 percent MOM. Overall, new listings grew for all four major metros and across all price cohorts. Overall active listings reflected the same trend. The rising number of homes ready for sale pulled Texas’ months of inventory (MOI) up to 1.5 months. A six-month MOI is considered a balanced housing market (Table 1). After hovering below the one-month benchmark for 19 consecutive months (since October 2020) and hitting a record low of 13 days in May 2021, Austin’s MOI finally rebounded above 31 days. The rising MOI means the sales pace to the number of available properties is improving. As Texas’ housing market frenzy started to ease, MOIs in the major metros all advanced four to ten days.

Prices

Although housing inventories slowly started to build up, housing prices did not immediately reflect the supply shift. The Texas median home price hit a record high every month starting in January 2021, and the median price rose to a record-breaking $354,000 this month, climbing over 25 percent since the beginning of 2021 (Table 2). All metros hit new price levels. Austin ($534,000) and Dallas ($446,000) were the two most expensive metros in which to own a single-family home. Amid all expanding metros, the median price growth was most notable in Austin where it rose almost 40 percent since January 2021. Data suggest in Austin it may be more affordable to buy a new home than hunt for an existing one. The median price for new homes sold in Austin through the MLS was $437,000, more than $100,000 less than the price of existing homes. In either case, housing in Austin is still out of reach for many potential buyers. Median prices in San Antonio ($337,000), Houston ($341,000), and Fort Worth ($373,000) advanced at a double-digit rate, albeit at a slower rate.

The Federal Reserve is expected to reduce its balance sheet assets and increase the Federal Funds rate several more times by the end of 2022. The ten-year U.S. Treasury bond yield shot up to 2.9 percent2, increasing 15 basis points in one month. The spread difference between the ten-year and the two-year bond yields rebounded 7 basis points to 0.3 percent, yet the spread between the two was still alarmingly low, signaling economic uncertainties and rising risks in the near future. The Federal Home Loan Mortgage Corporation’s 30-year fixed-rate, which for years hovered around 3 percent, elevated to 5.23 percent. The last time the mortgage rate was this high was in 2008. For more information on the effect of mortgage interest rates on purchase affordability, see “How Higher Interest Rates Affect Homebuying.”

The Texas Repeat Sales Home Price Index accounts for compositional price effects and provides a better measure of changes in single-family home values. Texas’ index corroborated substantial and unsustainable home-price appreciation, soaring 18.7 percent YOY. Dallas’ and Fort Worth’s index rose 26.4 and 24.6 percent, respectively, as home-price appreciation shot up in North Texas. Meanwhile, the metrics climbed around 19 percent in a year for the other three metros. Increasing home prices pressure housing affordability, particularly in an economic environment where mortgage rates are hiking and real wage growths are slow.

Demand

Record home prices and rapidly rising mortgage rates discouraged buyers and cooled the market. According to the MLS, total Texas housing sales peaked in January with nearly 39,000 transactions. Sales have declined each month since then. Total housing sales fell to a seasonally adjusted rate of 33,097, down 1,080 deals from April’s housing transactions. Sales in all major metros declined under the price pressures. Houston closed 9,100 sales, contributing one-third of the state’s total lost transactions. Dallas followed with 5,700 closed deals. Austin, Fort Worth, and San Antonio hovered around 3,000 units, each losing around 100 home transactions. Home appreciation drastically changed the price structure of home purchases. Housing sales slipped by double-digit percent for homes priced below $400,000, while transactions for more expensive homes (greater than $750,000) accelerated for the sixth month.

Texas’ average days on market (DOM) inched down to 28 days, the lowest on record. The historical low DOM indicated buyers’ eagerness to own a house. Austin and North Texas’ home purchases were the most frequent, closing in 20 days. Houston and San Antonio’s DOM inched down to 29 and 30 days, respectively. When days on market were differentiated based on the home market, the new home’s DOMs were notably higher than existing home’s, especially in the Houston area where homes lasted 61 days on average in the former market and 23 days in the latter. The existing-home market is hot. 

Homes in the $300K and $400K price cohorts sold fastest, typically leaving the market in 27 days. Homes under $300K had a longer market duration. Many of these homes may be older and not market-ready.

Note: Data collection for Household Pulse Survey was paused in May because the U.S. Census Bureau was making survey revisions. The survey analysis will resume in June.

________________

1 All measurements are calculated using seasonally adjusted data, and percentage changes are calculated month over month, unless stated otherwise.
2 Bond and mortgage interest rates are nonseasonally adjusted. Loan-to-value ratios, debt-to-income ratios, and the credit score component are also nonseasonally adjusted.

Source – Joshua Roberson and Weiling Yan (July 25, 2022)

https://www.recenter.tamu.edu/articles/technical-report/Texas-Housing-Insight

August-Landscape-tips

August Landscape & Gardening Tips & To-Do’s

Need help planting a successful garden or landscape? Here are some August planting tips from the Dallas Arboretum horticulture staff and the Dallas County Master Gardeners that can help keep your home garden looking beautiful this Fall. Lawn and garden maintenance should be your focus in August.

  • Proper watering is crucial in August. Apply one to two inches of water per week to -landscaping.
  • Keep an eye out for webworms in trees. Use a garden hose to blast them out of the trees with water or cut them out with pole pruners.
  • Plant vegetable crops, including corn, tomatoes, and beans, for fall harvest.
  • Plant seasonal annuals such as marigolds and ornamental peppers for fall interest.
Favorite-Indoor-Spots

Favorite Spots for Indoor Fun in DFW

Another Round | Indoor Putt Putt | Dallas
Chicken & Pickle | Pickleball | Grand Prairie
Children’s Aquarium at Fair Park | Dallas
Crayola Experience | Plano
Crush It | Virtual Sports | Grapevine
Dallas Circus Center | Dallas
Electric Gamebox | Virtual Gaming | The Colony
Electric Shuffle | Shuffleboard | Dallas
Evo Cinemas | Entertainment Center | Southlake
Farm & Feed | Indoor Gaming | Plano
Frontiers of Flight Museum | Dallas
Gatsplat | Indoor Paintball | Ft. Worth
House of Shine | Interactive Museum | Grapevine
Kidzania | Children’s Amusement Center | Frisco
Kimball Art Museum | Ft. Worth
Legoland | Family Theme Park | Grapevine
Medieval Times | Dinner Theatre | Dallas
Modern Art Museum | Ft. Worth
Museum of Illusions | Dallas
National Video Game Museum | Frisco
Rainbow Vomit | Immersive Art | Dallas
Seaquest | Interactive Aquarium | Ft. Worth
Super Fort Wars | Fort Building | Ft. Worth
The 6th Floor Museum | Dallas
The Dallas World Aquarium | Dallas
The Perot Museum | Dallas
UTA Planetarium | Arlington
Whirlyball | Indoor Sport | Plano

NEED MORE ACTIVITY IDEAS? CHECK YOUR AREA FOR:
• arcades
• antique shopping
• axe throwing
• bowling alleys
• breweries
• escape rooms
• ice skating
• inflatable indoor playgrounds
• indoor obstacle courses
• Indoor rock climbing
• indoor sky diving
• indoor water parks/natatoriums
• movie theaters
• painting/art studios
• roller skating
• shopping malls
• trampoline parks

Important-After-Closing-Reminders-for-Buyers

Important After Closing Reminders for Buyers

Congratulations! You’ve just closed on the purchase of your new home! Here is a helpful list of important to-dos and reminders for after closing:

  1. A copy of the recorded Warranty Deed
    that transferred title of the property will be sent to you via email with your Owner’s Title Policy approximately one month after closing. Your Owner’s Title Policy should be printed and stored for safe keeping and/or saved on your personal computer.
  2. It is the taxpayer’s responsibility to be certain the property is rendered in the current taxpayer’s name
    for the upcoming tax year. Contact the County Appraisal District (CAD) for assistance in making certain this is done.
  3. Make certain to file your homestead designation with the County Appraisal District.
    If you have any questions about your homestead exemption for property tax purposes, or any other exemption which may be available to you, please contact your County Appraisal District. The forms necessary to apply for exemptions are available online from your Appraisal District at no cost. See the reverse side of this card for area County Appraisal District’s website and contact information.
  4. Contact the Home Warranty company if you received a home warranty and want additional coverage.
    If you received a Home Warranty (also known as a Residential Service Contract) in connection with your recent closing and wish to add additional coverage, please contact the Home Warranty company directly.

Collin County
Collin County Central Appraisal District
collincad.org | 469.742.9200

Dallas County
Dallas County Central Appraisal District
dallascad.org | 214.631.0520

Denton County
Denton County Central Appraisal District
dentoncad.org | 940.349.3800

Grayson County
Grayson County Central Appraisal District
graysonappraisal.org | 903.893.9673

Johnson County
Johnson County Central Appraisal District
johnsoncad.com | 817.648.3000

Kaufman County
Kaufman County Central Appraisal District
kaufman-cad.org | 972.932.6081

Rockwall County
Rockwall County Central Appraisal District
rockwallcad.com | 972.771.2034

Tarrant County
Tarrant County Central Appraisal District
tad.org | 817.284.0024

Exemption forms can be downloaded from the Central Appraisal District’s website for the county in which the property is located.

Click here for print version

Slide1

June 2022 DFW Area Real Estate Stats

June stats are here and we have the numbers! 

In June, home inventory increased in each county with new listings up ranging from 6% to 32% over June 2021. There is also an increase in inventory compared to last month in each county which is welcome as the DFW housing market has experienced tight supply conditions for some time. Average sales prices are up ranging from 15% in Dallas County to 27.9% in Collin County compared to June 2021. According to the Home Buying Institute, we are still in a seller’s market, but “these recent trends should make things a bit easier for buyers going forward”.

Our stats infographics include a year over year comparison and area highlights for single family homes broken down by county. We encourage you to share these infographics and video with your sphere.

For more stats information, pdfs and graphics of our stats including detailed information by county, visit the Resources section on our website at DFW Area Real Estate Statistics | Republic Title of Texas.

For the full report from the Texas A&M Real Estate Research Center, click here. For NTREIS County reports click here.

Important-After-Closing-Reminders-for-Sellers

Important After Closing Reminders for Sellers

1. Cancel your homeowners insurance with your insurance agent
once the transaction has closed, funded and your personal items have been removed from the home. There may be a prorated refund of your homeowner’s policy, based on the latest renewal date, owed to you. If you are remaining at the property after closing, you should notify your insurance agent of this change.

2. Cancel your automated deduction
for your house payment with your current lender if applicable.

3. Your lender will refund all monies left in your escrow account
approximately 15 to 30 business days after receipt of the payoff funds. The lender will mail a package containing your original Promissory Note marked “PAID” and other loan documents. Retain these for future reference. When you receive this confirmation, you may also receive a “Release of Lien” document from your lender. If the release has not already been recorded with the County Clerk’s office, please forward it to your closer at the title company and we will send it to the county to be filed, thereby releasing the lien of record.

4. Refer to your closing statement
Depending on what time of the year you sold your property, the Taxing Appraisal District may not have updated the account to show a change in ownership. If you receive a Tax Bill for the property that you sold, refer to your closing statement and send the bill to the new owners.

5. Important to note
You will receive a Substitute Form 1099-S from Republic Title within 30 days of closing. In addition, retain your closing statement, it serves as a Substitute Form 1099-S for tax purposes.

Click here for print version

ABCs-of-the-Title-Commitment2

The ABC’s of Title Commitment

A commitment is a document the title company provides to all parties connected with a particular real estate transaction. It discloses the title of record to the property as well as all the liens, defects, burdens and obligations that affect the subject properties. It is comprised of four schedules. Schedules A, B, C, and D are as follows:

A – Actual Facts – Is the Who, What, Where and How Much section of the commitment. You will see the names of the buyer, record owner (seller), a legal description of the property, the sales price and the name of the lender, if applicable. It is a good idea to double check this information with the contract.

B- Buyer Notification – This section lists the general and specific exceptions to the property. It will list items such as survey matters, taxes, easements, setback lines and a variety of other items that will not be covered by the title policy. It is important to review and discuss any questions you have with your title company.

C- Clear In Order To Close – These items must be resolved in order to transfer title to the new owner. They might include such things as a mortgage that will be paid off at closing, liens for home improvements or unpaid taxes. All items shown on Schedule C should be discussed and resolved before the closing.

D – Disclosure – This section outlines the ownership of the title company and all the parties who will share in any part of the insurance premium collected to issue the policy. It includes underwriters, title agents and attorneys.

This information is not to be substituted as legal advice and is descriptive only. If you have any concerns about any portion of your title commitment or any portion of Schedule A,B,C, or D, please contact your attorney. 

Housing-Insight-April-2022

Texas Housing Insight April 2022 Summary

Record housing prices and rapidly rising mortgage rates are making homebuyers reconsider the value of home purchases. In April, the median single-family price climbed to almost $350,000 in Texas, and the national mortgage rate rose almost 2 percent in the span of one year, making home purchases a challenge especially for first-time buyers. Seasonally adjusted home sales declined for three consecutive months since January’s peak, and the weighted loss on homes valued less than $300,000 reflected first-time buyers’ pause. Meanwhile, more expensive homes had a marginal sales increase. The unusually low inventories persisted. However, demand in building permits rebounded in April. The growing future supplies and the steep borrowing rates are expected to slow home-price growth and cool the frenetic housing market.

Supply1

The Residential Construction Cycle (Coincident) Index, which measures current construction levels, trended upward nationally and in Texas due to increased industry wages, employment, and construction values. Both the Texas and U.S. Residential Construction Leading Index indicated construction activity is expected to strengthen in the coming months as weighted building permits and employment continue to elevate.

Building permits for U.S. future single-family homes decreased for the second month, signaling a cooling housing market at the national level. In Texas, on the other hand, permits rebounded to a seasonally adjusted (SA) monthly rate of 16,000 units after March’s marginal decrease. Houston and Dallas topped the national list with 4,800 and 4,700 non-seasonally adjusted permits, respectively. Austin and San Antonio issued 2,100 and 1,400 permits, respectively. In Texas’ multifamily sector, increased April permits revealed leading growth in two-to-four units.

Unlike last year’s series of price hikes when winter ended and construction season started, lumber price moderated in April, falling sharply with a double-digit decline from March. Supported by the sudden drop of building input costs, Texas’ total housing starts rebounded this month along with construction starts in the southern region of the U.S. As housing starts inched up, Texas’ single-family construction values increased 2.7 percent month-over-month (MOM). However, they were down for the 11th month compared with year-ago values. At the state level, private construction values in 2022 were all lower than 2021’s same-period values. At the metropolitan level, private construction values were mixed, with Dallas and San Antonio falling from mid-2021 peaks and Houston and Austin surpassing previous values and peaking in early 2022. Austin and Houston increased 11.6 and 8 percent year-to-date (YTD), respectively, while Dallas and San Antonio registered losses.

New listings for existing and new construction expanded in April. New-home listings were up 7,200 SA compared with 2021’s monthly average of 6,200 units. Total active listings had a10.4 percent MOM hike, pulling Texas’ months of inventory (MOI) up to 1.3 months (Table 1). Before March, the state’s MOI fell five consecutive months to a record low of 1.2 months (a total MOI around six months is considered a balanced housing market). The rebound was evident for every price cohort, and it signaled a less heated housing market. The rebound was most significant for homes priced between $500,000 and $749,999 with 0.3 months lengthened market time. Homes priced under $400,000 remained the most constrained with 1.2 months, and the expansion for this price cohort was moderate.

April’s MOI metrics of the major metros broke down the trend of the statewide metric. MOI was up in every major metro in April as active listings expanded. Austin had the largest monthly gain in active listings (30.8 percent), while Houston grew 9.2 percent to a rate of 12,800 SA units, contributing nearly one-third of the state’s total housing inventories. Dallas and Fort Worth, which flattened at record-low MOI’s for all three months in 2022Q1, rose for the first time this year. Furthermore, new listings in San Antonio made up 93 percent of the metro’s record supply in December 2021, signaling more sellers had entered the local housing market.

Prices

A shift in the composition of sales toward higher-priced homes due to constrained inventories at the lower end of the market contributed to home-price appreciation. The Texas median home price continuously hit record highs starting in January 2021, and the median price rose to a record-breaking $349,000 this month, climbing over 25 percent since then. Austin ($530,000) and Dallas ($439,000) were the two most expensive metros in which to own a single-family home. Amid all expanding metros, the median price growth was most notable in Austin at 37.6 percent. The tech metro’s exponential growth brought the price gap between Austin and Dallas from $49,000 in January 2021 to $91,000 in April 2022. Meanwhile, median prices in San Antonio ($325,000), Houston ($337,000), and Fort Worth ($370,000) advanced at a double-digit rate. Houston was the slowest at raising its housing price in terms of price per square foot since 2010.

The Federal Reserve is expected to reduce its balance sheet assets and increase the Federal Funds rate at least six more times in 2022. The ten-year U.S. Treasury bond yield shot up to 2.75 percent2 in April, increasing 62 basis points in one month. The spread difference between the ten-year and the two-year bond yields shrunk to 21 basis points, the lowest since February 2020. The Federal Home Loan Mortgage Corporation’s 30-year fixed-rate, which for years hovered around 3 percent, elevated to 4.98 percent this month. Rising interest rates deterred potential borrowers, and as a result the loan counts for both the GSE and non-GSE loans shrunk by half.

The Texas Repeat Sales Home Price Index accounts for compositional price effects and provides a better measure of changes in single-family home values due to changes in market forces alone. Texas’ index corroborated substantial and unsustainable home-price appreciation, soaring 19.9 percent YOY. Dallas’ and Fort Worth’s index rose 27.7 and 25 percent, respectively, as home-price appreciation shot up in North Texas. Meanwhile, the metrics climbed around 20 percent in a year for the other three major metros. Increasing home prices pressures housing affordability, particularly in an environment of mortgage rate hikes and low real wage growth.

Demand

According to the Multiple Listing Service (MLS), seasonally adjusted total housing sales peaked in January with nearly 39,000 transactions in the state. Sales have declined monthly since then. In April, total housing sales fell to 34,000 closed listings. Sales in all major metros declined under the price pressures. Houston had 9,500 sales in April, down 1,400 from the January record. Dallas followed with 5,800 closed deals. Austin, Fort Worth, and San Antonio hovered around 3,000 sales, each losing hundreds of home transactions.

Home appreciation drastically changed the price structure of housing sales. Sales slipped 6.2 percent for homes priced below $500,000, while transactions for more expensive homes increased about 1 percent. The slip weighed heavily on homes priced below $300,000, and the market share for these homes shrank from 50 percent April 2021 to 35 percent.

Texas’ average days on market (DOM) inched down to 30 days after a small rebound in February. In Austin and North Texas, the average home sold fastest, staying on the market for only 21 days. San Antonio’s DOM matched the statewide metric, while Houston’s steadied at 34 days. Categorized by price cohorts, homes priced in the $300K cohort sold fastest, typically leaving the market in 28 days. Homes less than $300K had a conspicuously longer market duration. Despite major housing shortages in affordable housing, many of these homes, which had below-average asking prices and above-average DOMs, may be in poorer condition than normal market expectations, illustrating the limits to housing demand.

Household Pulse Survey

More Texas homeowners were on pace with mortgage payments. According to the U.S. Census Bureau’s Household Pulse Survey, the share of Texas homeowners behind on their mortgage payments inched down from last April, along with the national average (Table 2). DFW’s metric also ticked down, while Houston’s rate remained unchanged. The share of Texas respondents who were either very likely or somewhat likely to forfeit in the next two months was at 11 percent, while nationally it was 19 percent (Table 3). The proportion of delinquent individuals who were at little of foreclosure was optimistic in North Texas. The metric was less upbeat in Houston.

________________

1 All measurements are calculated using seasonally adjusted data, and percentage changes are calculated month over month, unless stated otherwise.
2 Bond and mortgage interest rates are nonseasonally adjusted. Loan-to-value ratios, debt-to-income ratios, and the credit score component are also nonseasonally adjusted.

Source – Joshua Roberson and Weiling Yan (July 1, 2022)

https://www.recenter.tamu.edu/articles/technical-report/Texas-Housing-Insight

July-Gardening-Tips

July Landscape & Gardening Tips & To-Do’s

Need help planting a successful garden or landscape? Here are some July planting tips from the Dallas Arboretum horticulture staff and the Dallas County Master Gardeners that can help keep your home garden looking beautiful this Fall. Lawn and garden maintenance should be your focus in July.

  • July is the month to start your fall tomato garden.
  • Begin trimming spent flower stalks on perennials.
  • If you haven’t done so already, cut back some overgrown annuals (such as impatiens and coleus) and perennials (such as asters and salvia). A light shearing can help prevent the plants from falling over.
  • Roses can be trimmed back now by one-third to one-half so they will rejuvenate for the fall season.
  • Mature or overgrown climbing roses can be shaped up now without damaging next year’s bloom potential.
  • As it continues to heat up outside, keep your plants well watered.
  • Continue mowing your lawn once per week to maintain good healthy growth and reduce any unnecessary wear and tear on lawn equipment.
  • Continue fertilizing your lawn and garden with a high nitrogen fertilizer, following recommended application rates.
DFW-Breweries

Breweries in DFW

Cool off on a hot summer day with a cold one at a local brewery 🍺 DFW is full of breweries that are serving up handcrafted beers and even offer tours and game nights. Save this list for some July 4th fun and enjoy a cold one!
 
For more resources like this, visit our DFW resources page at republictitle.com/dfw-area-resources

ADDISON
Bitter Sisters Brewery
15103 Surveyor Blvd.
bittersistersbrewery.com

ARLINGTON
Division Brewing
506 E. Main St.
divisionbrewing.com

BEDFORD
Turning Point Beer
1307 Brown Tr.
turningpointbeer.com

CELINA
Rollertown Beerworks
412 N. Oklahoma St. #106
rollertownbeerworks.com

DALLAS

Bishop Cider
509 N. Bishop Ave.
bishopcider.com

Community Beer
3110 Commonwealth Dr.
communitybeer.com

Deep Ellum Brewing
2823 St. Louis St.
deepellumbrewing.com

Four Corners Brewing
1311 S. Ervay St.
fcbrewing.com

Manhattan Project Beer
2215 Sulpher Sr.
manhattanproject.beer

Oak Cliff Brewing
1300 S. Polk St.
oakcliffbrewing.com

Oak Highlands Brewery
10484 Brockwood Rd.
oakhighlandsbrewery.com

Outfit Brewing
7135 John W. Carpenter Fwy.
outfitbrewing.com

Pegasus City Brewery
1508 Commerce
pegasuscitybrewery.com

Peticolas Brewing
1301 Pace St.
peticolasbrewing.com

Steam Theory Brewing
340 Singleton Blvd.
steamtheorybrewing.com

Texas Ale Project
1001 N. Riverfront Blvd.
texasaleproject.com

White Rock Alehouse
7331 Gaston Ave.
whiterockalehouse.com

CARROLLTON
Three Nations Brewing
1033 Vandergrill Dr.
3nationsbrewing.com

FORT WORTH
Cowtown Brewing
1301 E. Belknap St.
cowtownbrewco.com

HopFusion Ale Works
200 E. Broadway Ave.
hopfusionaleworks.com

Martin House Brewing
220 S. Sylvania Ave.
martinhousebrewing.com

Panther Island Brewing
501 N. Main St.
pantherislandbrewing.com

Rahr & Sons
701 Galveston Ave.
rahrbrewing.com

Wild Acre Brewing
1734 E. El Paso St.
wildacrebrewing.com

GARLAND
Lakewood Brewing
2302 Executive Dr.
lakewoodbrewing.com

GRANBURY
Revolver Brewing
5650 Matlock Rd.
revolverbrewing.com

GRAPEVINE
Grapevine Craft Brewery
906 Jean St.
grapevineontap.com

KELLER
Shannon Brewing
818 N. Main St.
shannonbrewing.com

MANSFIELD
Dirty Job Brewing
117 N. Main St.
dirtyjobbrewing.com

MCKINNEY
Franconia Brewing
495 McKinney Pkwy.
franconiabrewing.com

Tupps Brewery
721 Anderson St.
tuppsbrewery.com

PLANO
Union Bear Brewing
5880 Texas 121
unionbear.com

Unlawful Assembly Brewing Co.
7800 Windrose Ave.
unlawfulassembly.com

RICHARDSON
Four Bullets Brewery
640 N. Interurban St.
fourbulletsbrewery.com

ROWLETT
Bankhead Brewing
3840 Main St.
bankheadbrewing.com

FARMERS BRANCH
Cedar Creek Brewery
13090 Bee St.
cedarcreekbrewery.com

SHERMAN
Cellerman’s Pub & Brewery
2130 Texoma Pkwy.
cellarmanspub.com

903 Brewers
1718 S. Elm St.
903brewers.com

WAXAHACHIE
Railport Brewing
405 W. Madison St.
railportbrewing.com

WILLOW PARK
Parker County Brewing
225 Shops Blvd.
parkercountybrewing.com