Blog Graphic

February 2022 DFW Area Real Estate Stats

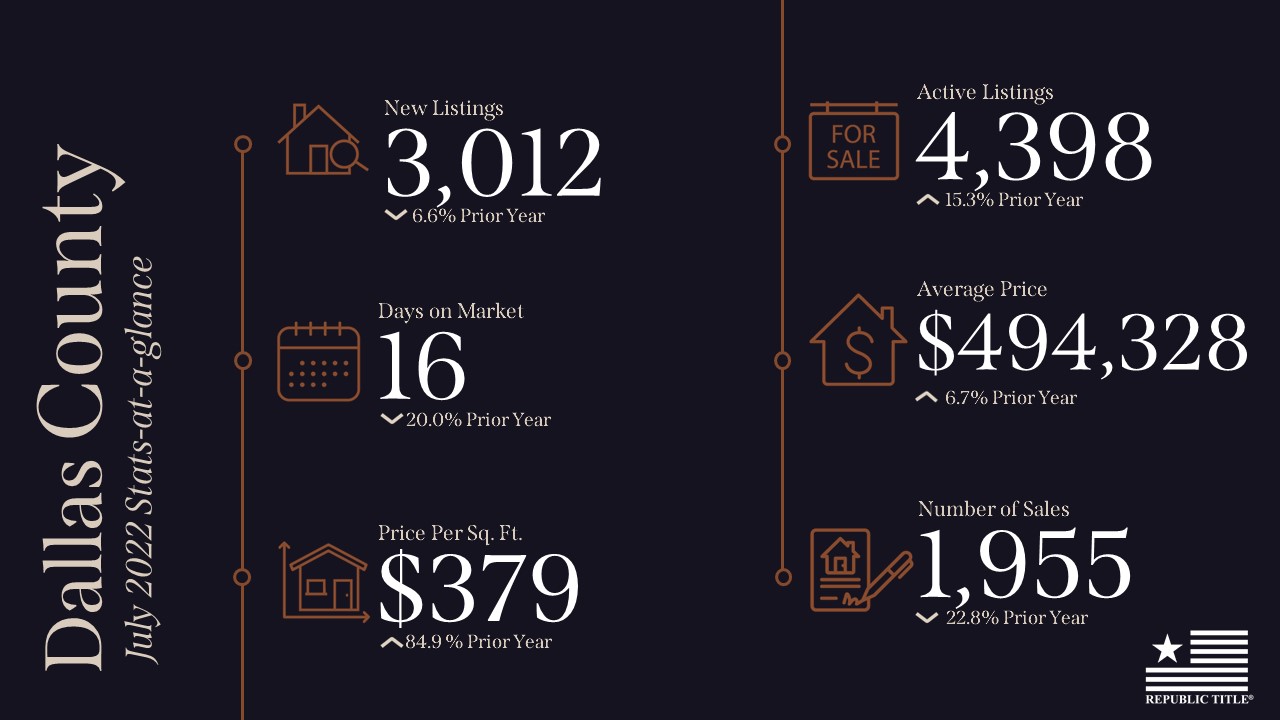
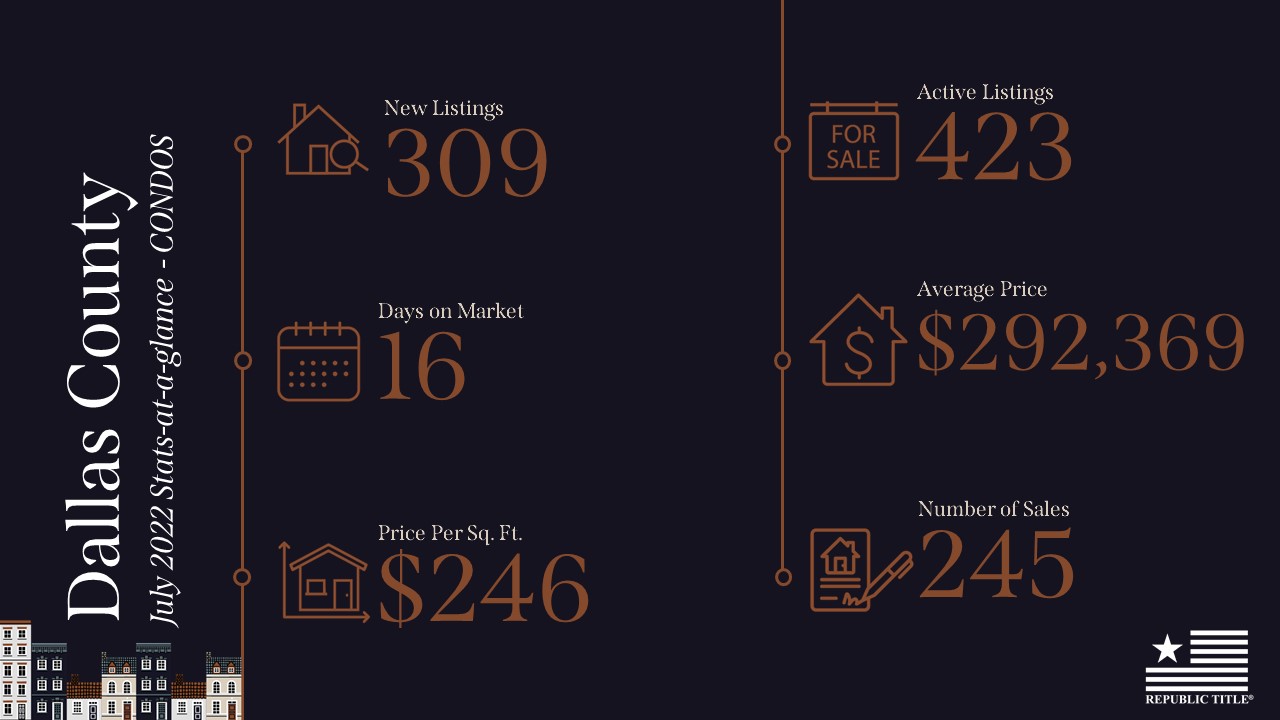
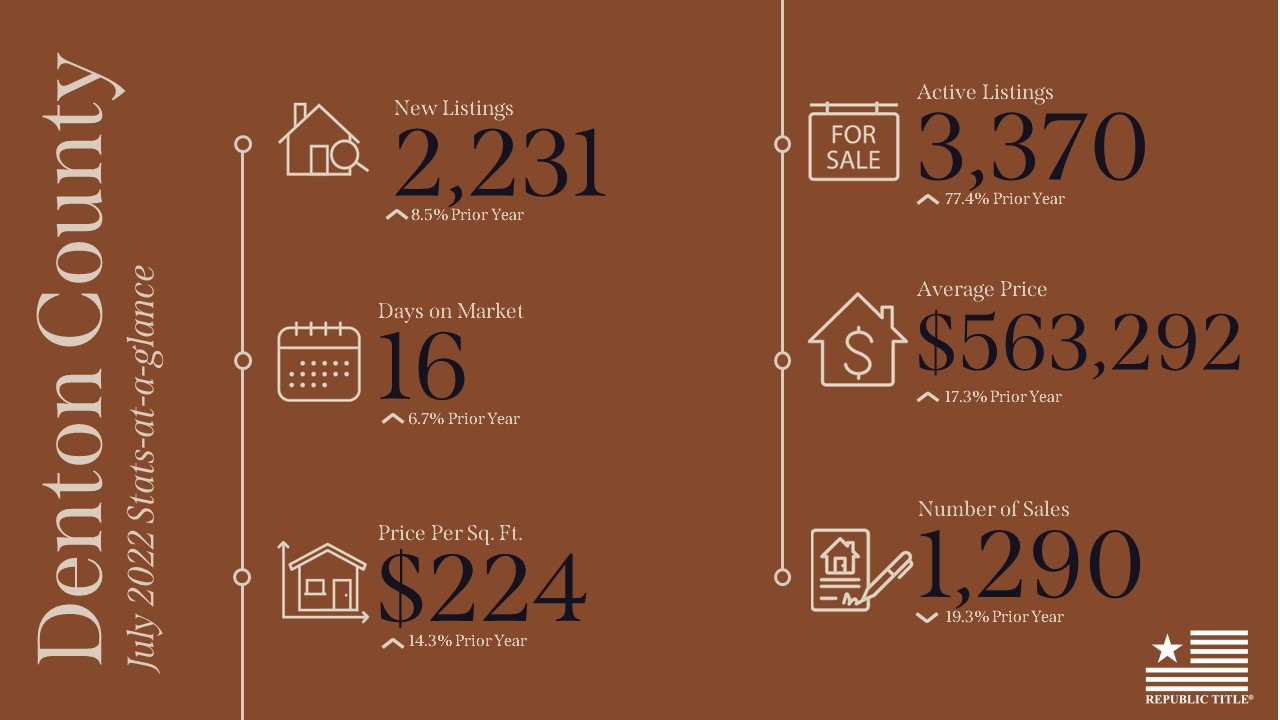
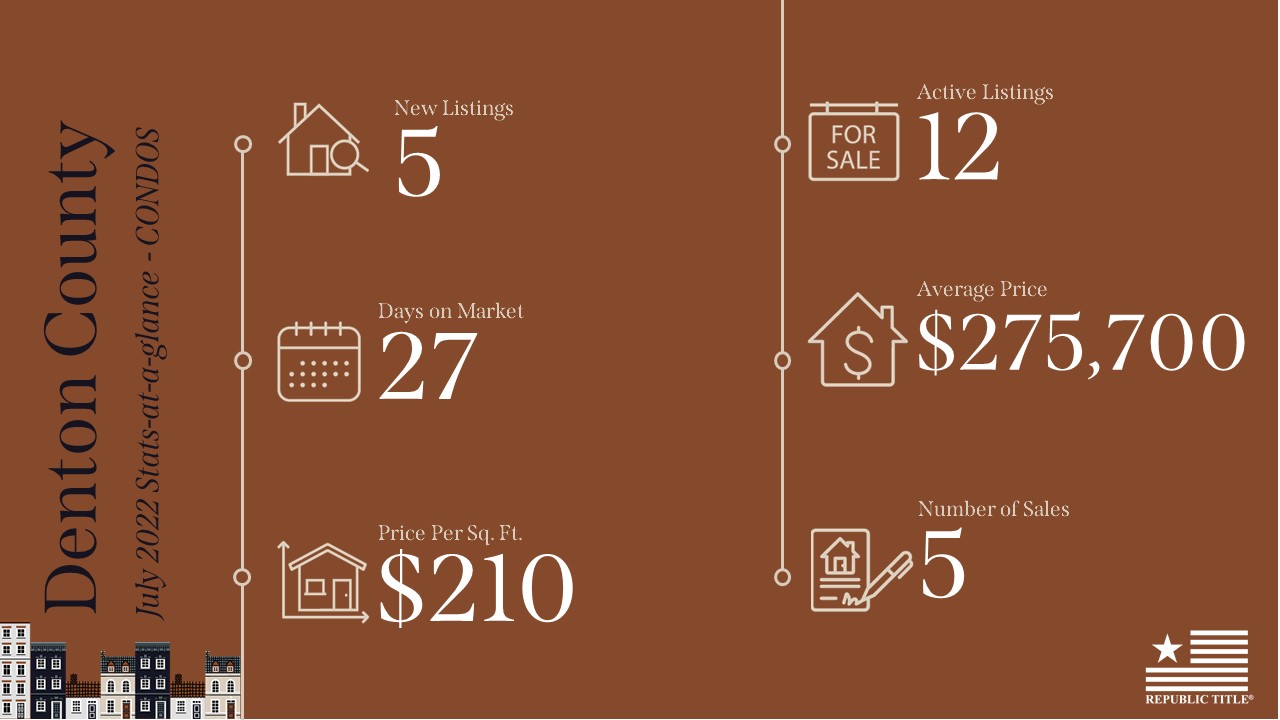
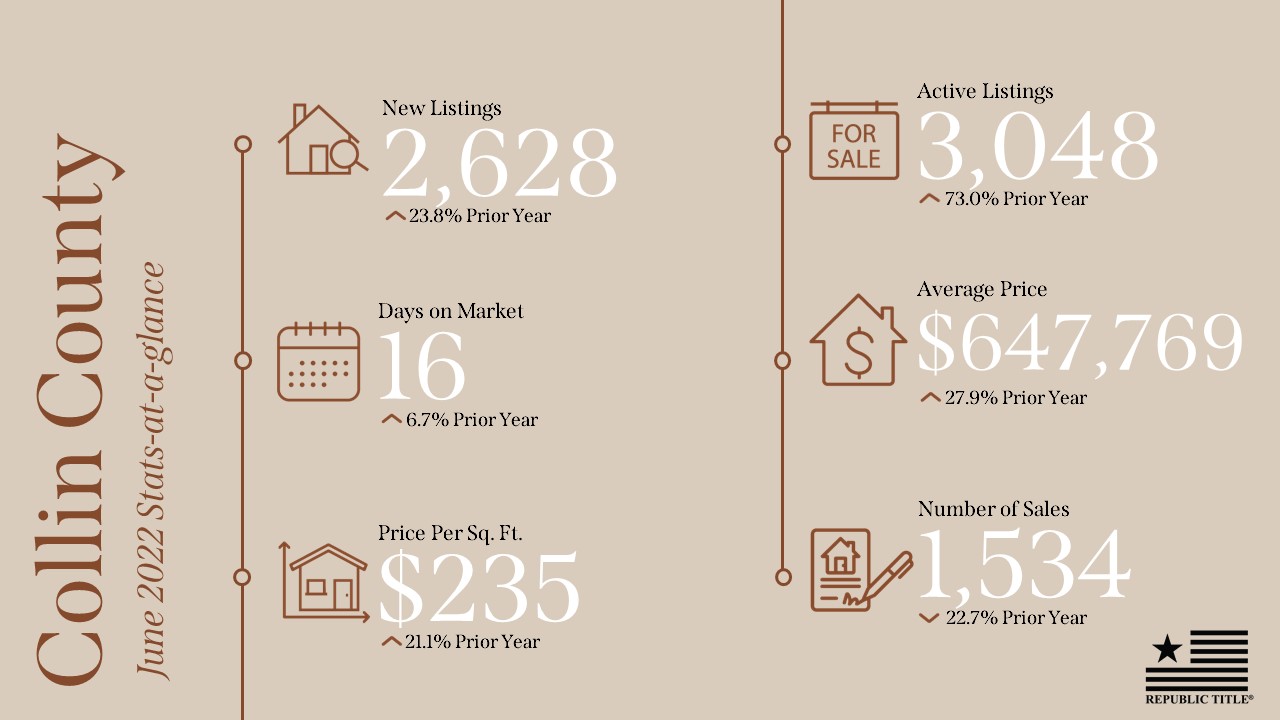
February stats are here and we have the numbers! 

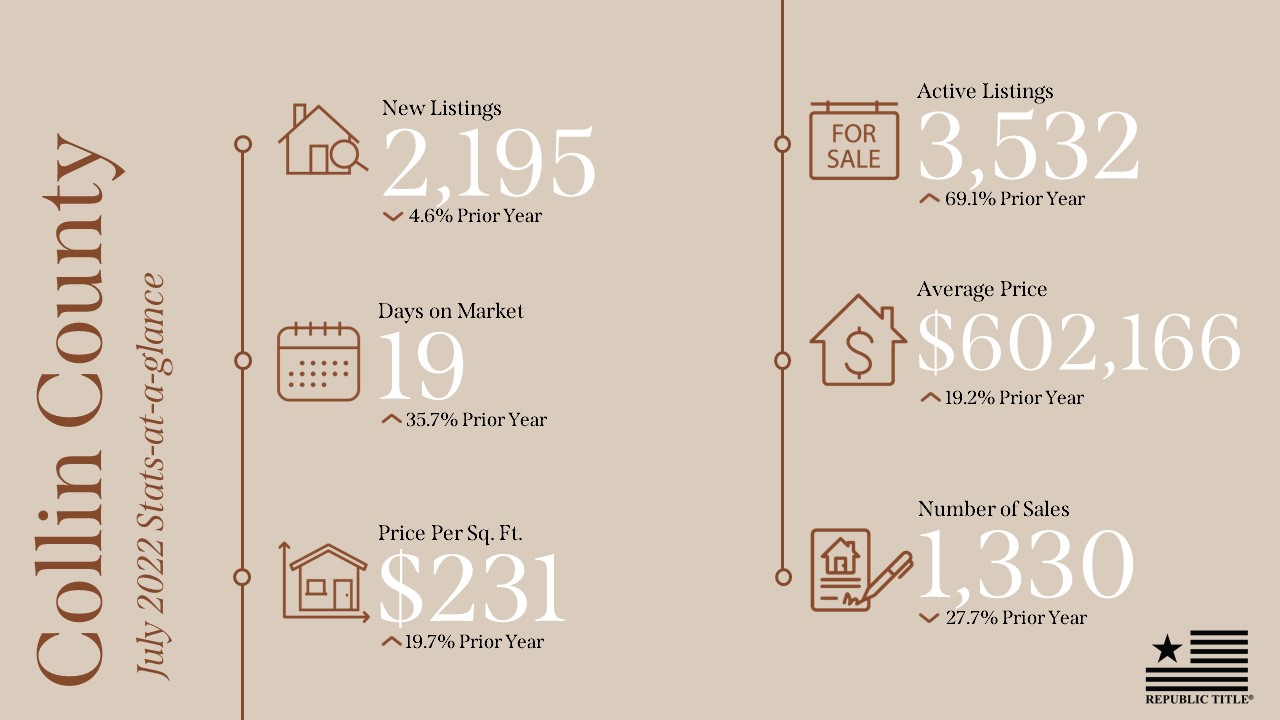
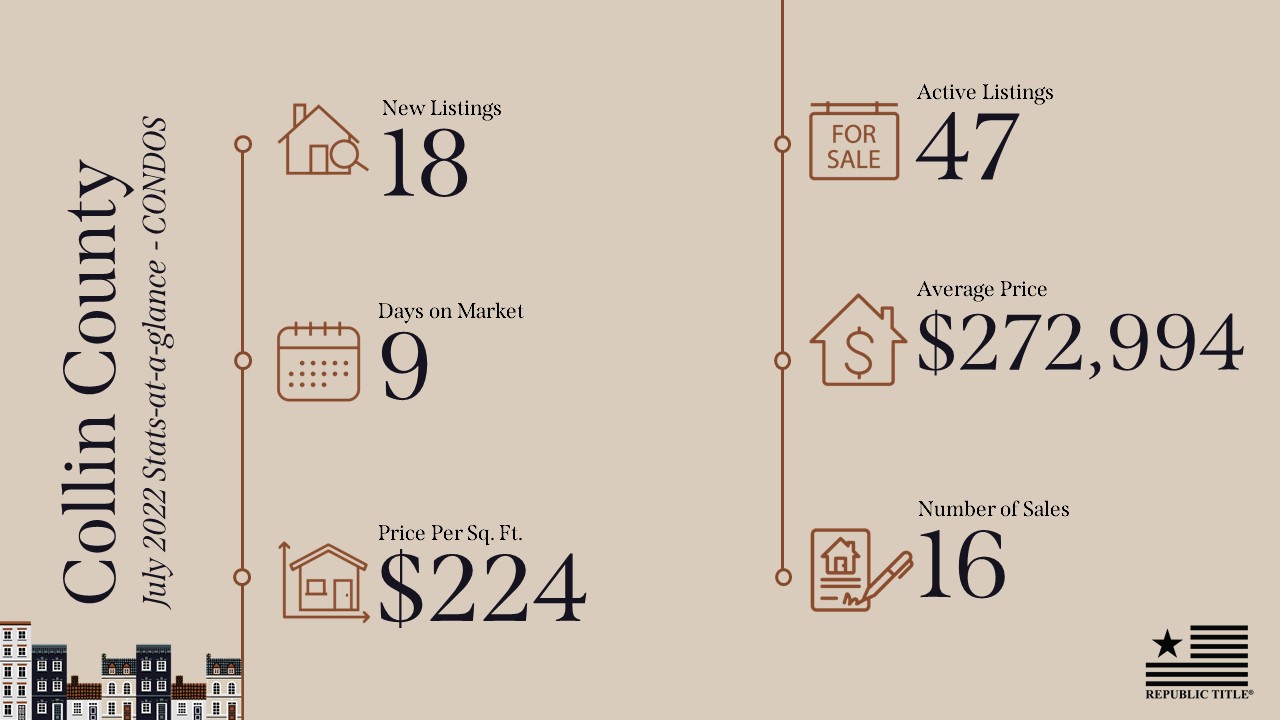
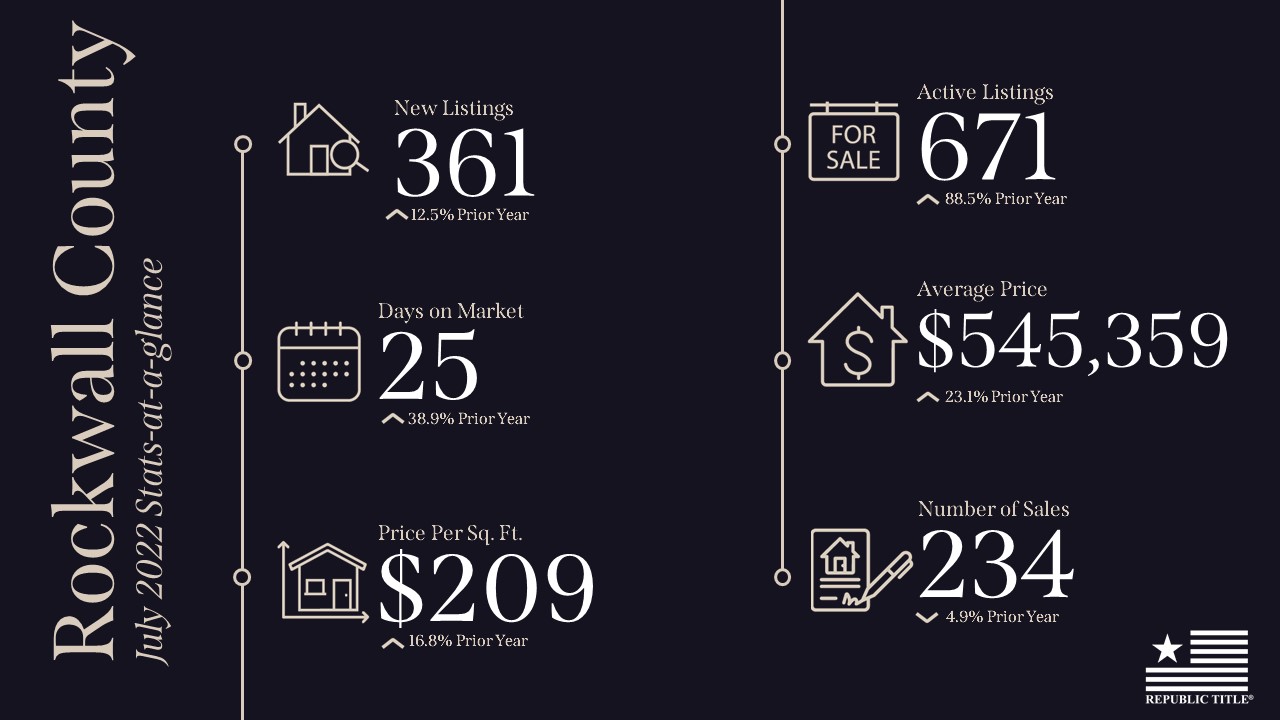
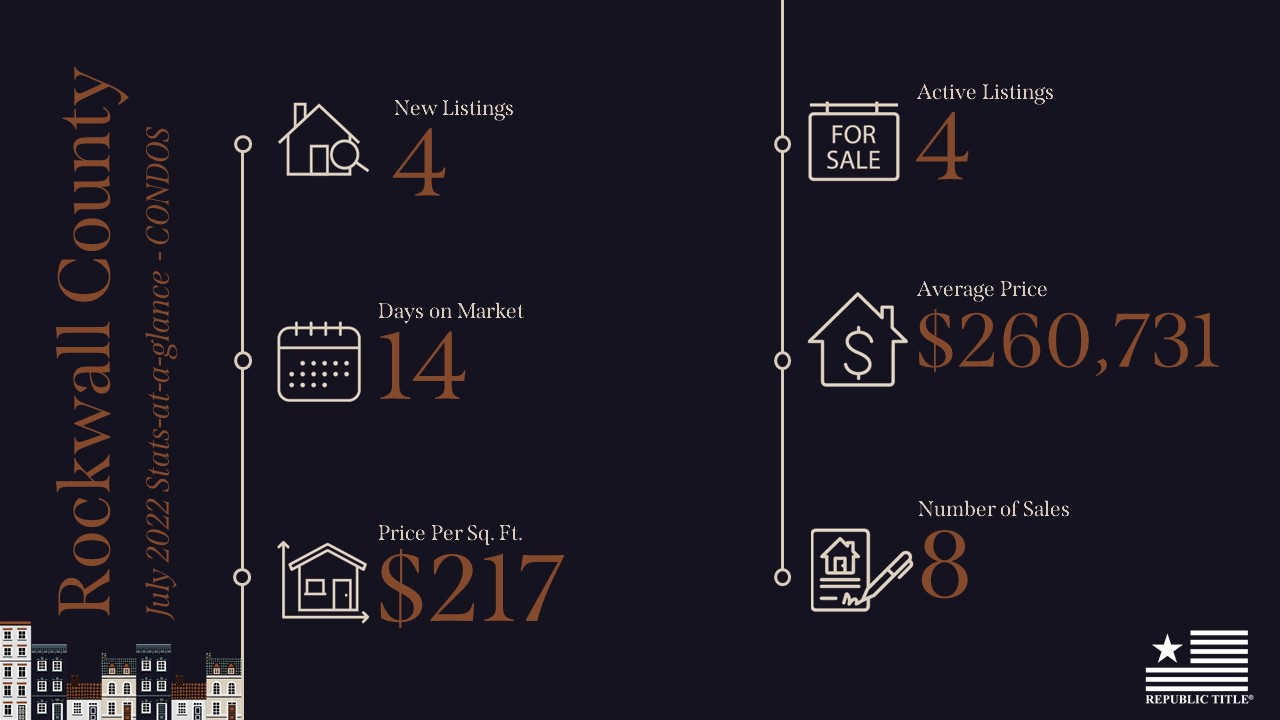
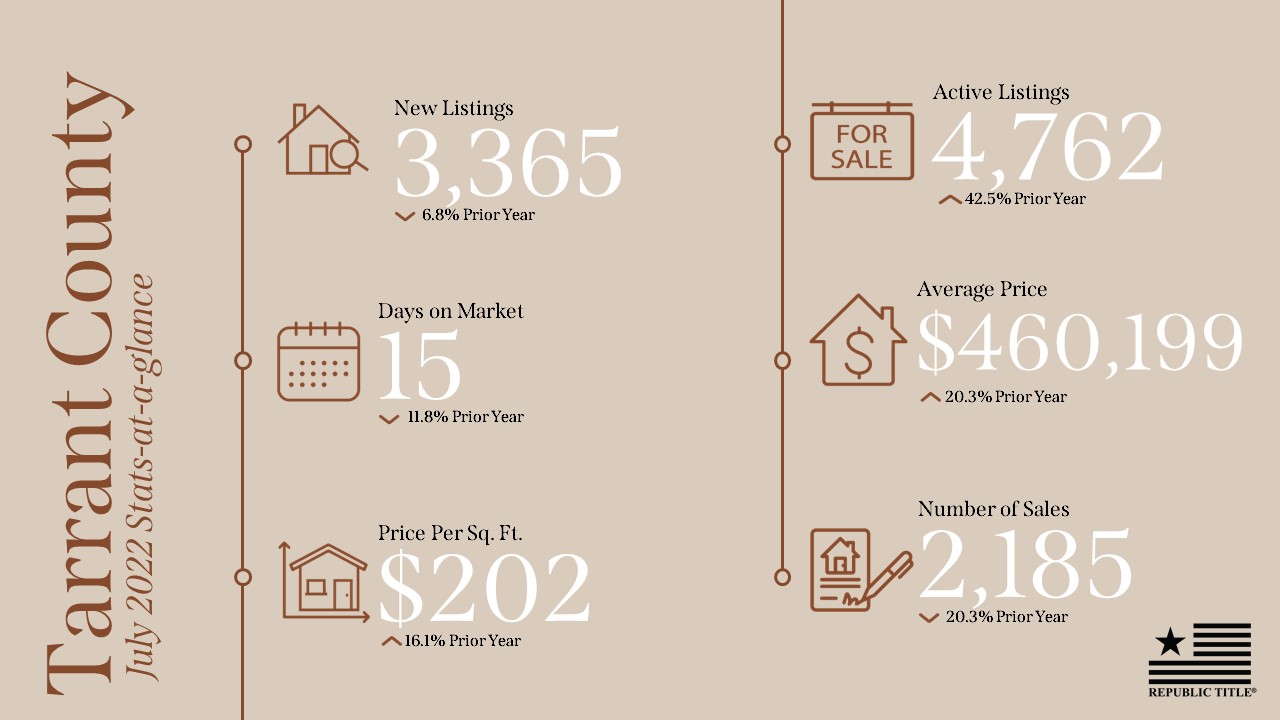
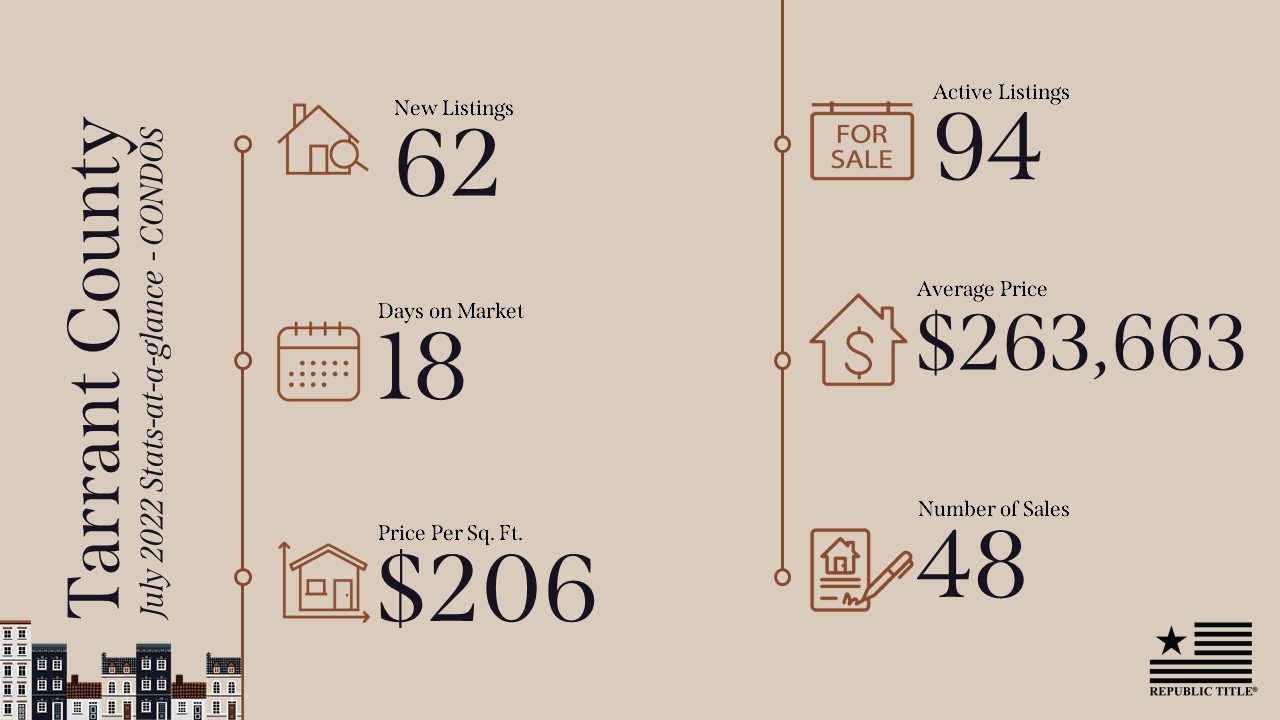
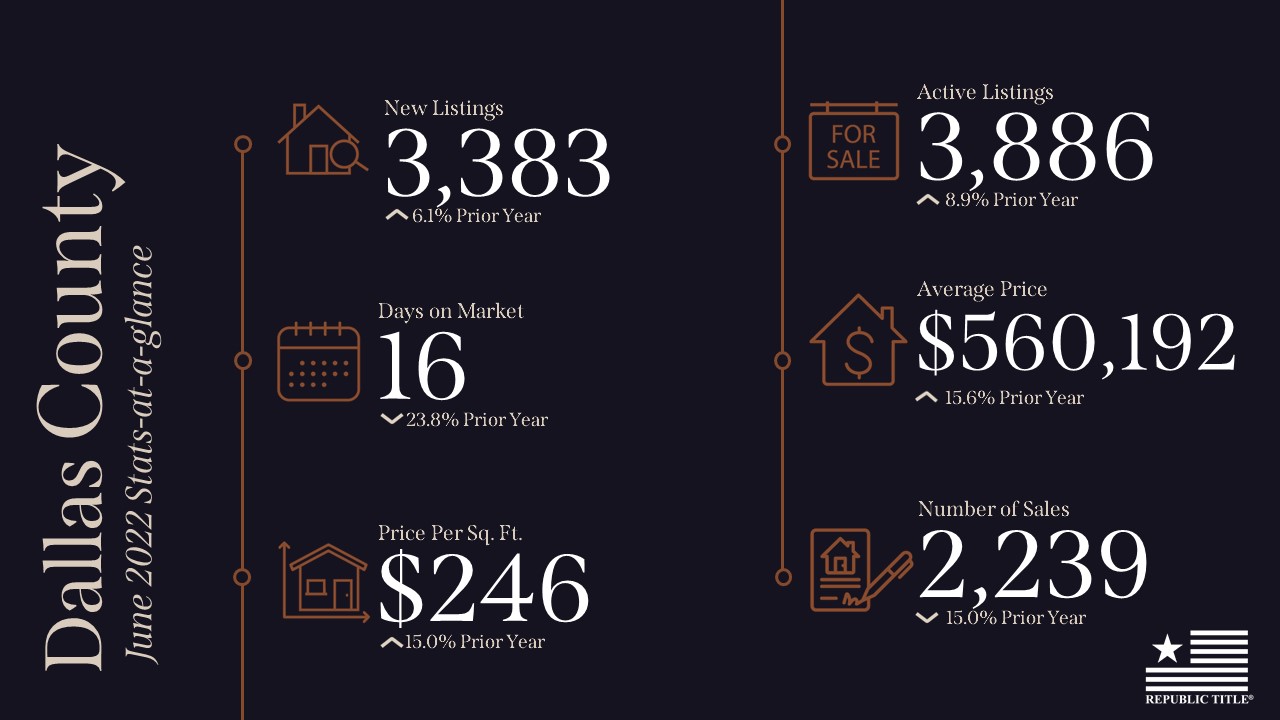
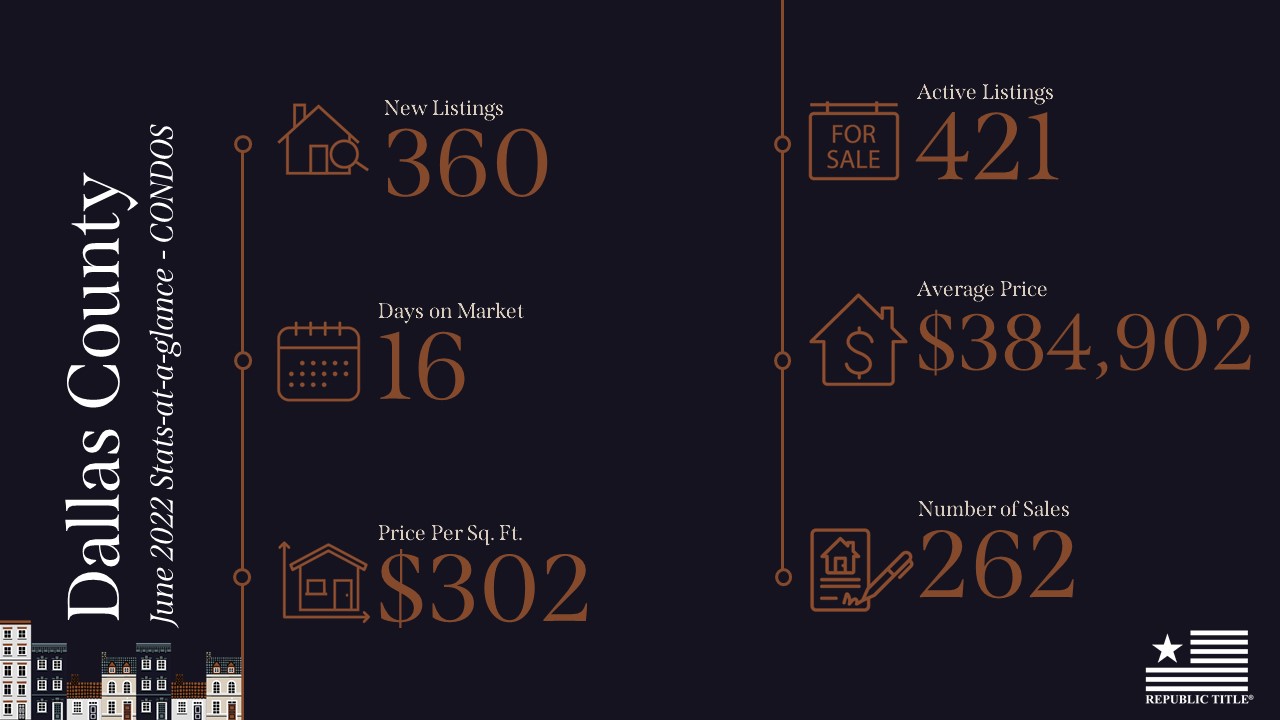
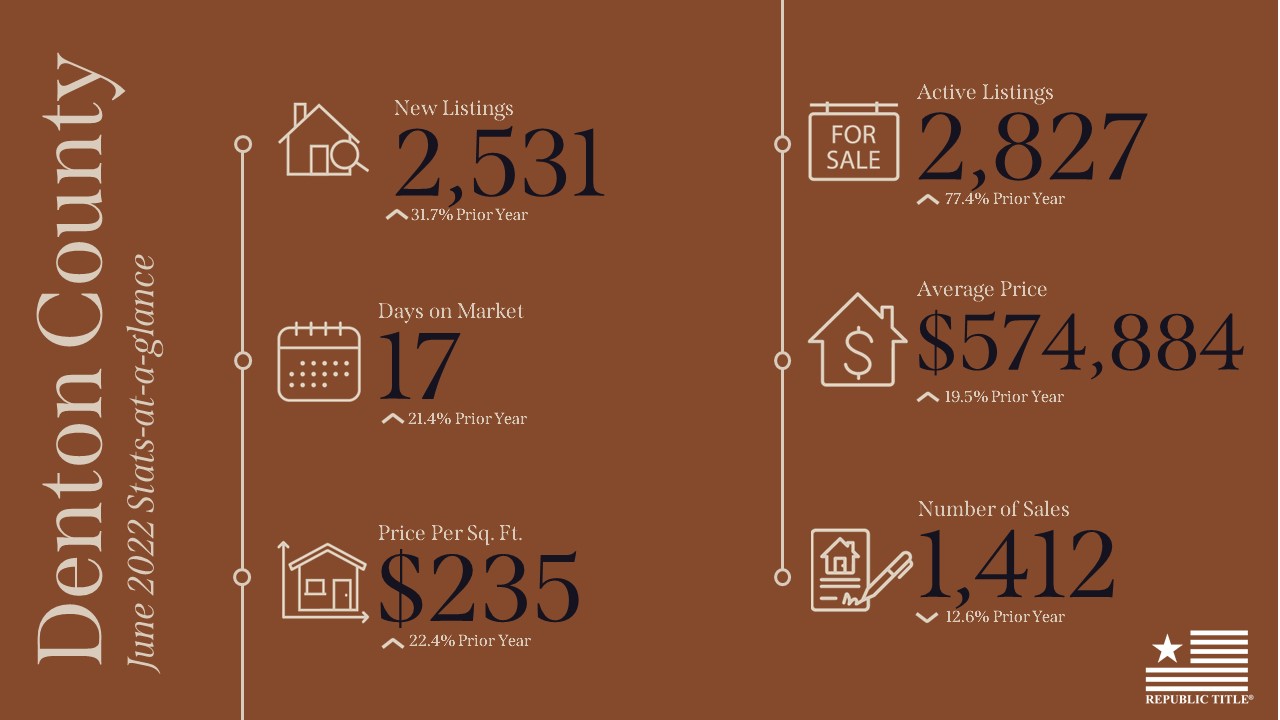
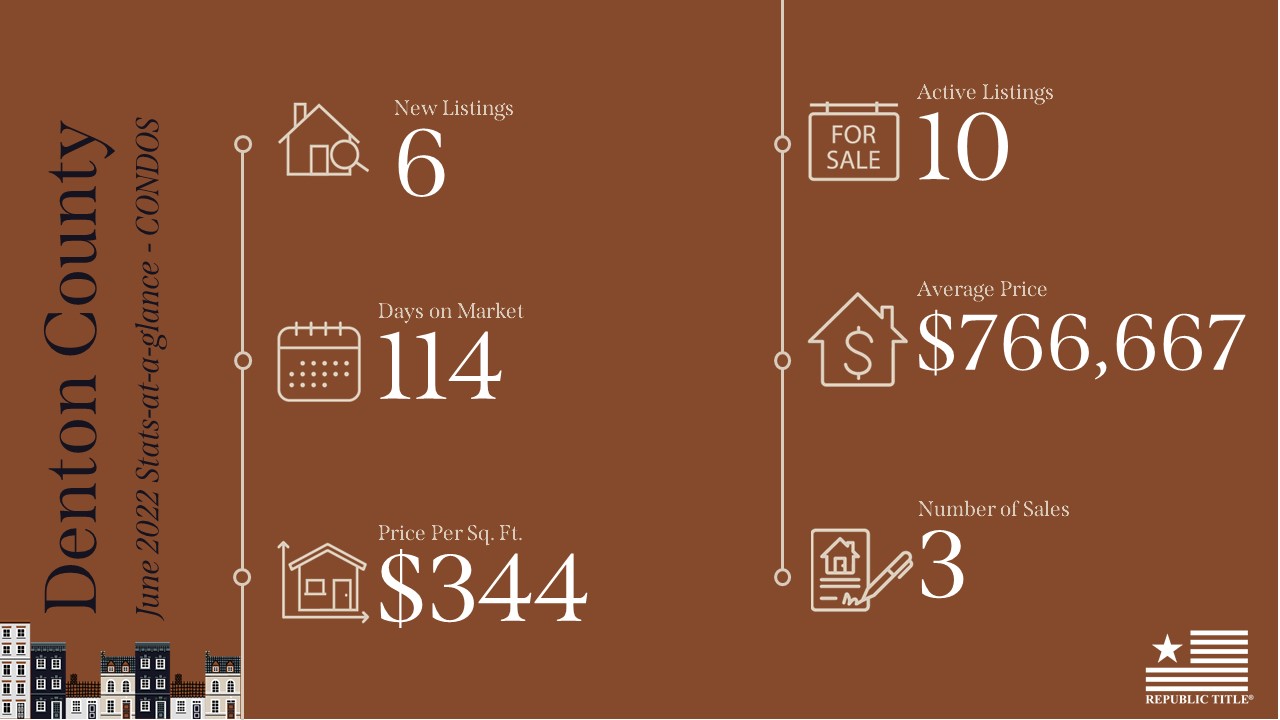
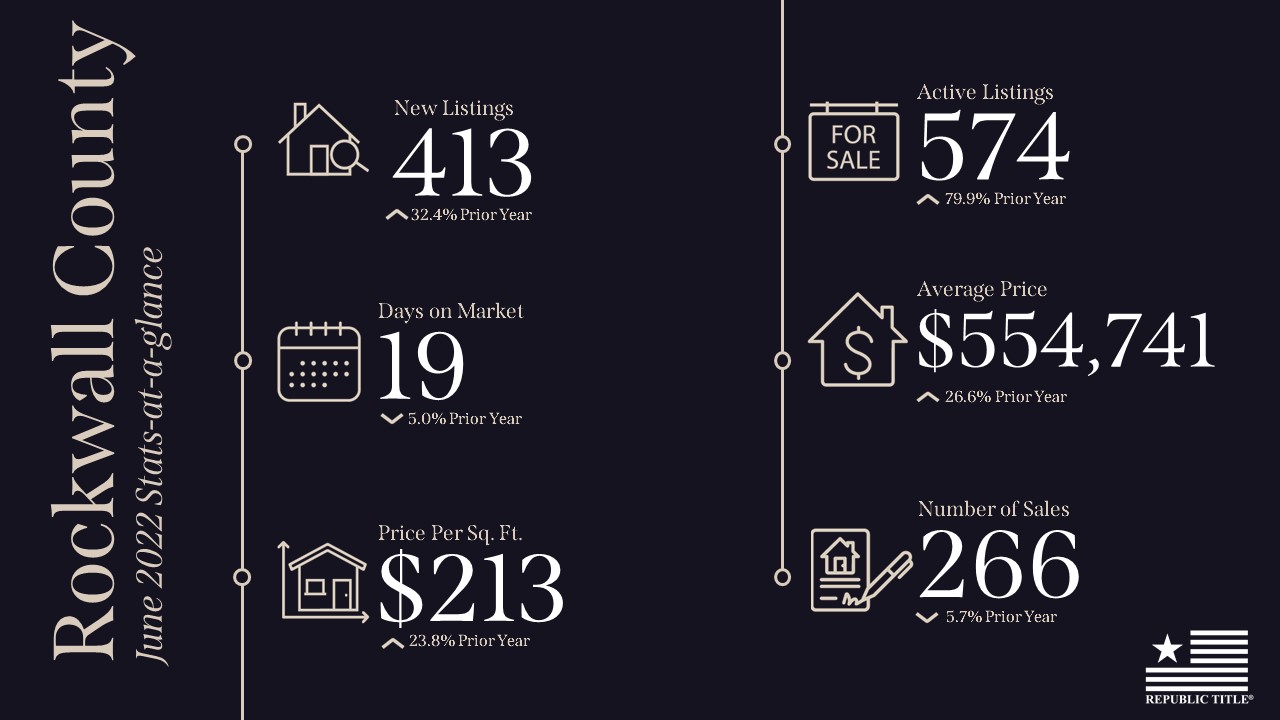
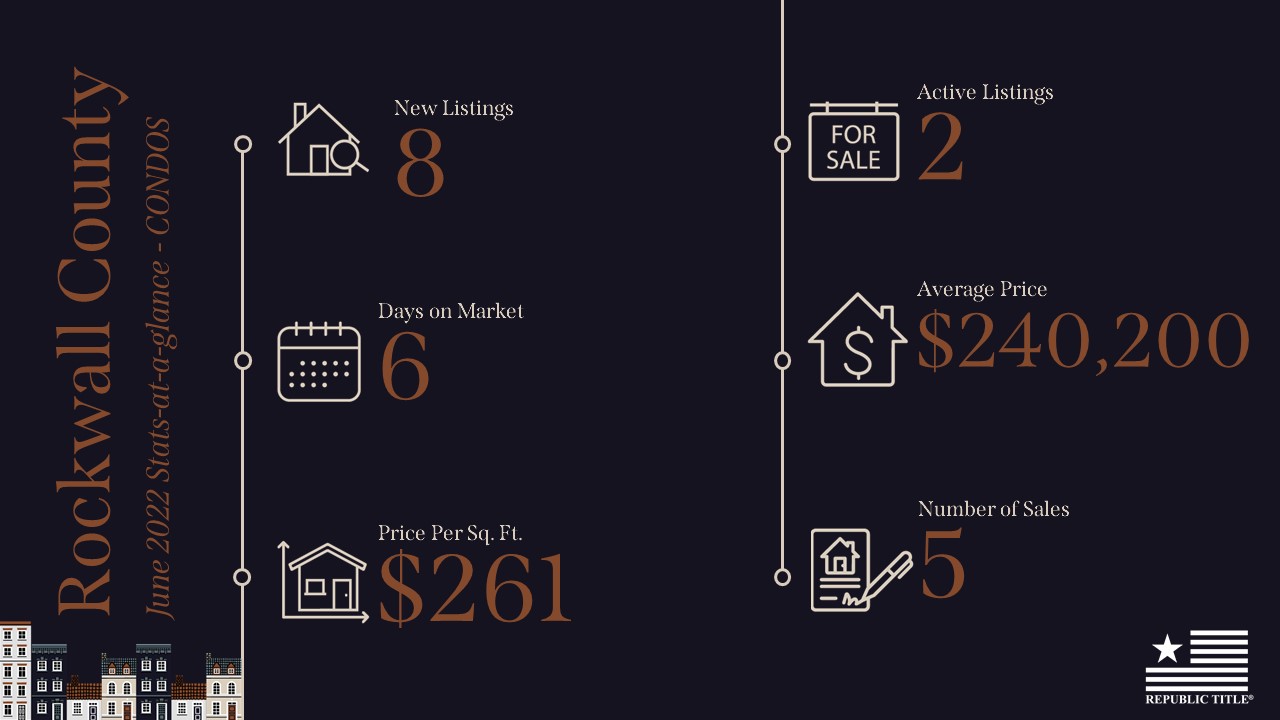
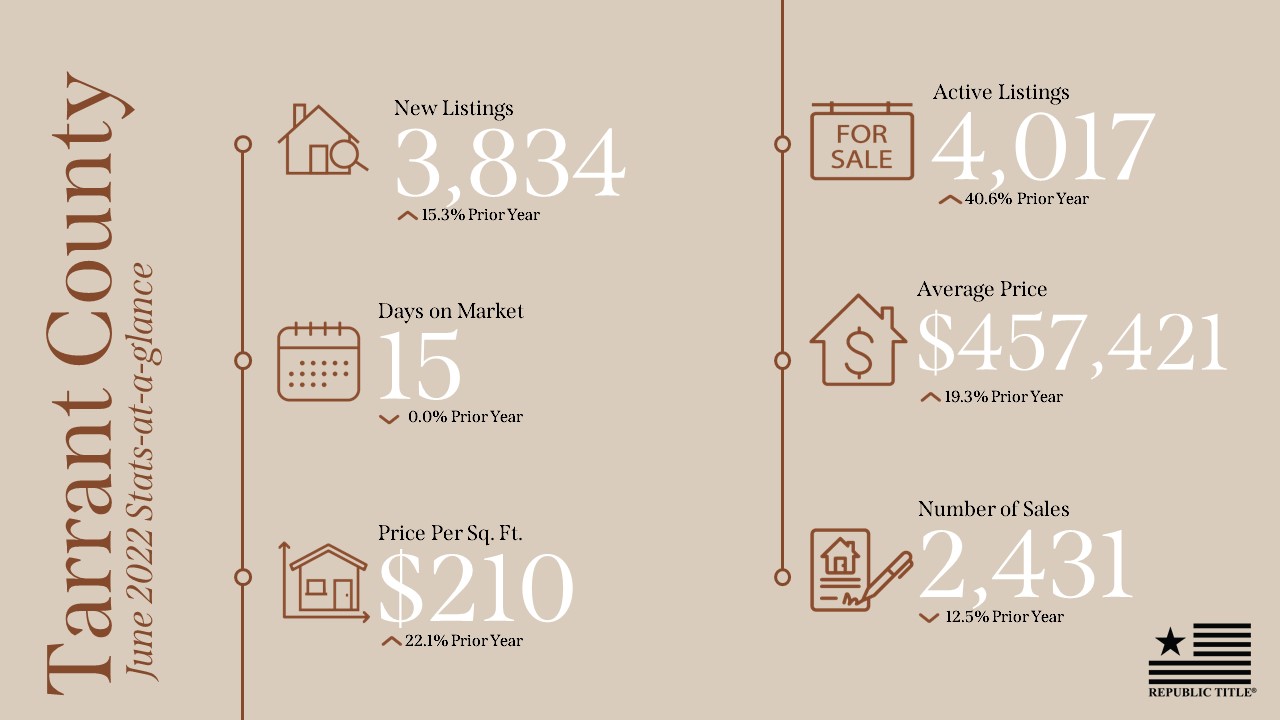
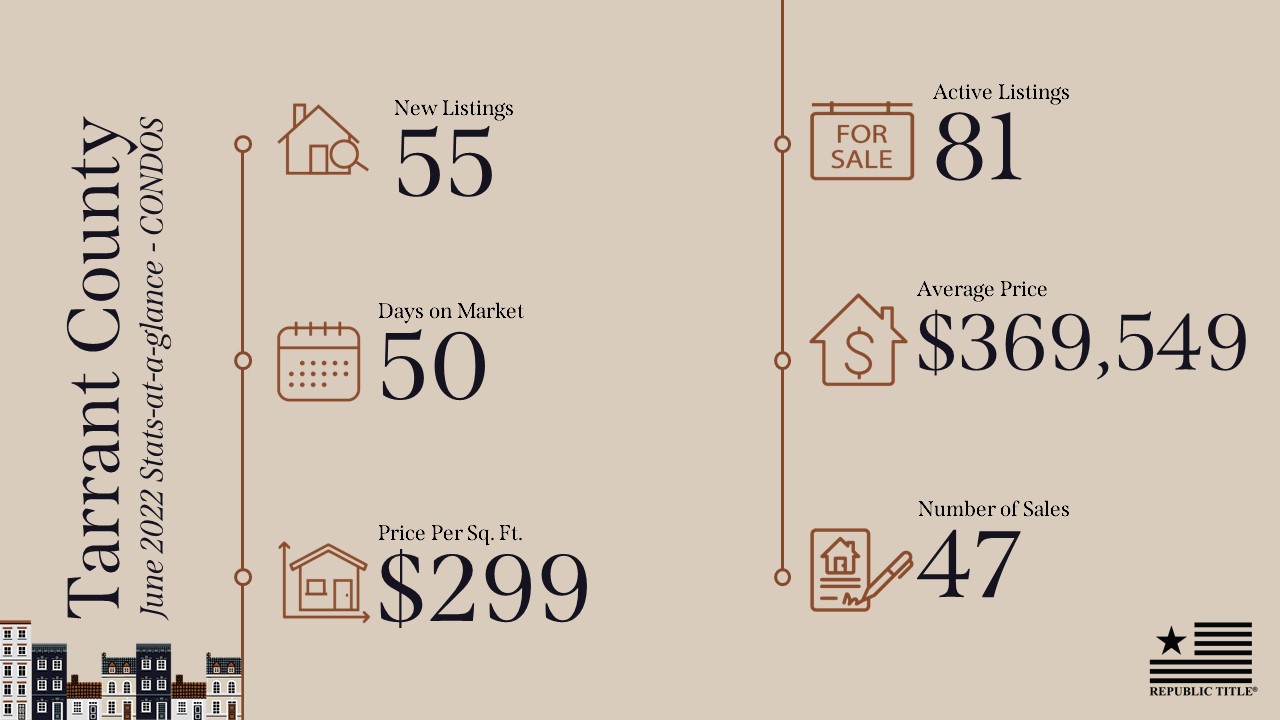
Our stats infographics include a year over year comparison and area highlights for single family homes and condos broken down by MLS area. We encourage you to share these infographics and video with your sphere.

For more stats information, pdfs and graphics of our stats including detailed information by MLS area and condo stats, visit the Resources section on our website at DFW Area Real Estate Statistics | Republic Title of Texas.

For the full report from the Texas A&M Real Estate Research Center, click here. For NTREIS County reports click here.

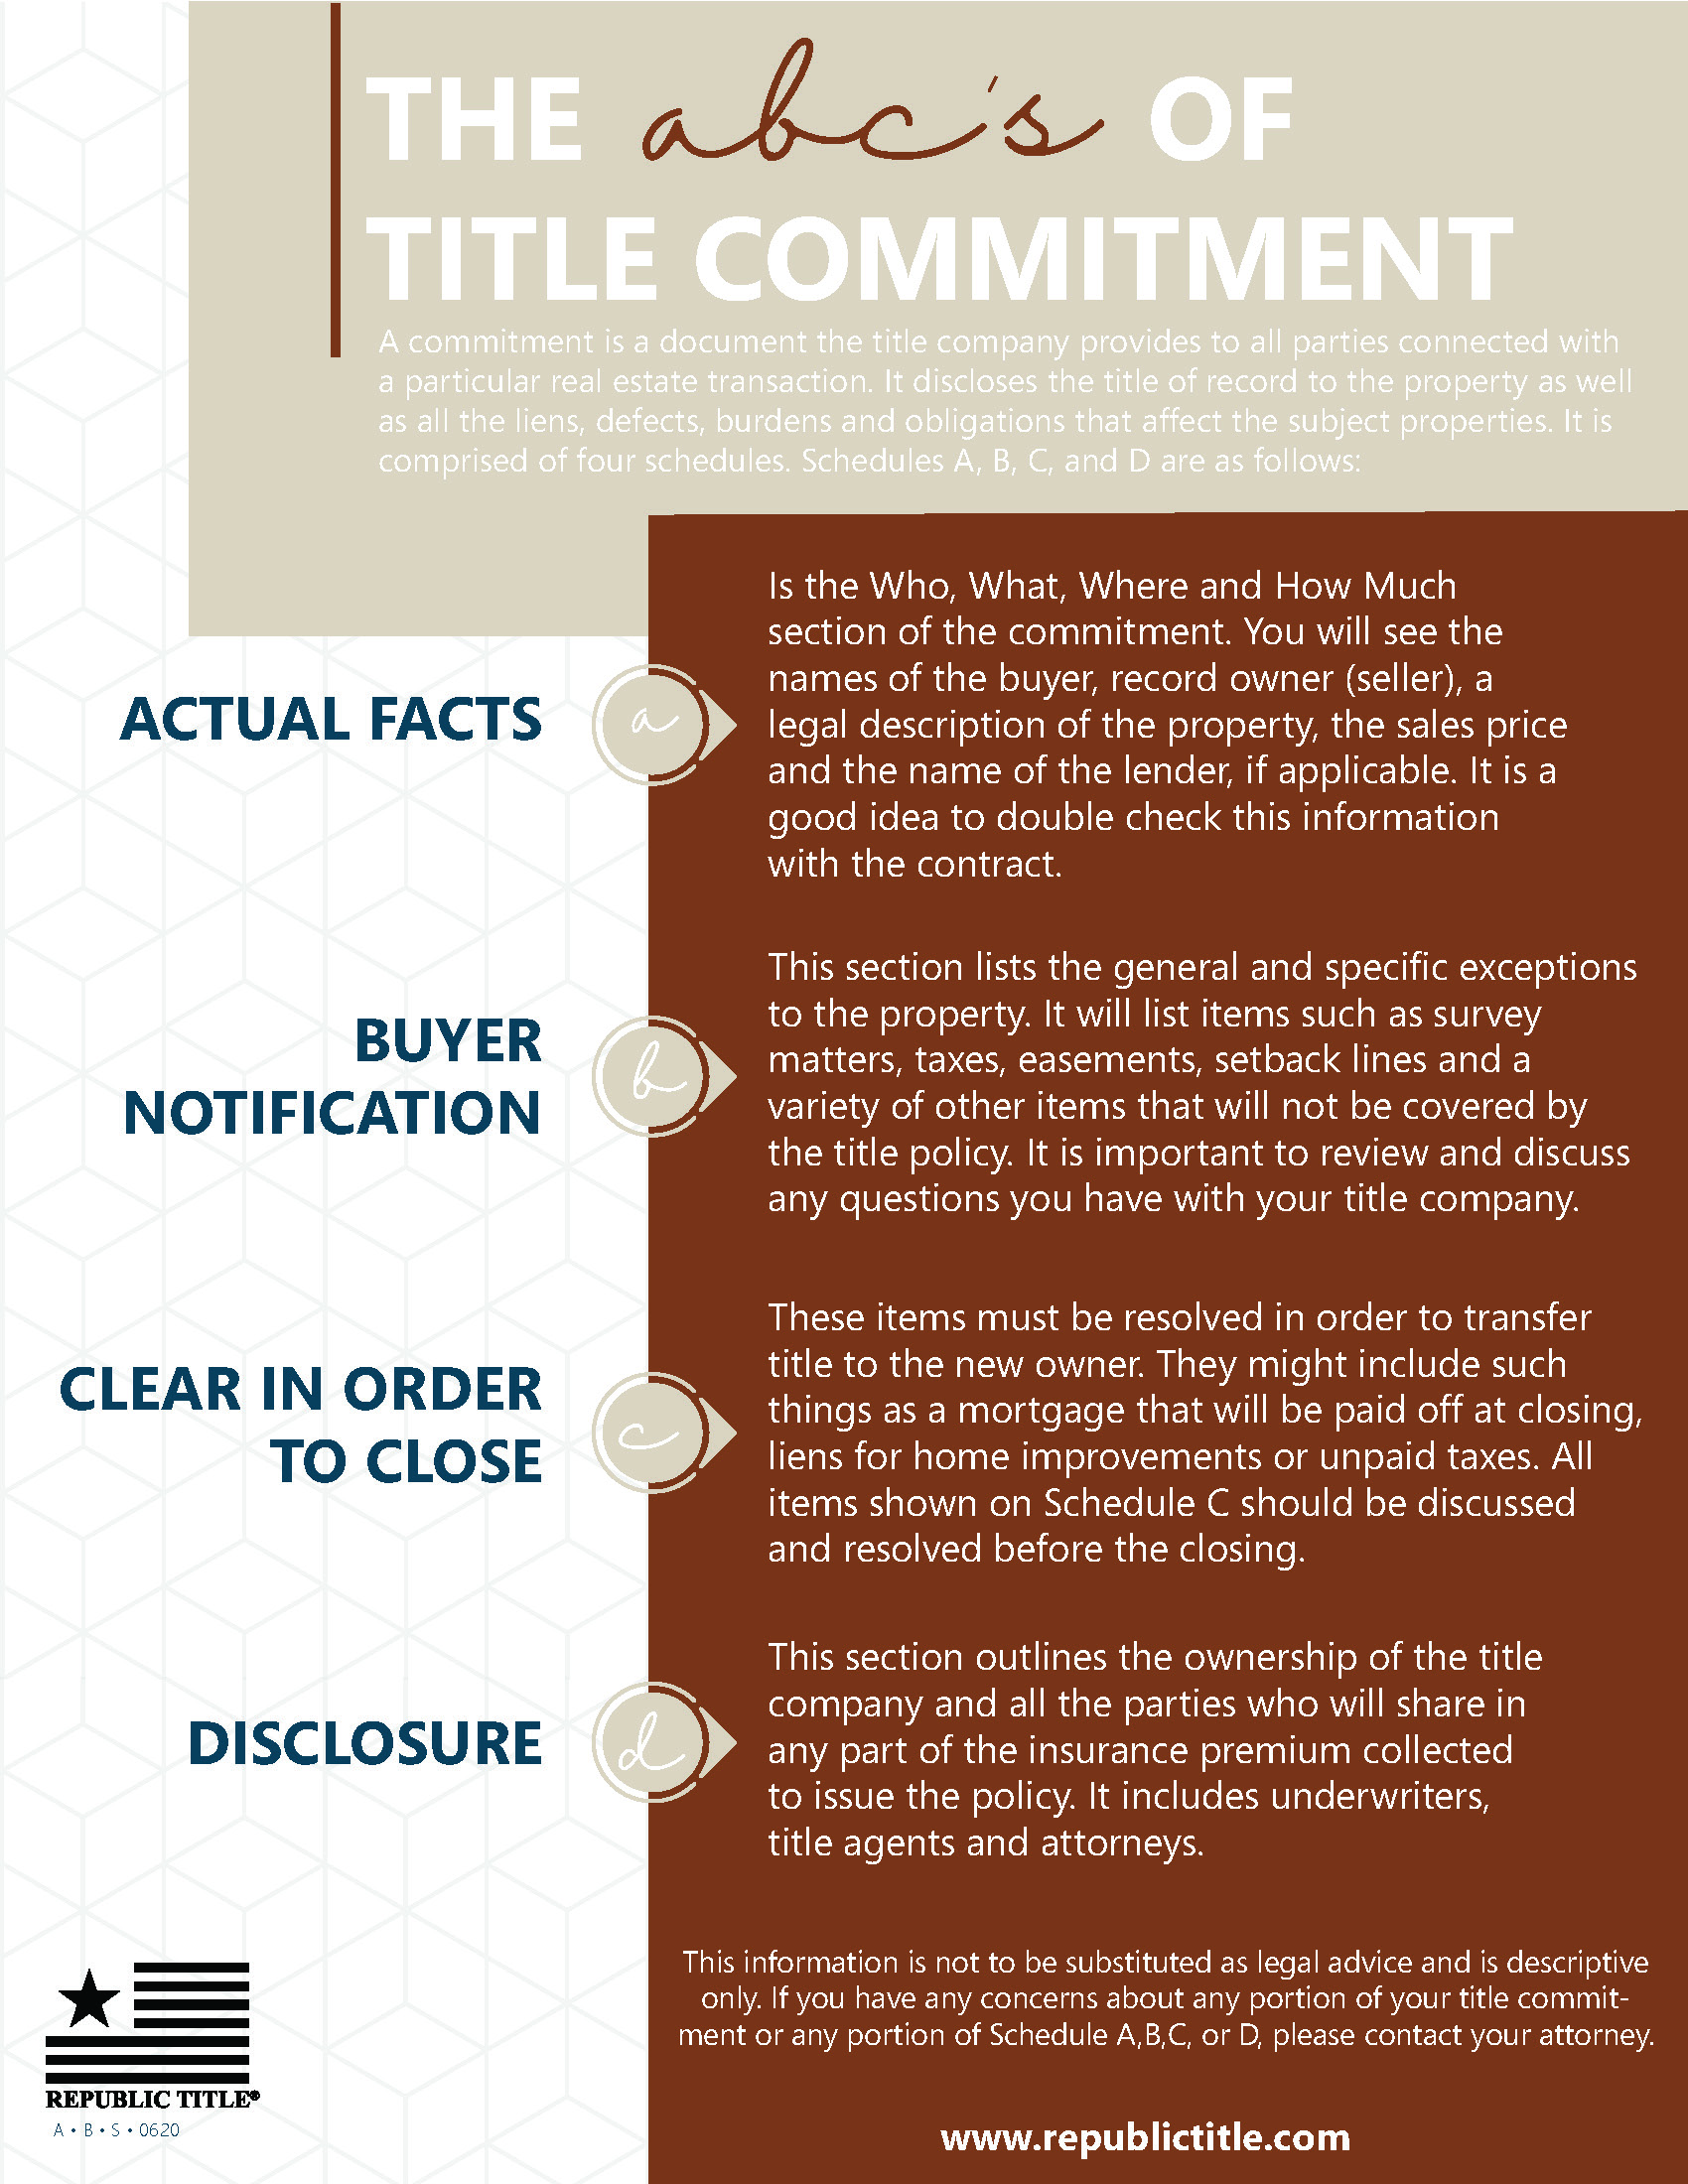
What-to-expect-at-closing

What To Expect At Closing

There are many steps in the home buying process – saving, searching, shopping, inspecting, etc. Once you get through all of these steps, you have finally made it to the closing table and are so close to being in your new home! Here’s a brief description of what to expect at closing:

The Buyer will sign numerous forms including settlement statements, title, and loan documents, if applicable.  Important documents include, but are not limited to, closing disclosures, promissory notes, and deed of trust if financing is applicable and a copy of warranty deed for review to confirm the name of the people taking title. Now after signing, the closing team will then process the documents for funding to finalize the sale. This can take anywhere from an hour for a cash transaction to up to several hours if the title company has documentation to submit to the lender for approval. If the seller has already completed their side of the closing for the sale of the home you are buying, the last step is obtaining the mortgage company’s approval to release the funds. Now once the transaction is funded and all monies are dispersed, the buyer gets the keys which is the best part. The title company then submits the warranty deed to the appropriate government office for recording which conveys title of the home to the new owners.

For more information, reach out to a Republic Title rep or your real estate agent. We look forward to seeing you at the closing table!

March-Gardening-Tips

March Landscape & Gardening Tips & to-Dos

Need help planting a successful garden or landscape? Here are some March planting tips from the Dallas Arboretum horticulture staff and the Dallas County Master Gardeners that can help keep your home garden looking beautiful this winter, whilst having it ready and set up for success in Spring! Plant care should be your focus in March. 

  • Plant cool season annuals for quick color in the garden and to replace any annuals that may not have made it through the cold.
  • Some warm season veggies, such as tomatoes, can be planted late in March, but be prepared to cover them if we have freeze or frost.
  • You may still have some time to dig and divide fall blooming perennials if they haven’t started putting out new growth yet.
  • It’s a great time to plant new trees and shrubs in the garden so they establish a good root system before summer. Make sure to fertilize them so they get a good start.
  • Begin thinking about sodding or seeding your lawn, late in March, once the last frost date has passed. Mow your lawn shorter than normal to help remove early weeds before seeding. Grass is an easy to maintain groundcover that helps retain soil moisture and helps reduce soil erosion. Don’t forget to start fertilizing your lawn as well.
  • Prune and shape any spring flowering shrubs and vines as soon as they finish blooming.
  • Once trees and shrubs begin to green up, trim any dead or damaged areas that become obvious.
  • Continue Fertilizing winter and spring annuals.
Housing-Insight-November-2021

Texas Housing Insight November 2021

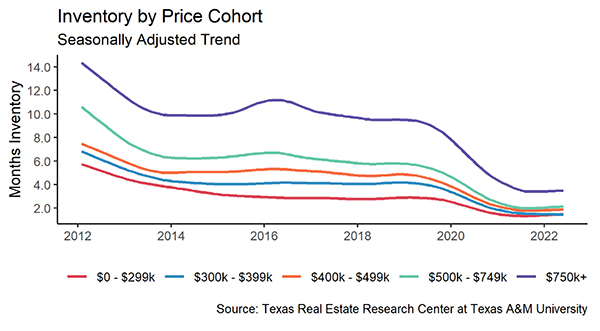
Texas’ housing market continued to rise in November, trending upward despite ongoing supply constraints. Months of inventory slid to 1.5 months, and single-family permits weakened. Housing starts, however, expanded despite lumber and other input price increases. The lack of inventory for homes priced under $300,000 remains the greatest challenge to Texas’ housing market. Demand remained steady despite being stagnated by lack of inventory. Still, the state’s diverse and expanding economy, favorable business policies, and steady population growth support a favorable outlook.

Supply1

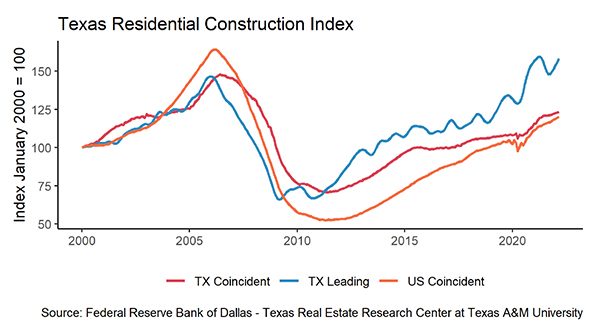
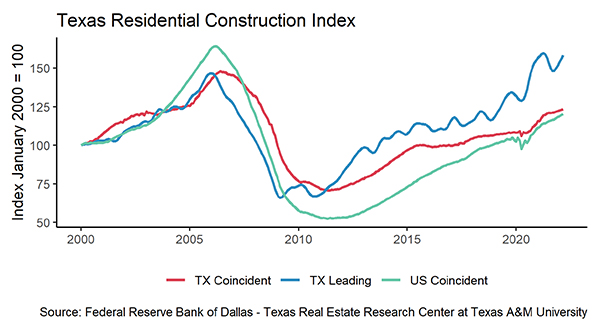
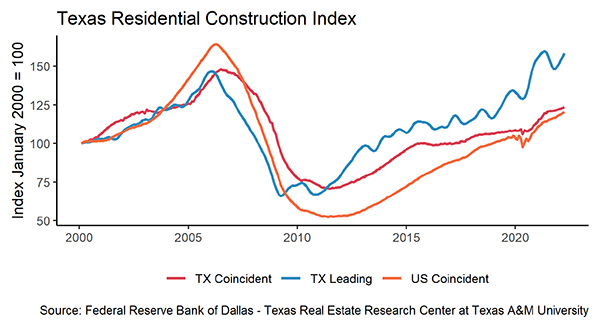
The Texas Residential Construction Cycle (Coincident) Index, which measures current construction activity, decreased nationally and within Texas due to falling employment outweighing heightened construction gains. The Texas Residential Construction Leading Index (RCLI) possibly reached a trough and could increase in the coming months, signaling an increase in future activity. The leading index’s downward trend was reverted by an increase in weighted building permits and residential construction value starts along with the ten-year real Treasury bill’s continued decline. The leading indexes in the major metros continued to decline, indicating slower activity in the coming months. Current inflationary conditions due to supply chain issues are putting downward pressure on construction activity and may impede construction activity in the coming months.

Single-family construction permits fell 2.2 percent month over month (MOM), and the permit issuance had dropped since December 2020. Despite the overall decrease, Houston and DFW remained the top metros nationally, outnumbering Phoenix by 1,000 permits. Houston ranked first for the eighth consecutive month with 3,887 nonseasonally adjusted permits, followed by DFW with 3,523 permits. Austin and San Antonio issued 1,480 and 872 permits, respectively. Texas’ multifamily permits plummeted 12.2 percent on a monthly basis; however, the metric was up 12.3 percent year to date (YTD).

After three months of continuous decline, robust economic conditions and copious demand pushed total Texas housing starts up 6.5 percent as lumber prices increased 12.4 percent. Single-family private construction values also increased in real terms. A 10.6 percent MOM upturn in Houston values contributed to the majority of the statewide growth. This upswing overcame the 13.2 percent and 8.6 percent MOM reduction, respectively, in Austin and San Antonio.

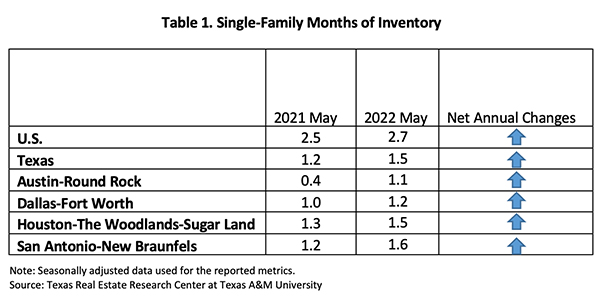
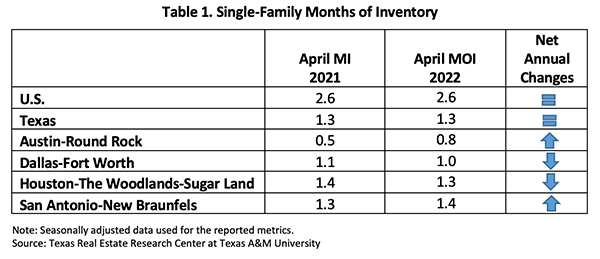
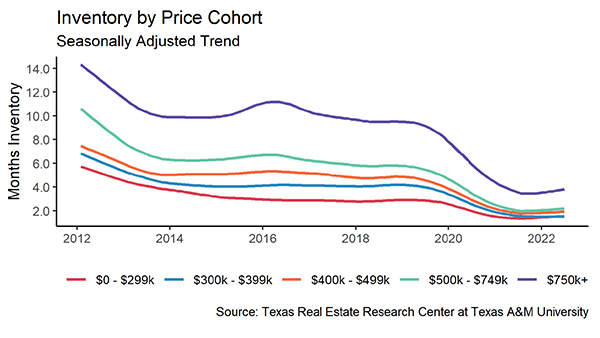
Texas’ months of inventory (MOI) hovered at 1.5 months as active listings and sales activity stabilized. A six-month MOI is typically considered a balanced housing market. Supply was limited across all price categories. Most notably, the inventory for luxury homes (those priced more than $500,000) dropped to 2.3 months, a record low. Total housing inventory in the major metros dropped slightly, with the MOI remaining most constrained in Austin at 0.8 months. The metric in North Texas fell to one and 1.1 months in Dallas and Fort Worth, respectively. Houston’s MOI decreased to 1.6 months, while San Antonio’s declined to 1.7 months. Dwindling inventory persisted as a major headwind to the health of Texas’ housing market.

Demand

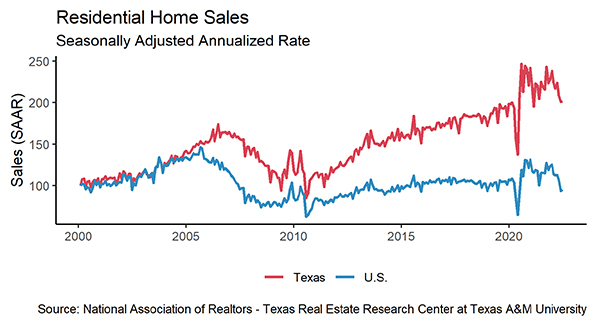
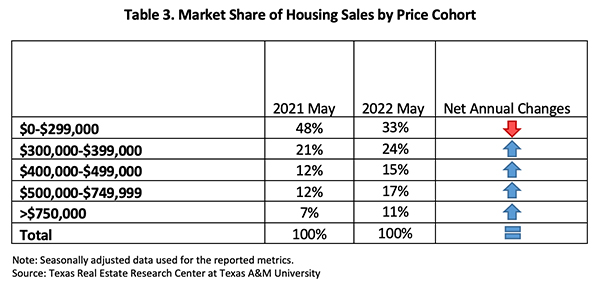
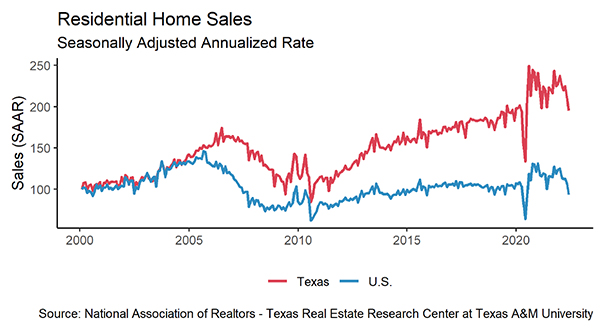
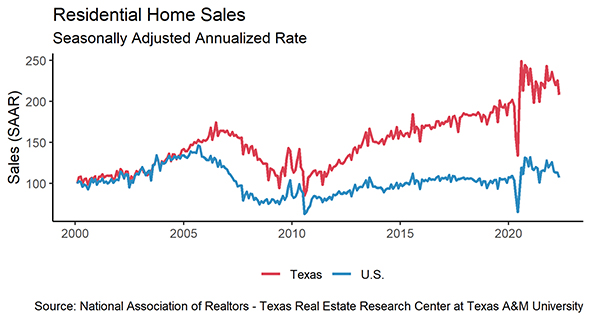
Despite the deflated inventory, demand increased across all price cohorts. Total housing sales rose 2.6 percent MOM. Transactions at the lower end of the price spectrum decreased significantly compared with year-ago levels, while the opposite occurred at the higher end. Housing sales for homes priced under $299,000 cut back 23.1 percent YTD, while housing sales for homes priced at more than $300,000 rose 37.8 percent YTD.

Housing sales increased across the price spectrum at the metropolitan level, except in San Antonio where total sales contracted 3.3 percent. Meanwhile, Houston mirrored statewide fluctuations as sales jumped 2.6 percent. In Austin, the metric rose 1.1 percent, while North Texas activity increased 0.5 and 8.1 percent in Dallas and Fort Worth, respectively.

Texas’ average days on market (DOM) fell marginally to 31 days amid robust demand and limited inventory. Austin remained the most popular housing market with its DOM slipping another day, averaging 20 days. The metrics in North Texas averaged 25 days. San Antonio’s and Houston’s metrics registered two-day gains, with both metros averaging 34 days.

Market expectations are for the Federal Reserve to accelerate the tapering of asset purchases and increasing the Federal Funds rate two to four times in 2022. The ten-year U.S. Treasury bond yield returned to pre-pandemic levels of 1.6 percent2, while the Federal Home Loan Mortgage Corporation’s 30-year fixed-rate hovered around 3.1 percent for the second consecutive month. The median mortgage rate for the typical Texas homebuyer climbed to 3.2 percent for GSE loans in October3 and fell ten basis points to 2.9 percent for non-GSE loans. Among the mixed mortgage interest rate changes, home-purchase applications strengthened for November but overall fell 4 percent YTD. Meanwhile, refinance applications have declined on a monthly basis and were down 29.9 percent since December 2020. Year-over-year (YOY) purchase and refinance applications diminished 3.5 and 31.7 percent, respectively, largely due to baseline effects after a surge of remodeling and refinancing in 2020. (For more information, see Finding a Representative Interest Rate for the Typical Texas Mortgagee.)

In October, the median loan-to-value ratio (LTV) constituting the “typical” Texas conventional-loan mortgage dropped from 87.4 the previous year to 84.2. The debt-to-income ratio (DTI) declined from 36.4 to 35.5, while the median credit score increased six points to 751 over the same period. The LTV for GSE borrowers increased slightly from 85.2 in October to 85.7; meanwhile, their DTI grew from 35.5 to 36.7.

Prices

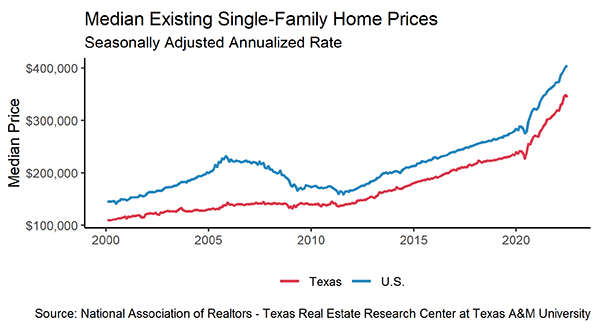
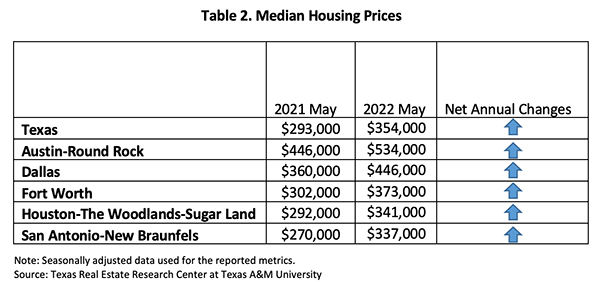
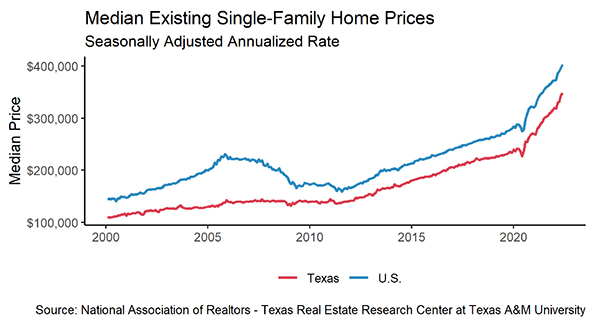
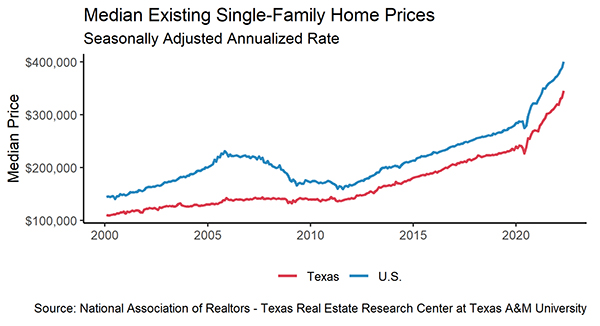
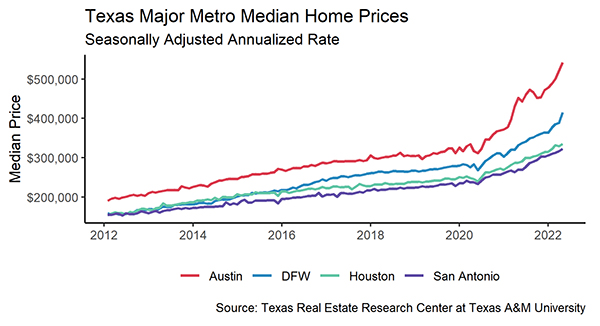
The ongoing shift in the composition of sales toward higher-priced homes due to constrained inventories at the lower end of the market boosted the average and median home price. The Texas median home price rose for the 11th consecutive month, appreciating 1.7 percent on a monthly basis and 17.2 percent YOY to a record-breaking $319,112. The five major metros all hit historically high median prices. The share of luxury homes sold in Austin continued to expand, contributing to the 29.6 percent YOY surge in the median price ($475,700). The Dallas metric ($386,500) increased 18.1 percent, while annual price growth in Fort Worth ($331,800) shot up to 20.6 percent. Houston’s ($315,200) and San Antonio’s ($308,600) metrics were hikes of 16.2 and 19.7 percent, respectively.

The Texas Repeat Sales Home Price Index accounts for compositional price effects and provides a better measure of changes in single-family home values. Compared with November 2020’s 7.8 percent YOY increase, Texas’ index corroborated significant home-price appreciation, accelerating 18.6 percent YOY in 2021. The growth rate surpassed the surge in the median home price. The repeat sales index accelerated in the major metros, except in Austin and Houston. Annual price growth reached recent peaks in Dallas. The metric dipped to 35.1 percent in Austin after a year of explosive growth, while North Texas prices increased 24.1 and 22 percent in Dallas and Fort Worth, respectively. San Antonio posted an 18.4 percent annual hike, while Houston’s index decelerated to 14.6 percent. Increasing home prices pressured housing affordability, decreasing Texas’ affordability advantage over other states like California.

Single-Family Forecast

The Texas Real Estate Research Center projected single-family housing sales using monthly pending listings from the preceding period (Table 1). Texas sales are expected to fall 3.8 percent in December after increasing during the past month. The metric is estimated to slow to 1.9 percent in Austin, with additional losses of 6.5 percent and 5.8 percent in DFW and Houston, respectively. Transactions in San Antonio, however, are forecasted to rebound 0.4 percent. Sales through December 2021 should accelerate relative to the same period in 2020. On the supply side, listings seemed to have reached a trough in May and are rising, easing some of the price pressures amid a rise in new and pending listings.


Household Pulse Survey

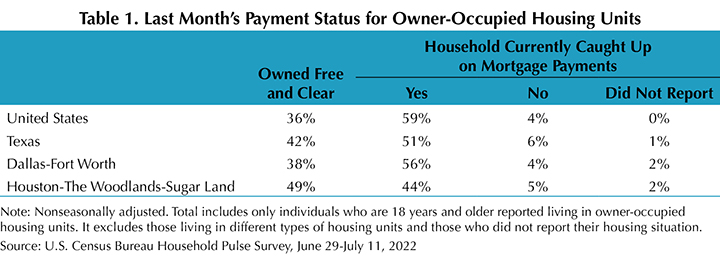
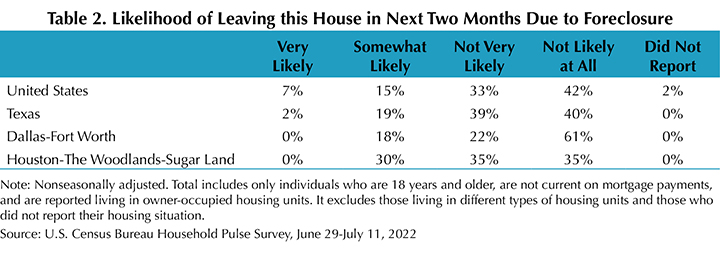
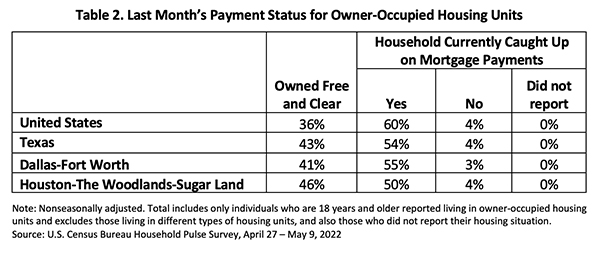
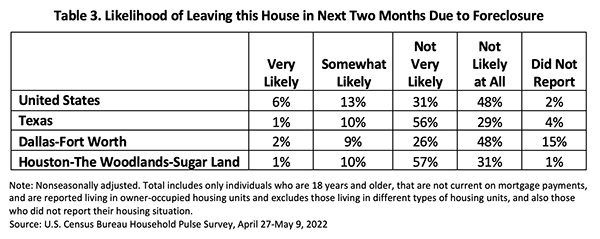
According to the U.S. Census Bureau’s Household Pulse Survey, the share of homeowners behind on their mortgage payments varied little on the national level, while the share decreased 1 percent in Texas (Table 2). On the other hand, more homeowners who struggled to keep up with mortgage payments faced the possibility of foreclosure. The share of Texas respondents who were not current and expected foreclosure to be “somewhat likely” in the next two months jumped 15 percent, while the share reporting “not very likely” plummeted 22 percent from October to November (Table 3). The proportion of delinquent individuals at risk of foreclosure rose in Houston from 18 to 34 percent. The Federal Housing Finance Agency’s foreclosure and REO eviction moratoria for properties owned by Fannie Mae and Freddie Mac (the Enterprises) expired Sept. 30, 2021. Continued stability in the housing market is essential to Texas’ economic recovery.

________________

1 All measurements are calculated using seasonally adjusted data, and percentage changes are calculated month over month, unless stated otherwise.
2 Bond and mortgage interest rates are nonseasonally adjusted. Loan-to-value ratios, debt-to-income ratios, and the credit score component are also nonseasonally adjusted.

3 The release of Texas mortgage rate data typically lag the Texas Housing Insight by one month.

Source – Luis B. Torres, Wesley Miller, Jacob Straus, and Brendan Harrison Feb 22, 2022)

https://www.recenter.tamu.edu/articles/technical-report/Texas-Housing-Insight

Blog Graphic

January 2022 DFW Area Real Estate Stats

January stats are here and we have the numbers! 

Our stats infographics include a year over year comparison and area highlights for single family homes and condos broken down by MLS area. We encourage you to share these infographics and video with your sphere.

For more stats information, pdfs and graphics of our stats including detailed information by MLS area and condo stats, visit the Resources section on our website at DFW Area Real Estate Statistics | Republic Title of Texas
For the full report from the Texas A&M Real Estate Research Center, click here. For NTREIS County reports click here.

RTT-SL-welcomes-Sam

Samantha Lipton Named Southlake Branch Manager

Republic Title is pleased to announce the promotion of Samantha Lipton to Branch Manager of our Southlake office.

“We are excited to announce that Samantha Lipton will be joining the Southlake office as Senior Vice President/Branch Manager. Samantha joins our Southlake office from our MacArthur office where she has consistently demonstrated the expertise and dedication necessary to provide skilled customer service to our clients”, said Sheri Groom, Executive Vice President/Residential Operations.

An experienced Escrow Officer with 30 years’ experience in the title industry, Samantha is active in the Texas Land Title Association (TLTA) and stays active in her community with involvement in the Women’s Council of REALTORS, Civilian Conservation Corps, Coppell Chamber of Commerce, and Leadership Coppell. In her free time, she enjoys traveling, boating, camping, and fishing.

February

February Landscape & Gardening Tips & To-Dos

Need help planting a successful garden or landscape? Here are some February planting tips from the Dallas Arboretum horticulture staff and the Dallas County Master Gardeners that can help keep your home garden looking beautiful this winter, whilst having it ready and set up for success in Spring! Plant care should be your focus in February. 

  • Plant winter annuals such as pansies, dianthus, snapdragons and chard on warmer days.
  • Sow seeds for spring annuals and veggies, inside, per instructions based on the last frost date for your area. Remember they need full sun and temperatures around 65 to 70 degrees (watch out for cold window sills!).
  • Divide and replant summer and fall blooming perennials while they are still dormant.
  • Plant or relocate native and cold hardy trees and shrubs while they are dormant. It is also the perfect time to perform any tree trimming.
  • Start pruning roses. A good rule of thumb is to prune them by Valentine’s Day. Climbing roses won’t need any trimming until after they bloom in spring.
  • Mulch flower beds before the weather warms up and weeds begin to sprout.
  • Fertilize winter annuals throughout the winter and continue into spring. Use a complete, water soluble fertilizer to help them get established while it’s still cold.
Class-Calendar-Blog-Header

February Class Calendar

Republic Title is pleased to offer a variety of continuing education classes for our customers. Join us in February for classes including:

Create Gorgeous Visual Content Using FREE Tools!
Join Annette Carvalho-Jordan, VP/Real Estate Technology Trainer as she gets you started creating beautiful designs for your real estate business and your social media profiles using Canva.com and more!
February 2nd
10:00 am – 11:00 am
Zoom

TREC Legal Update II
*** PLEASE NOTE: This class has been changed to a zoom meeting due to impending inclement weather ***

Material mandated by TREC – Ethics/Fair Housing/Anti-Discrimination/Hot Topics/Court Cases.
February 3rd
9:00 am – 1:00 pm
Zoom

The Real Deal – Your Best Year Ever: Bring It All Together – Resources & Marketing Tools
In this class, you’ll discover the tools and resources that will make you a valuable resource to your clients. Learn about some of the best marketing resources available to real estate agents for marketing your personal brand and your business.
February 8th
10:00 am – 11:00 am
Zoom

Survey Issues
Join us for this class intended to help licensees understand surveys and the applicable paragraphs in the TREC 1-4 Family Residential Contract and prepare them for any potential survey issues that may arise.
February 9th
10:00 am – 11:00 am
Zoom

Boost Your  Business Using Remine
Join us for an overview of Remine; a powerful map-based search tool accessible through the NTREIS portal. This class will demonstrate Remine’s intuitive platform that reimagines the MLS and helps to solve and analyze some of the biggest challenges real estate agents face today.
February 17th
10:00 am – 11:00 am
Zoom

Mapping Tools in Matrix
One of the strongest tools available to NTREIS MLS Subscribers is the mapping tool in Matrix, but are you using it to its fullest ability? In this class, Annette Carvalho-Jordan, VP/Real Estate Technology Training, will explore all the map tool functions in Matrix so you can create powerful searches for your clients who want to live in specific neighborhoods, near points of interest or certain distances to where they work.
February 22nd
10:00 am – 11:00 am
Zoom

Top Ten Contract Addenda
Join us to review 10 of the most commonly utilized TREC contract addenda including Third Party Financing Addendum, Addendum for Backup Contract and more.
February 24th
10:00 am – 11:00 am
Zoom

To see a current list of available classes and to register, please visit www.republictitle.com/residential-education.

2021 DFW Real Estate Stats-at-a-glance

2021 DFW Real Estate Year-End Stats at a Glance

We’ve taken our monthly stats-at-a-glance reports from January through December of 2021, totaled, averaged, and compared the data to the numbers from 2020. The result is an annual report of the DFW area real estate market in 2021. The annual totals reiterate the lack of inventory we saw in 2021, indicating a very strong seller’s market. This drove up lists prices by an average of 20% across the five counties reported on, for an average list price of just over $442k. While list prices steadily rose as the year progressed, so did average price per square foot, averaging $187 in the five counties. It sure will be interesting to see how 2022 plays out!

For more stats information, pdfs and graphics of our stats including detailed information by MLS area and condo stats, visit the Resources section on our website at DFW Area Real Estate Statistics | Republic Title of Texas.

December 2021 Stats Blog Header

December 2021 DFW Area Real Estate Stats

December 2021 stats are here and we have the numbers! Let’s see how the DFW real estate market ending 2021. Active listing fell slightly from November, but that is to be expected over the holiday season. As expected due to the lack of inventory, the overall number of sales is down in all counties while the days on market continues to drop. Not surprisingly, the price per square foot in the metroplex continues to rise in all five counties with Collin County seeing the biggest increase up 33% over last year, followed by Denton county at 26%.

Our stats infographics include a year over year comparison and area highlights for single family homes and condos broken down by MLS area. We encourage you to share these infographics and video with your sphere.

For more stats information, pdfs and graphics of our stats including detailed information by MLS area and condo stats, visit the Resources section on our website at DFW Area Real Estate Statistics | Republic Title of Texas

For the full report from the Texas A&M Real Estate Research Center, click here. For NTREIS County reports click here.