3 Things thumbnail-04

3 Things You Need To Know About Contingent Contracts

Next up in our Three Things video series are Republic Title’s Janet Allen and Sarah Mann discussing the three things you need to know about contracts contingent on the sale of a buyer’s current home.
 
In this informative conversation they discuss when the buyer must receive the proceeds of their sale, what happens when a seller accepts a back-up offer, and some situations that may cause a buyer default. With the market heating up, this information is vital for agents and their clients.
 
For more information and resources, visit republictitle.com
Slide1

April 2023 DFW Area Real Estate Stats

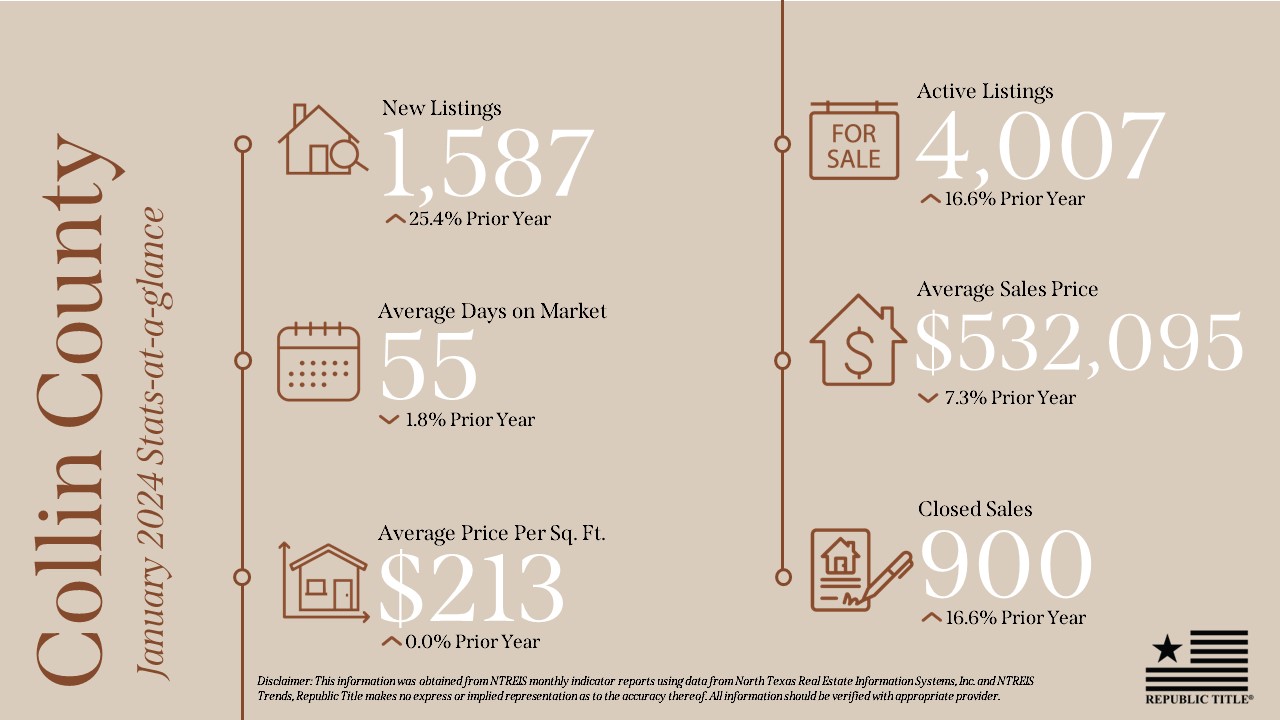
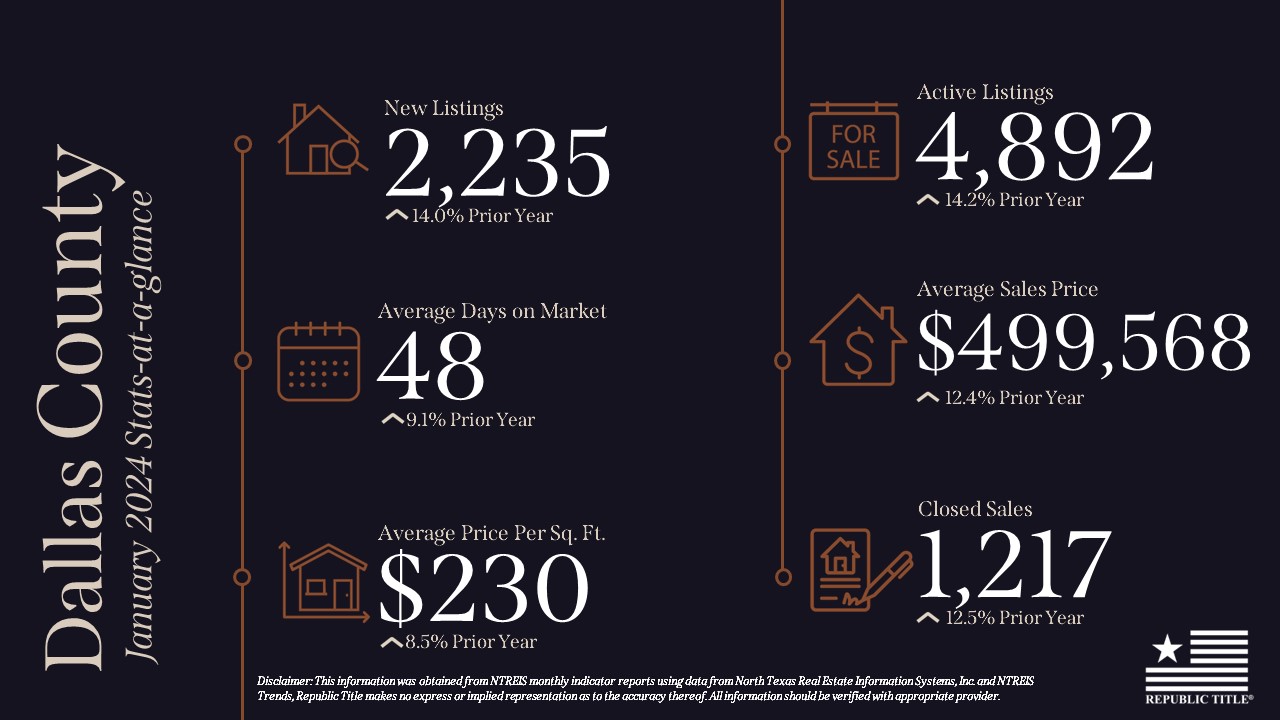
In April, active listings have increased across all counties compared to last year. However, the demand is outpacing supply, and we need more inventory to meet the growing needs of homebuyers. Excitingly, the average price is slightly down from last year across our area, offering potential savings for home seekers. Moreover, days on market have decreased since last month, signaling a strengthening market and a sense of urgency for those looking to buy or sell.

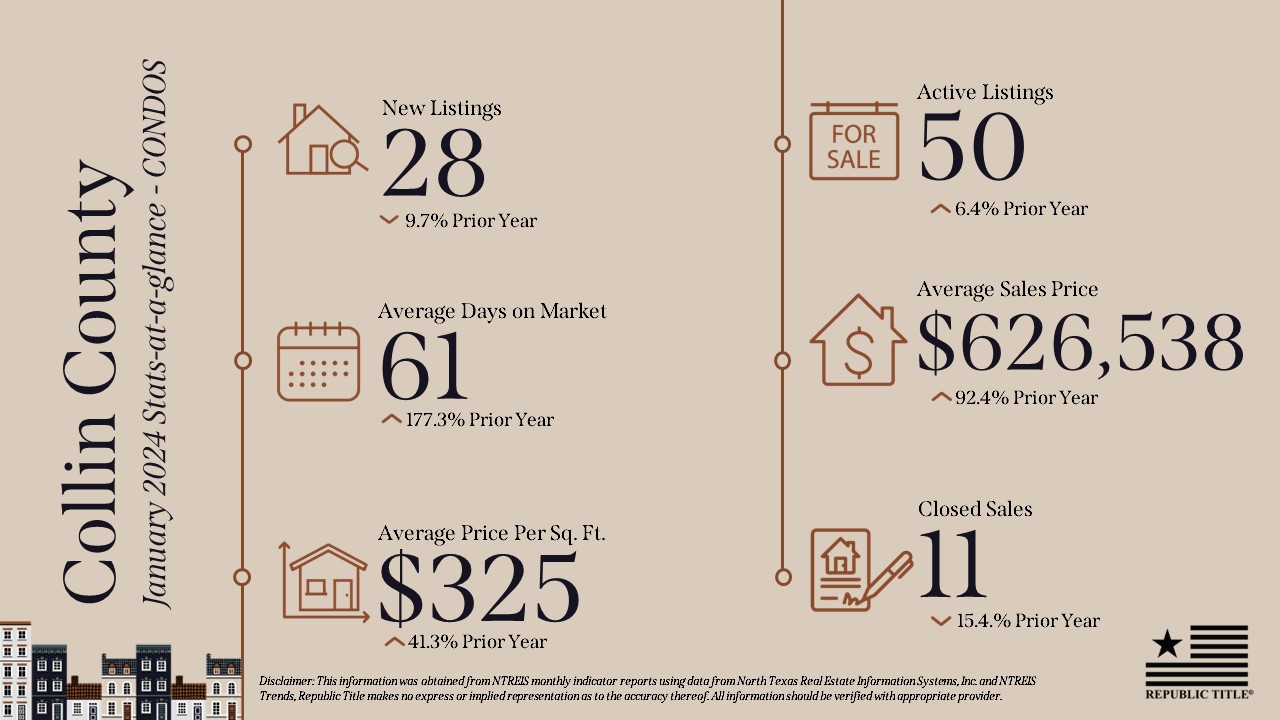
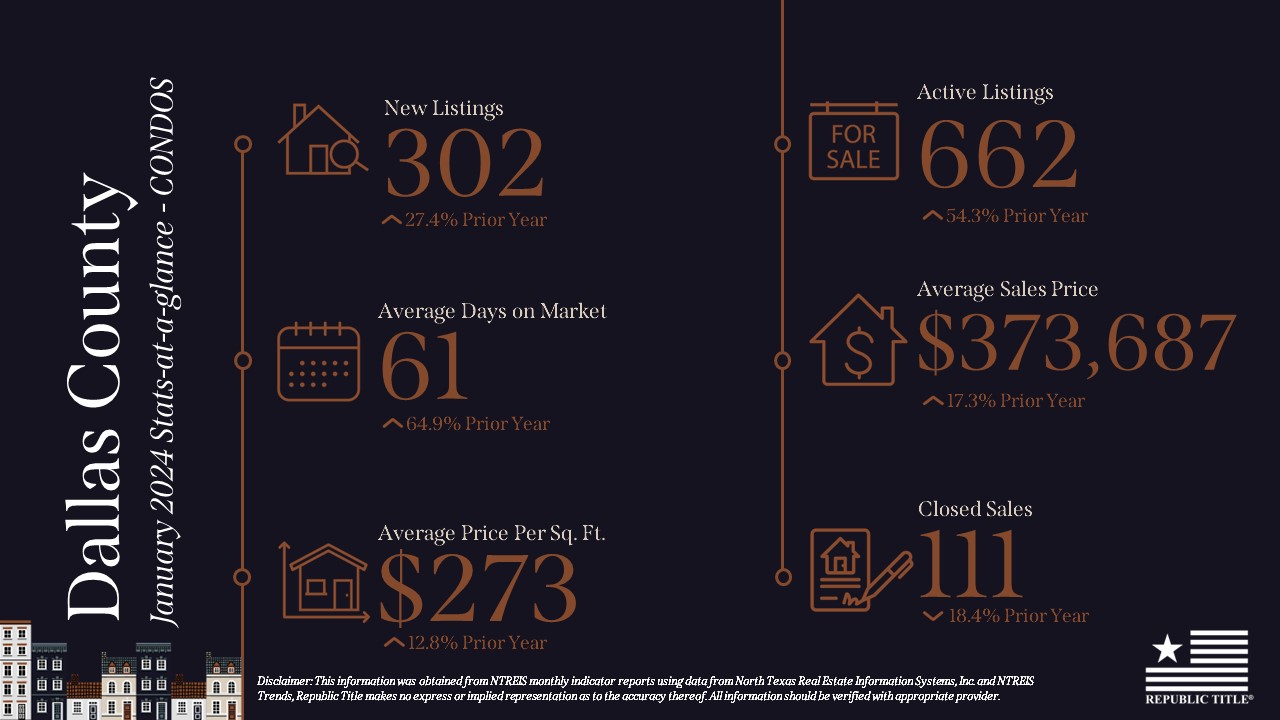
Our stats infographics include a year over year comparison and area highlights for single family homes broken down by county. We encourage you to share these infographics and video with your sphere.

For more stats information, pdfs and graphics of our stats including detailed information by county, visit the Resources section on our website at DFW Area Real Estate Statistics | Republic Title of Texas.

For the full report from the Texas A&M Real Estate Research Center, click here. For NTREIS County reports click here.

City fast Facts Website Thumbnail Graphics-12

Spotlight on Plano

Whether you’re a lifelong resident or new to the area, there’s always something new to discover about your neighborhood.  With that in mind, we created a Fast Facts sheet for cities and neighborhoods all over the DFW area. Our DFW Area fast facts have detailed real estate insights, things to do, places to shop and some of our favorite restaurants in each area.

Our first spotlight is the city of Plano. Plano is a vibrant city known for its thriving business community and high quality of life. With a strong economy, excellent schools, and an abundance of recreational activities, Plano offers residents and visitors a diverse range of attractions, from upscale shopping and dining to beautiful parks and cultural events.

Head to our website now to get all the details you need to stay up-to-date and in-the-know about your local neighborhood. Your community is waiting for you! republictitle.com/dfw-area-city-fast-facts

POPULATION


288K

AVERAGE HOUSEHOLD INCOME

$130K

MEDIAN AGE


39

HOUSING


59% OWN
41% RENT

AVERAGE SALES PRICE

$564K

AREA ACTIVITIES & FEATURES

• ARBOR HILLS NATURE PRESERVE
• CHISHOLM TRAIL GREENBELT
• CRAYOLA EXPERIENCE PLANO
• GO APE ZIPLINE & TREETOP
• HERITAGE FARMSTEAD MUSEUM
• INTERURBAN RAILROAD MUSEUM
• THE SHOPS AT LEGACY & LEGACY WEST | SHOPPING & DINING
• THE BOARDWALK AT GRANITE PARK | SHOPPING & DINING
• THE TEXAS POOL
• HISTORIC DOWNTOWN PLANO ARTS DISTRICT
• OAK POINT PARK
• CARPENTER PARK

FAVORITE LOCAL DINING & DRINK SPOTS

• LEGACY HALL • RED TRUCK CAFE • 1418 COFFEE•
• STEVE FIELDS STEAKHOUSE • THE FILLMORE PUB •
• YAO FUZI • THE LATIN PIG • DENSETSU • AI SUSHI •
• BAVARIAN GRILL • COFFEE DEL RAY • FARM + FEED •
• BAR RANCH STEAK COMPANY • BAVETTE GRILL •
• BEARD PAPA’S • BEERHEAD BAR & EATERY •
BEST THAI PLANO • BLACK RIFLE COFFEE COMPANY •
CAFE GECKO • CAFE MAX • CRAFTWAY KITCHEN •
• FRED’S DOWNTOWN PHILLY • HENRY’S ICE CREAM

FAVORITE LOCAL SHOPPING

DALLAS VINTAGE SHOP • HIRSCH’S MEATS •
• APRICOT LANE • BLUE MERCURY • SCOUT + MOLLY’S •
• ELLA BLEU • SWEET HOME BATH & BODY • LYLA’S
DECOR, CLOTHING & MORE • FEATHERED NEST

AVERAGE DRIVE TIMES

DOWNTOWN DALLAS | 26 MINUTES
• DALLAS LOVE FIELD AIRPORT | 27 MINUTES
• DFW INTERNATIONAL AIRPORT | 25 MINUTES
• AT&T STADIUM & GLOBE LIFE FIELD | 37 MINUTES
• DOWNTOWN FORT WORTH | 50 MINUTES

**Print Version

3 Things thumbnail-01

3 Things You Need To Know About Title Commitment

Looking for the inside scoop on title and real estate? Look no further than our new Three Things video series where we will highlight three things you should know about various title and real estate topics.

First up is Republic Title’s Janet Allen and Matt Visinsky discussing the 3 things you need to know about the Title Commitment. They cover what the title commitment is and the three key parts of the Title Commitment: Schedules A, B and C.

For more information, check out our blog post on the ABC’s of the Title Commitment: https://www.republictitle.com/the-abcs-of-title-commitment/

Texas-Housing-Insight-February-2023

Texas Housing Insight February 2023 Summary

February’s housing market shows 2023 has returned to normal seasonal trends, something not experienced since 2019. Housing sales are back on trend with increases for the month, as are construction starts and permits. Rebounding to pre-pandemic levels means sales and construction activity are still decreased compared with the previous two years. This is likely due to inflated mortgage rates and high inflation. Days on market (DOM) increased across all major metros as inventory rose because of deflated demand. All of these factors point to a cooling housing market and a return to form.

Supply* Rises as Inventory Gains Ground

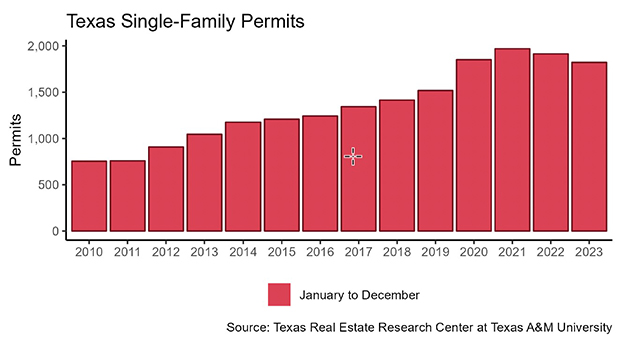
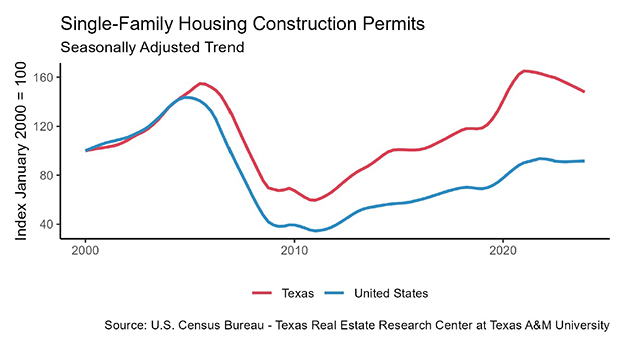
Single-family construction permits reversed their course for February, gaining significant ground with a 17 percent increase month over month (MOM). All four major metros contributed to the statewide rise, as they all had positive gains for February. Houston led the way with a 33 percent increase over last month (3,793 permits), while Austin lagged the rest with a 0.7 percent gain (1,160 permits).

Construction generally hits a seasonal low in December, and peaks in March or June. Single-family construction starts are following this trend with a seasonally adjusted MOM increase of almost 2 percent. December’s low point reached levels not seen since 2015, due in large part to the drastic increase in mortgage rates. March starts, around 9,200 according to Dodge Data & Analytics, pale in comparison to the previous two March levels, which were record-breaking peaks at the time.

The state’s total single-family starts value reached $4.3 billion in February, down from $7.5 billion in February 2022. Houston and Dallas-Fort Worth (DFW) are responsible for more than half of that. Houston continues to account for the largest portion of Texas’ construction values with 29 percent of the market share. DFW accounts for 25 percent.  Austin and San Antonio remained on par with previous years’ market percentage shares.

February’s active listings continued their upward trend since March 2022 after having slowed in the past two months, when the metric fell to 91,000 units after seasonal adjustment. Although, these levels are still lower than pre-pandemic listing levels. Additionally, despite the small dip last month, months of inventory (MOI) returned to an upward trend as inventory levels reached three months. Austin’s MOI fell to just below three months. Dallas followed a similar trend, with MOI dropping to 2.2 months. Meanwhile, Houston and San Antonio bolstered the state with increases, raising the overall months of inventory.

Demand Increases as Sales and Prices Jump

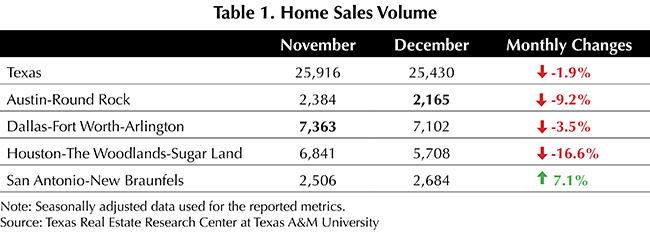
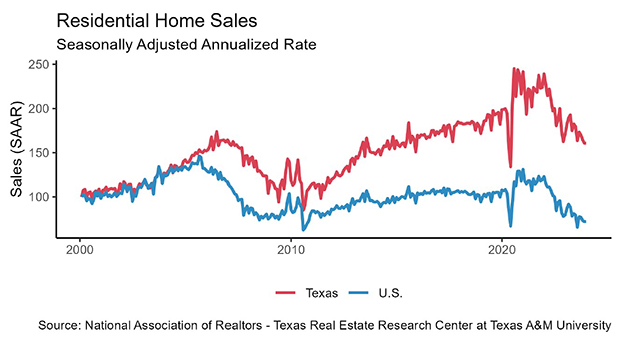
Housing demand started the new year with an upward trend, as sales volume expanded for two consecutive months. Total home sales had a strong boost of 7.8 percent MOM, doubling last month’s 3.7 percent growth. Sales gained more than 2,000 transactions in a month, marching upward to a seasonally adjusted rate of 29,728 closings. Austin and Houston, the two metros that had their great rebound in January, stayed flat this month (Table 1). Meanwhile, Dallas and San Antonio spiked up. Dallas’ 17.1 percent growth brought more than 1,200 additional homes under contract in February.

Sales across all price cohorts continued to follow their normal seasonal cycle with sales increasing through all price cohorts. Homes in the $300K-$400K range remain at the epicenter of the market, making up 28 percent of Texas sales. This constitutes a 2 percent increase in market share for this price cohort over February 2022. DFW increased its market share by a similar 2 percent this month in the same cohort, as the other metros stayed on course with YOY market shares. Despite sales activity picking up, Texas’ average DOM steadily advanced four days in 2023 to 56 days. Compared with the five-year average of 59 days before 2020, the housing market is fast approaching historic norms. Austin posted a ten-year record of 71 days this month, the longest market time since 2013. This is a major swing from the intense market conditions from just a year ago.

Austin homes’ time on market uniformly lengthened across all price cohorts, while other metros had mixed trends. Among the homes valued above $400K, Austin’s DOM ranged from 57 to 69 days, at least ten days longer than the corresponding cohort in the DFW market. Houston homes in the $750K and above price cohort were in a hot market, staying on market only one day longer than homes below $200K.

Prices Flatten as Rates Remain High 

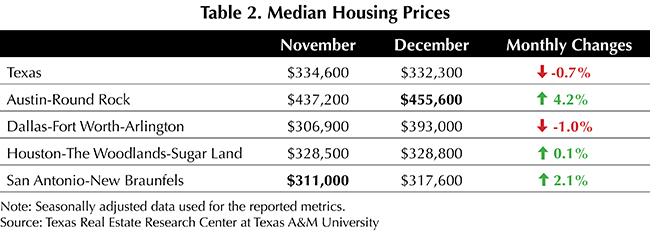
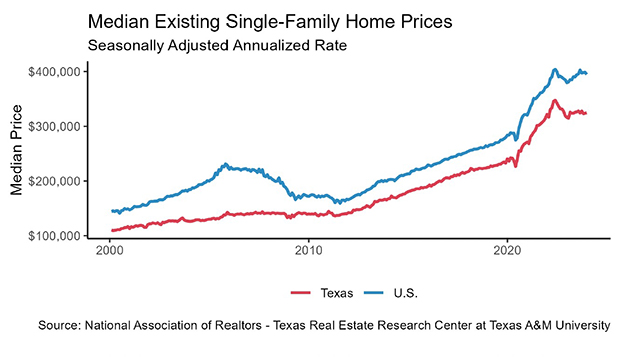
Texas’ median home price mostly stayed flat from the previous month, and only 0.6 percent higher than a year ago (Table 2). However, home prices did fall in Austin with 4.6 percent MOM and 12.2 percent YOY decreases. Dallas and San Antonio still saw low-single-digit price growth from a year ago.

The ten-year U.S. Treasury bond yield reversed the dwindling trend and marched upward 22 basis points to 3.8 percent. The Federal Home Loan Mortgage Corporation’s 30-year fixed-rate saw the fourth consecutive moderation since November, falling to 6.3 percent.

High mortgage rates have discouraged many homebuyers, driving demand down over the past year. The Texas Repeat Sales Home Price Index accounts for compositional price effects and provides a better measure of changes in single-family home values. Texas’ index gained 3.1 percent MOM. Austin stood out with an 8 percent YOY decrease. The other four metros had minor single-digit YOY increases, indicating possible price normalization.

_________________

* All measurements are calculated using seasonally adjusted data, and percentage changes are calculated month over month, unless stated otherwise.

Source – Joshua Roberson, Weiling Yan, and John Shaunfield (April 19, 2023)

https://www.recenter.tamu.edu/articles/technical-report/Texas-Housing-Insight

March 2023

March 2023 DFW Area Real Estate Stats

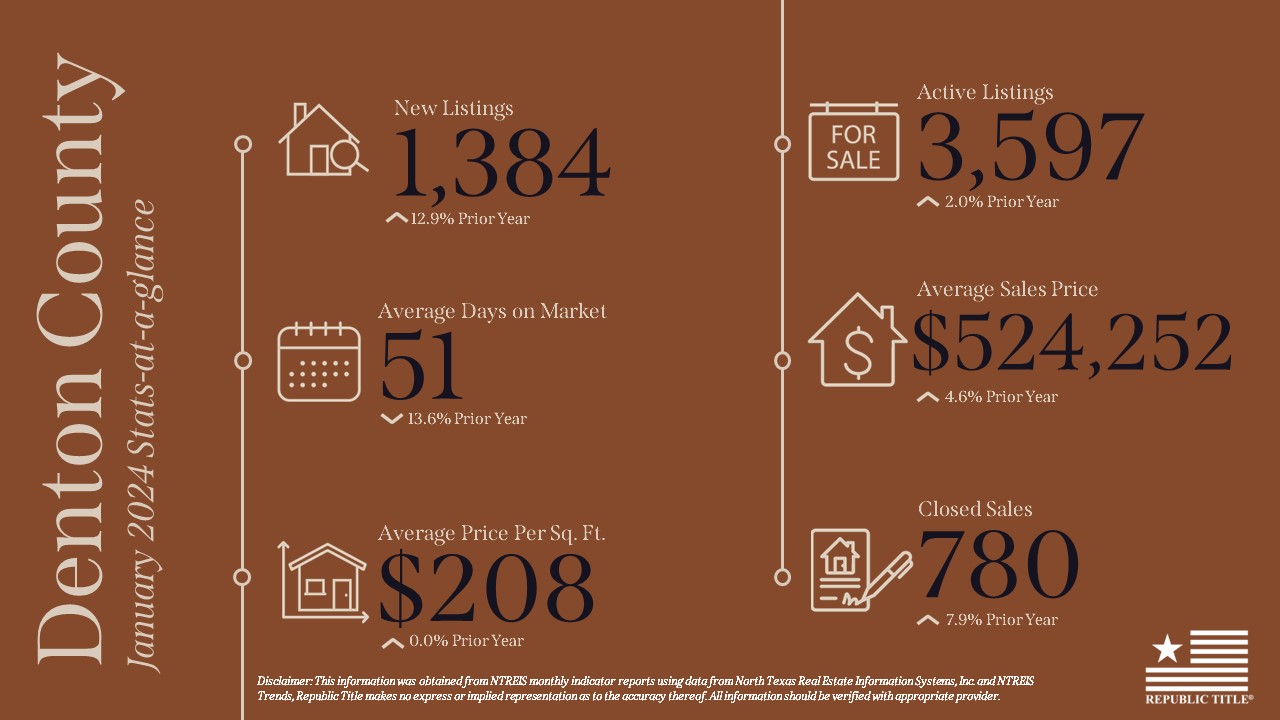
March 2023 stats are in and we have the numbers! The North Dallas real estate market is seeing some interesting trends! Active listings in Collin, Denton, and Rockwall counties are up over 50% from last year, while the price per square foot has fallen across all counties. This means there are more options available for homebuyers looking to make a move in 2023. Interestingly enough, the list prices have fallen ever so slightly in all counties except Rockwall. Does this signal a shift to a more buyer-friendly market? Inventory will be the deciding factor, so stay tuned for stats this summer to see!

Our stats infographics include a year over year comparison and area highlights for single family homes broken down by county. We encourage you to share these infographics and video with your sphere.

For more stats information, pdfs and graphics of our stats including detailed information by county, visit the Resources section on our website at DFW Area Real Estate Statistics | Republic Title of Texas.

For the full report from the Texas A&M Real Estate Research Center, click here. For NTREIS County reports click here.

DFW Area Dog Parks

National Pet Day

If you’re a dog owner in the Dallas area, you’re in luck! The city is home to many fantastic dog parks where you and your furry friend can enjoy some fresh air, exercise, and socialization. Whether you’re looking for a spot to play fetch, run around, or simply relax, there’s a dog park in DFW that’s perfect for you. In this blog post, we’ll be listing out all the dog parks in the Dallas area, so you can find the one that’s closest to you or try out a new location. So grab your leash and let’s get started!

ALLEN

Mutts Canine Cantina
1070 Watters Creek Blvd., Allen, TX 75013

ARLINGTON

Rush Creek Dog Park
1900 Valleywood Dr., Arlington, TX 76013

Tails N Trails Dog Park
950 SE Green Oaks Blvd., Arlington, TX 76018

BEDFORD

Bedford Bark Park Dog Park
3200 Meadow Park Dr., Bedford, TX 76021

COPPELL

Waggin Tails Park (Formerly Coppell Dog Park)
400 S MacArthur Blvd., Coppell, TX 75019

DALLAS

Barry Annino Dog Park (Formerly Bark Park Central)
2530 Commerce St., Dallas, TX 75226

Central Dog Park
4711 Westside Dr., Dallas, TX 75209

Meadows Foundation Dog Park
1100 Skiles St., Dallas, TX 75204

My Best Friend’s Dog Park – Klyde Warren Park
2012 Woodall Rodgers Fwy., Dallas, TX 75201

Main Street Garden Urban Dog Run
1900 Main St., Dallas, TX 75201

NorthBark
4899 Gramercy Oaks Dr., Dallas, TX 75287

Wagging Tail
5841 Keller Springs Rd., Dallas, TX 75248

White Rock Lake Dog Park
8000 E. Mockingbird Ln., Dallas, TX 75218

DENTON

Wiggly Field Dog Park
1760 E. Ryan Rd., Denton, TX 76210

FLOWER MOUND

Lakeside Dog Park at Heritage Park
41047281, Flower Mound, TX 75022

Hound Mound Dog Park
1202 S. Garden Ridge Blvd., Flower Mound, TX 75028

FRISCO

Ruff Range Dog Park
5335 4th Army Memorial Rd., Frisco, TX 75034

FORT WORTH

Fort Woof Dog Park
751 Beach St., Fort Worth, TX 76111

Z Boaz Dog Park
6950 Camp Bowie W Blvd., Fort Worth, TX 76116

GRAND PRAIRIE

Central Bark Dog Park at Veterans Park
7445, 2222 W Warrior Trail, Grand Prairie, TX 75052

IRVING

Irving Dog Park
4140 Valley View Ln, Irving, TX 75038

LEWISVILLE

Railroad Park
4140 Valley View Ln, Irving, TX 75038

MCKINNEY

Bonnie Wenk Dog Park
2996 Virginia Pkwy, McKinney, TX 75071

PLANO

Jack Carter Dog Park
2215 Pleasant Valley Dr, Plano, TX 75023

RICHARDSON

Bush Central Barkway
3581 N Central Expy, Richardson, TX 75023

ROCKWALL

Harry Myers Dog Park
815 E Washington St, Rockwall, TX 75087

SOUTHLAKE

BooBoo’s Buddies Dog Park at Bob Jones Park
3901 N White Chapel Blvd, Southlake, TX 76092

For this and other helpful DFW area information, please visit our Resource Section.

**Print Version

DFW Area Golf Courses

The weather is perfect to hit the golf course. Here is a list of DFW Area Golf Courses that we have put together.

Bear Creek Golf Club
3500 Bear Creek Ct., DFW Airport
Bearcreek-golf.com

Bent Tree Country Club
5201 Westgrove Dr., Dallas
Benttreecc.org

Bridlewood Golf Club
4000 W. Windsor Blvd., Flower Mound
Bridlewoodgolf.com

Brookhaven Country Club
3333 Golfing Green Dr., Farmers Branch
Clubcorp.com/clubs/brookhaven-country-club.com

Brook Hollow Golf Club
8301 Harry Hines Blvd., Dallas
Brookhollowgc.org

Buffalo Creek Golf Club
624 Country Club Dr., Rockwall
buffalocreekgc.com

Canyon Creek Country Club
625 W. Lookout Dr., Richardson
Canyoncreekclub.com

Cedar Crest Golf Course
1800 Southerland, Dallas
Golfcedarcrest.com

Cottonwood Valley
4150 N MacArthur Blvd, Irving
cottonwoodvalley.com

Cowboys Golf Club
1600 Fairway Dr., Grapevine
Cowboysgolfclub.com

Coyote Ridge
1640 West Hebron Pkwy., Carrollton
Coyoteridgegolfclub.com

Dallas Country Club
4155 Mockingbird Ln., Dallas
Thedallascc.org

Dallas Firewheel Golf Park
600 W Campbell Rd., Garland
Golffirewheel.com

Dallas National Golf Club
1515 Knoxville, Dallas
Dallasnationalgolfclub.com

El Dorado Country Club
2604 Country Club Dr., McKinney
Eldoradocc.com

Frisco Lakes Golf Club
7170 Anthem Dr., Frisco
Friscolakesgc.com

Gentle Creek Country Club
3131 Prosper Tr., Prosper
Gentlecreek.com

Gleneagles Country Club
5401 W. Park Blvd., Plano
clubcorp.com/Clubs/Gleneagles-country-club.com

Grapevine Golf Course
3800 Fairway Dr., Grapevine
grapevinegc.com

Golf Club of Dallas
2200 W. Red Bird Ln., Dallas
Golfclubdallas.com

hackberry creek country club
1901 W Royal Ln, Irving
clubcorp.com/clubs/hackberry-creek-country-club

Heritage Ranch Country Club
465 Scenic Ranch Cir., Fairview
Heritageranchgolf.com

Indian Creek Golf Club
1650 W. Frankford Rd., Carrollton
Indiancreekgolfclub.com

Irving Golf Club
2000 East Shady Grove Rd., Irving
Irvinggolfcourse.org

Keeton Park Golf Course
2323 Jim Miller Rd., Dallas
Keetonpark.com

Lake Park Golf Course
6 Lake Park Rd., Lewisville
Lakeparkgc.com

Lakewood Country Club
6430 Gaston Ave., Dallas
Lakewoodcc.com

Las Colinas Country Club
4400 N. O’Connor Rd., Las Colinas
clubcorp.com/Clubs/las-colinas -country-club.com

Luna Vista
11223 Luna Rd., Dallas
twincreeksgolf.com

Mansfield National
3750 National Pkwy., Mansfield
mansfield-national.com

Maridoe Golf Club
2020 Kelly Blvd., Carrollton
Maridoe.com

Meadowbrook Golf Course1
851 Jenson Rd., Ft. Worth
Fortworthgolf.com

Northwood Country Club
6524 Alpha Rd., Dallas
Northwoodclub.org

Oak Hollow Golf Course
3005 N. McDonald St., McKinney
Oakhollowgc.com

Print version

Texas-Housing-Insight-January-2023

Texas Housing Insight January 2023 Summary

January home sales increased month over month (MOM), but it was the slowest start since January 2017, a far cry from January levels from both 2021 and 2022. Other housing metrics, such as median price and inventory, may be showing early signs of stabilizing with only minor changes in recent months compared with the major swings experienced during the pandemic.

Supply1

Single-family construction permits had been sliding down in demand since March 2022. January 2023’s permit level fell 6.9 percent MOM to 8,897 permits. The other two months during the past three years that monthly permits dipped below 9,000 were during the initial pandemic shock in April and May 2020. Construction permits fell in all major metros except Austin. While housing demand in Houston (2,842 permits) was mostly flat, Dallas (2,249 permits) dropped more than 15 percent MOM. Austin’s monthly construction demand (1,082 permits) rebounded 10 percent, issuing twice as many permits as San Antonio (481 permits).

Texas single-family construction starts have likewise plummeted since March 2022 but started 2023 with a positive month in January with 9,090 units. Although construction starts rebounded in every major metro, the January metric was the lowest level reported in Texas since 2016, suggesting a meek outlook for the housing industry.

The state’s total single-family starts value diminished from $3.8 billion in January 2022 to $2.2 billion in 2023. Houston and Dallas continue to account for more than half of the states total, coming in at 27.5 percent and 26.1 percent, respectively. Further pressing the point home that housing activity is down from the previous year, Austin and San Antonio had their construction values nearly cut in half in the first month of 2023.

The rebound in active listings had been aggressive since March 2022. However, the acceleration slowed in the past two months as the metric fell flat at a seasonally adjusted rate of 91,000 units. Compared with the first half of 2022 when inventory was 50 percent short of pre-pandemic levels, housing inventory was only 4.5 percent short in January. Active listings in Austin have more than tripled from a year ago, reaching 8,500 units. Amid the recent flattening, months of inventory (MOI) dipped for the first time in the past eight months. The MOI for the four major metros ranged from 2.5 months to 3.4 months. While Dallas, Austin, and San Antonio all either hovered back or beyond pre-pandemic levels, Houston’s housing supplies still needed more homes to restock.

Demand

Total home sales inched up 3.4 percent MOM to a seasonally adjusted rate of 27,475 sales. This uptick marked the largest MOM jump since the second half of 2022. Sales in Austin and Houston rebounded greatly, with the former metro surpassing San Antonio’s sales volume and the latter surpassing Dallas’ (Table 1). While the housing market opened robustly in 2023, Texas’ sales still diminished by over 20 percent compared with last year’s January metric.

Sales grew across all price cohorts. While homes below $300K still make up 40 percent of the market, this sector’s sales volume rebounded least at 0.5 percent MOM. The remaining price cohorts ascended moderately at a low-single-digit growth, but homes above $750K grew at an impressive rate of 21.6 percent MOM, accounting for almost 9 percent of the market. 

With sales activity picking up, the Texas’ average days on market (DOM) continued to climb but at a slower pace of 54 days. Compared with the five-year average of 59 days before 2020, this is still converging to historic norms; and it is tilting toward a weaker market that favors buyers. Quadrupling since March 2022, Austin posted a first dip in DOM—balancing at 61 days.

Across all price cohorts except one, DOM rose to a range of 50 to 58 days, a three-day average increase across all the cohorts. The $400K-$500K housing sector’s DOM declined by 5.8 days over the previous month. Meanwhile, homes priced over $750K had a 55 DOM, one day higher than the $300K-$400K cohort.

Compared with a surge to 69 percent in 3Q2020 during the pandemic frenzy, Texas’ homeownership rate had been cooling, hovering around 63.6 percent in 2022. At the metropolitan level, the Dallas-Fort Worth (DFW) area was lowest at 56 percent, while Houston was highest at 67 percent. Austin and San Antonio were at 65 and 60 percent, respectively.

Prices

Texas’ median home prices started off the new year with a strengthened housing market. The 2.1 percent MOM rebound was the largest monthly gain since April of last year. All metros posted positive price growth except for San Antonio (Table 2). Median price per square foot (PSF) corroborated with the trend, as San Antonio’s price PSF dropped 1.6 percent MOM to $168.8.

The ten-year U.S. Treasury bond yield continued its four-month decline, reaching 3.5 percent2 in January 2023, while the two-year counterpart decreased to 4.2 percent. The spread between the ten- and two-year bond yields continued to widen for the seventh month straight. The negative spread indicated persistent market uncertainties, and the ten-year bond yield was still far below 2007’s peak of 5.1 percent. The Federal Home Loan Mortgage Corporation’s 30-year fixed-rate moderated slightly this month to 6.3 percent, down 0.1 percent from December.

Rapidly rising mortgage rates have continued to pester the housing market over the past year. The Texas Repeat Sales Home Price Index accounts for compositional price effects and provides a better measure of changes in single-family home values. The January metric was essentially the same as the month before. However, January’s index value of 220 was still 3.9 percent higher than the year before. The same trend also affected the major metros as growth rates shrank from double to single digits, except in Austin, which had a net loss in home values.

_________________

1 All measurements are calculated using seasonally adjusted data, and percentage changes are calculated month over month, unless stated otherwise.

2 Bond and mortgage interest rates are nonseasonally adjusted. 

Source – Joshua Roberson, Weiling Yan, and John Shaunfield (March 20, 2023)

https://www.recenter.tamu.edu/articles/technical-report/Texas-Housing-Insight

Spring-Festivals

Spring Festivals and Events in DFW

Spring is a wonderful time to explore the Dallas-Fort Worth area and experience some of the exciting festivals and events that take place during this season. From cultural celebrations to food festivals, there’s something for everyone to enjoy. Here are some of the top Spring festivals and events in DFW that you won’t want to miss.

The Dallas Arboretum’s Dallas Blooms Festival is a month-long celebration of Spring features over 500,000 blooming bulbs throughout the gardens, including tulips, daffodils, and hyacinths. Visitors can also enjoy live music, special exhibits, and food vendors on select weekends. It’s the perfect way to welcome in the new season and take in the beauty of nature.

Check out our full list of Spring festivals and events and get out there and have some fun!

Dallas Arboretum’s Dallas Blooms Festival  | Dallas | February 25th – April 16th

Fort Worth Food & Wine Festival | Fort Worth | March 30th – April 2nd

Dallas Arts Month | Dallas | month of April 

Dallas Reggae Festival | Addison | April 7th -9th 

Scarborough Renaissance Festival | Waxahachie | April 8th – May 29th

Ennis Bluebonnet Trails Festival | Ennis | April 14th-16th 

Arts in Bloom Festival | McKinney | April 14th -16th 

Grand Prairie Main Street Fest | Grand Prairie | April 21 

Earthx | Dallas |  April 21st – 23rd 

Main Street Art Festival | Fort Worth | April 20th – 23rd 

Spring Japanese Festival | Fort Worth | April 22-23

Art In The Square | Southlake | April 28th – 30th

Mayfest | Fort Worth | May 4th – 7th 

Wildflower Arts & Musical Festival | Richardson | May 19th – 21st  

Rockwall Founders Day Festival | Rockwall |  May 20th  

Taste of Addison | Addison | June 2nd – 3rd