Texas-Housing-Insight-November-2023

Texas Housing Insight November 2023 Summary

The housing market remains tight despite mortgage rates falling from their elevated levels. Home sales decreased just shy of 1 percent month over month (MOM). Prices did not fall alongside sales as most of the state experienced minimal change in prices. Construction permits plummeted in November despite construction starts increasing. Homes sat on the market for less time as average days on market continued its decreasing trend observed this year.

Home Sales Fall as Listings Increase

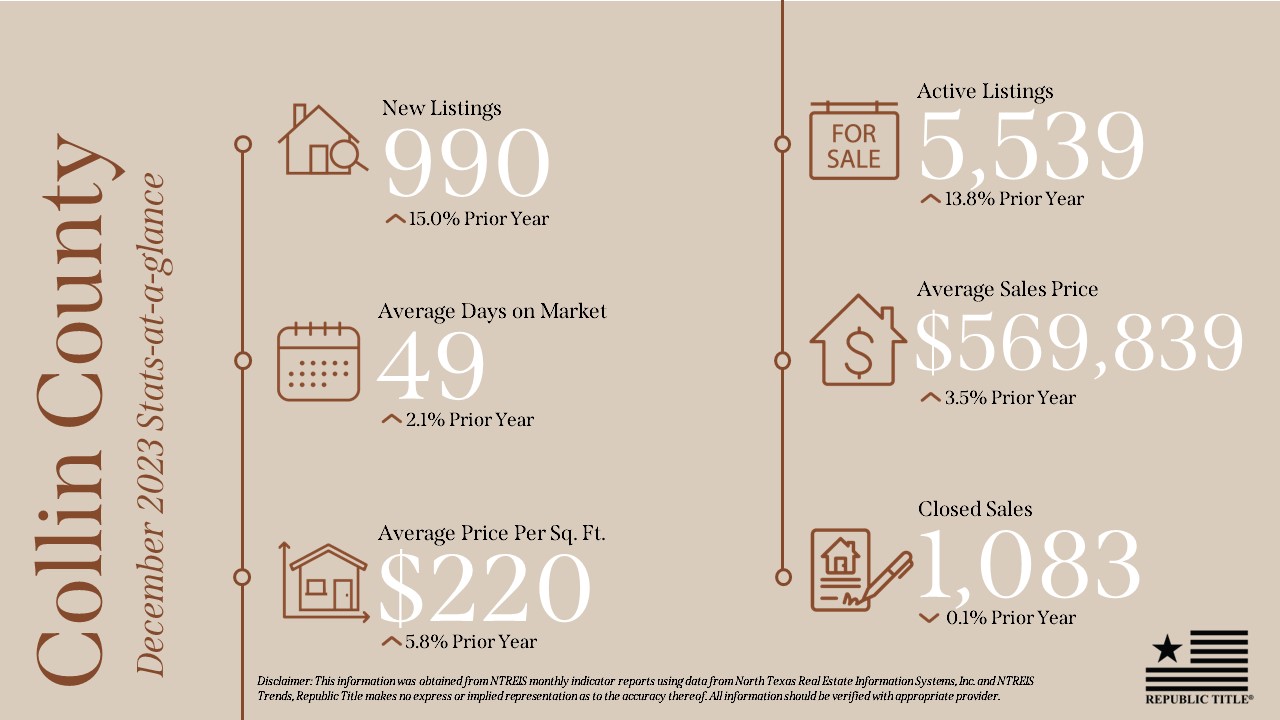
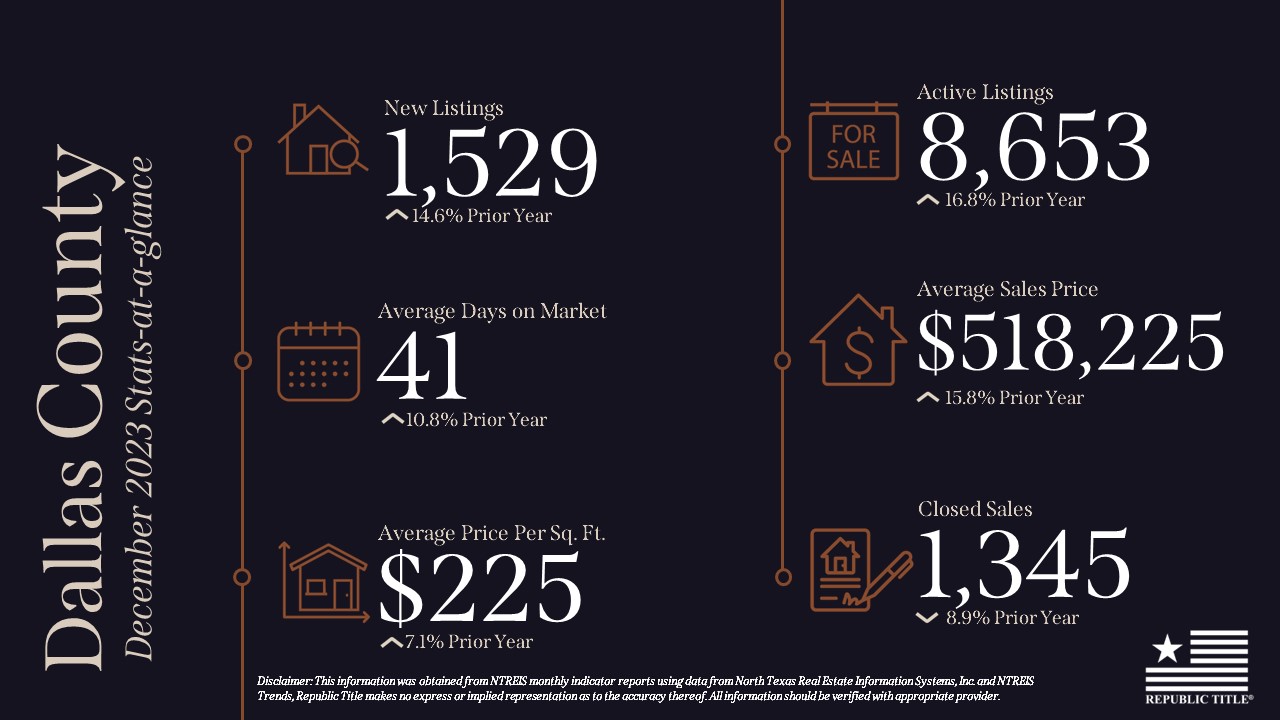
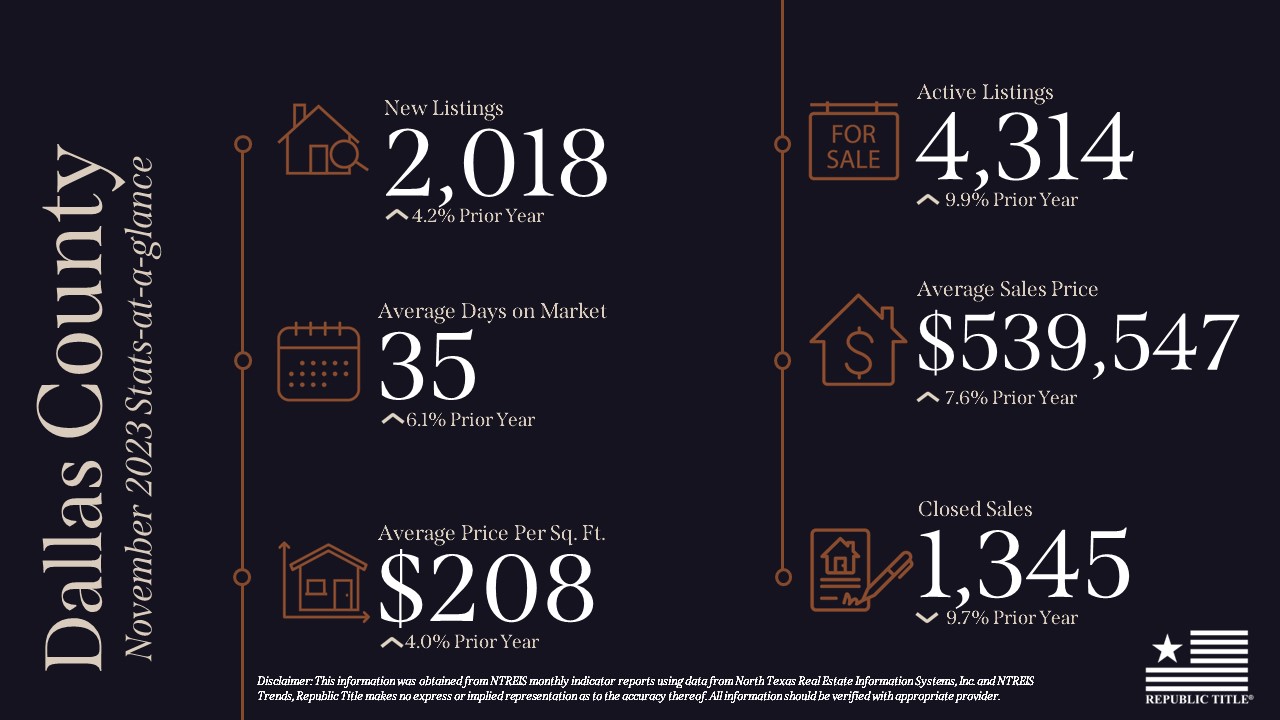
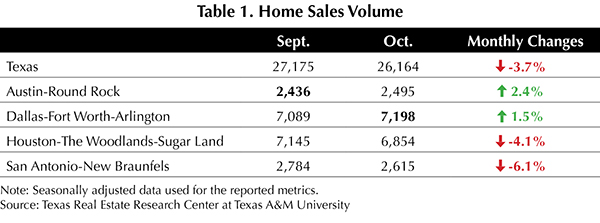
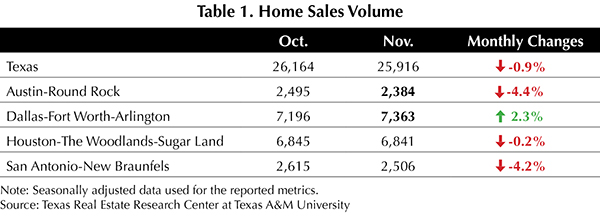
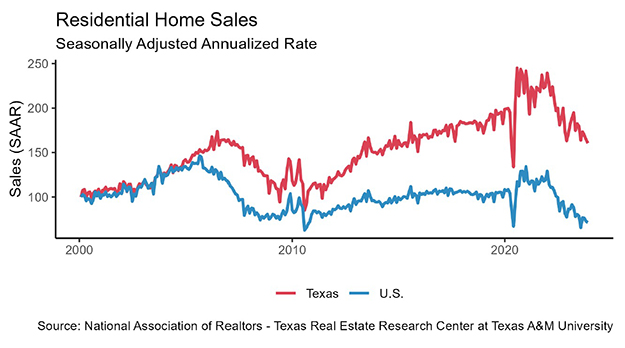
Mortgage rates fell this month, but their elevated level remains problematic for homebuyers as Texas’ total home sales fell 0.9 percent MOM to 25,916 sales in November (Table 1). Among the Big Four, Dallas reported the only increase in home sales, rising 2.3 percent to 7,363 sales. Austin fell 4.4 percent, and San Antonio reported its second straight month of significant decreases, plummeting 8.9 percent. The gap between Dallas and Houston widened as both continued to move in opposite directions. High mortgage rates have created an affordability problem, with people needing to spend more of their total income on affording a median-priced home.

The state’s average days on market (DOM) fell to 51, continuing the decline observed in 2023. For the past seven months, readings have gone from 59 to 51 days, indicating a shorter listing period. Among the major metros, Austin (75 days) and San Antonio (70 days) reported DOM significantly above the state average, while Houston (43 days) and Dallas (46 days) experienced minor fluctuations from the previous month.

Housing supplies are stocking up as active listings marked their sixth straight month of increases, climbing to 104,058 listings. This is the first time in four years supply has hit six-digit numbers. All four major metros posted monthly gains with Dallas adding 1,949 listings (9.1 percent) while Austin added fewer than a hundred homes for the third consecutive month. The constant increases since the start of 2023 have put the state’s active listings at January 2019 levels.

The state’s new listings rose 1.85 percent to 43,255 in November. San Antonio contributed heavily to this jump, rebounding from last month’s fall with a 9.4 percent increase. Dallas’s numbers remained unchanged from October. Amid the rise in active listings, the months of inventory (MOI) had a small increase to 3.7 months with all four major metros also posting small increases.

Mortgage Rates Fall from Peak Values

As news broke that the Fed might be finished with their rate hikes, treasury and mortgage rates fell. The ten-year U.S. Treasury Bond yield fell 30 basis points to 4.5 percent. Likewise, the Federal Home Loan Mortgage Corporation’s 30-year fixed-rate fell 18 basis points to 7.44 percent. The decreases across the board signal an increase in housing affordability.

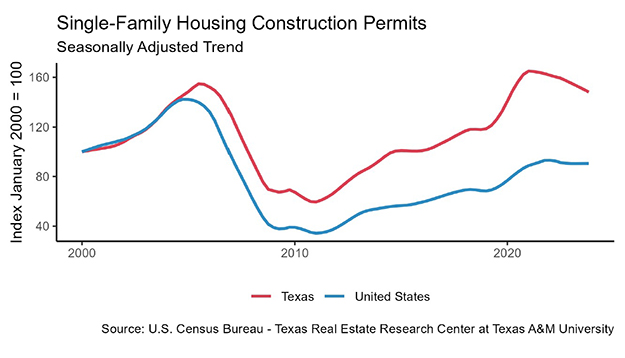
Mixed Single-Family Construction Activity

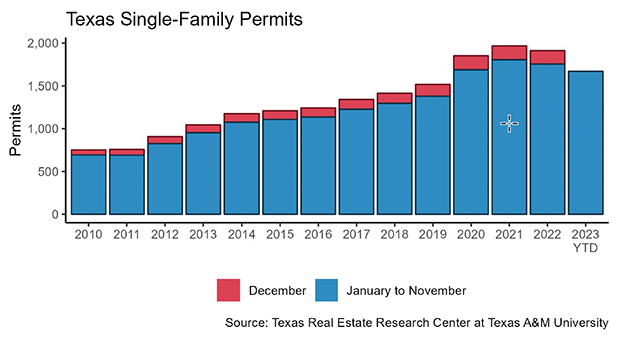
Texas’ single-family construction permits fell 1.7 percent MOM to 12,418 issuances. Both Austin and San Antonio had MOM dips falling 7 percent and 16 percent, respectively. Houston was essentially unchanged with only a 0.3 percent decline while Dallas grew by 1.3 percent.

Construction starts grew while construction permits fell, according to data from Dodge Construction Network. Single-family starts increased 1.1 percent MOM to 11,744 units. Both Dallas (3,393 starts) and Houston (3,510 starts) continued to outperform the rest of the state, combining for 58 percent of the total starts. Austin increased its lead over San Antonio, with 1,647 starts approaching a 3:1 ratio compared to San Antonio. Historically, Austin’s advantage has been about 2:1 in total starts.

The state’s year-to-date total single-family starts value climbed to $27.7 billion, up from $25.4 billion in October. Starts values have been mirroring 2019 values since May, remaining within $1 billion dollars from the observed 2019 values. Houston and Dallas both accounted for 30 percent of the state’s construction activity values.

Median Home Price Steady Across the Big Four

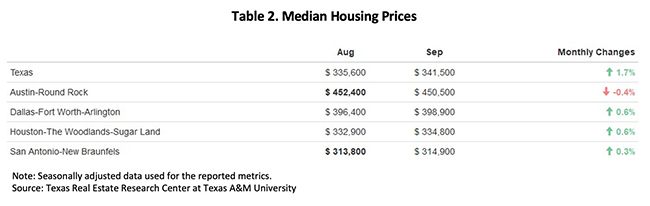
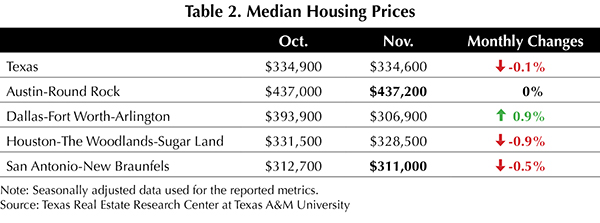
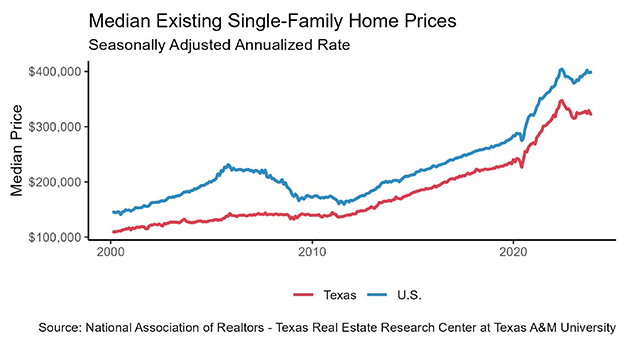
Texas’ median home prices recorded a modest decline, falling 0.1 percent to $334,600 (Table 2). All of the Big Four recorded marginal changes of less than 1 percent, with Dallas exhibiting the only increase in price at 0.9 percent. Austin’s home prices have come down significantly from the highly inflated 2022 prices, although remain elevated from pre-COVID prices.

Home prices continued to hover around $200,000-$300,000 and $300,000-$400,000, accounting for 26 and 24 percent of total home sales, respectively.

The Texas Repeat Sales Home Price Index (Dec 2004=100) fell 0.9 percent MOM but remains 2 percent up from the previous year. Houston had the highest annual appreciation at 2.6 percent YOY increase while Austin showed the lowest annual appreciation at negative 3 percent.

Source – Joshua Roberson and Koby McMeans (January 24, 2024)

https://www.recenter.tamu.edu/articles/technical-report/Texas-Housing-Insight

Slide1

December 2023 DFW Real Estate Stats

In December 2023, real estate statistics across various counties showed mixed trends. In Collin County, new listings increased by 15%, active listings rose by 13.8%, and the average sales price went up by 3.5% to $569,839. However, there was a 2.1% increase in days on market, reaching 49 days. Price per square foot also saw a 5.8% uptick at $220, while closed sales experienced a slight decrease of 0.1%, totaling 1083.

Dallas County witnessed a 14.6% increase in new listings, with active listings up by 16.8%. The average sales price soared by 15.8% to $518,225, and the price per square foot rose by 7.1% to $225. Days on market increased significantly by 10.8%, reaching 42 days, while closed sales declined by 8.9%, totaling 1345.

Denton County reported a more modest increase in new listings at 2.9%, with active listings up by 2.5%. The average sales price grew by 4.7% to $549,571, and the price per square foot increased by 2.4%. Days on market experienced a 1.9% rise, averaging 54 days. However, closed sales saw a substantial decline of 16.2%, totaling 912.

Rockwall County saw a 7.7% increase in new listings, but total actives were down by 6.4%. The average sales price rose by 4.1% to $479,202, and the price per square foot increased by 1.1%. Days on market surged by 25.9%, averaging 73 days, while closed sales declined by 10.4%, totaling 164.

In Tarrant County, new listings decreased by 2.3%, but total active listings went up by 7.8%. The average sales price, price per square foot, and days on market increased by 1.1%, 1.1%, and 4.3%, respectively. Closed sales, however, experienced a notable decline of 10.2%, totaling 1534.

Our stats infographics include a year over year comparison and area highlights for single family homes broken down by county. We encourage you to share these infographics and video with your sphere.

For more stats information, pdfs and graphics of our stats including detailed information by county, visit the Resources section on our website at DFW Area Real Estate Statistics | Republic Title of Texas.

For the full report from the Texas A&M Real Estate Research Center, click here. For NTREIS County reports click here.

uzfev5te

Tips From Republic Title for Understanding and Preventing Wire Fraud

Real estate transactions are significant financial undertakings, making them attractive targets for fraudsters. That’s why the Title Underwriting and Legal team at Republic Title is looking to protect its customers with these tips and consumer information.

Among the various types of fraud, wire fraud has become increasingly common in real estate transactions in recent years. While exact statistics can be hard to come by due to underreporting, the FBI reported in 2020 that victims lost over $200 million to real estate wire fraud alone. This significant sum underscores the scale of the problem.

How Wire Fraud Occurs

Wire fraud in real estate transactions often involves criminals attempting to manipulate the financial aspects of the transaction. Here’s how it typically happens:

1. Impersonation: Fraudsters may impersonate legitimate parties involved in the transaction, such as real estate agents, title company representatives, or even the buyers and sellers themselves. They send convincing emails or text messages that appear to be from these trusted sources.

2. False Wire Instructions: Once they’ve gained trust, the criminals send false wire instructions, either requesting a change in account details or directing the victim to wire funds to a fraudulent account. These instructions often contain convincing details about the transaction.

3. Urgency and Pressure: Scammers often use tactics that create a sense of urgency and pressure victims to act quickly, leaving them with little time to question the authenticity of the requests.

4. Lack of Verification: Victims may not independently verify the instructions due to the perception that they are dealing with trusted parties, relying solely on email or other electronic communication for confirmation.

Preventing Wire Fraud

Preventing wire fraud in real estate transactions requires vigilance and adherence to best practices:

1. Independent Verification: Always verify wire transfer instructions independently, ideally through a phone call using a previously provided phone number. Avoid relying solely on email communication or text messages, as it can be compromised. 

2. Secure Communication: Use secure and encrypted communication channels when sharing sensitive financial information. This ensures that your conversations remain confidential and protected from eavesdropping.

3. Education and Awareness: Stay informed about common wire fraud tactics and red flags. Look out for unusual or unexpected changes in wire instructions and urgent requests for funds. Encourage all parties involved in the transaction to do the same.

What to do if You Are The Victim

If you discover that funds have been transferred to a fraudulent account, contact your bank or the money transfer company immediately. Ask the bank or money transfer company to attempt a wire recall. Contact your local FBI, State Attorney General’s office, and the FTC to report the fraud. File a complaint, regardless of the dollar amount, with the FBI’s Internet Crime Complaint Center at www.ic3.gov. Part of the mission of ic3 is to provide the public with a reliable and convenient reporting mechanism to submit information to the FBI concerning suspected criminal activity. Information is analyzed and used for investigative and intelligence law enforcement purposes and for public awareness. 

Wire fraud is a significant threat in real estate transactions due to the potential for substantial financial losses. Understanding how it occurs and implementing preventive measures is crucial to safeguarding your investments. By adopting independent verification, secure communication, education, and confirmation of contacts, you can reduce the risk of falling victim to wire fraud. Additionally, the Republic Title Underwriting and Legal team is available to answer your questions and be a resource for you in working towards a smooth closing. Republic Title’s team includes Matt Visinsky, Wade Bogdon, Jay Turner, Steve Holley, and Sarah Mann. 

Source: Candysdirt.com – Tips From Republic Title for Understanding and Preventing Wire Fraud – CandysDirt.com

Social-Media-Content-Calendar-Blog-Header

Social Media Content Planning

Have you been interested in upping your social media game but the prospect of planning your content seems overwhelming? Are you ready to have a more intentional marketing plan to reach your followers? Whatever your reason, we have put together a content calendar template to help you crush your social media goals this new year. Our content calendar has 30 days of great content ideas you can use as well as a longer list of items to help you brainstorm. Or use the second blank page to start building our your own custom content.

Click here to download the Content Calendar Worksheet

Tax Information for 2023 Home Buyers

It’s that time of year again! Please click the link below for a PDF that you can provide to your clients with important websites, phone numbers and instructions on how to file their exemptions.

Our goal at Republic Title is to provide you with helpful information that saves you time and assists you in building your real estate business.

Important Tax Exemption Information

1. Exemptions are a form of tax relief that can reduce the taxable value of your property.

Types of exemptions include:
     • Homestead
     • Disabled veteran
     • Over 65 years of age
     • Agricultural
     • Disabled individual

2. If you own and occupy your new home, it is your homestead and you likely qualify for a homestead exemption. This is the most common type of tax exemption.

3. When submitting an application for exemptions, you must submit a copy of your driver’s license. The address on your license must match the property address of the property you are filing the exemption for.

4. To apply for an exemption, the homeowner, in most cases, must be occupying the property as their homestead on January 1st of the tax year in which the exemption is granted. It may be possible to apply for an exemption sooner. Please reach out to your county appraisal district to confirm the date that you may apply.

5. It is free to file exemptions. The forms can be downloaded on the Central Appraisal District’s website for the county in which the property is located. Central Appraisal District contact information is listed below.

Collin County Central Appraisal District – 469.742.9200
Dallas County Central Appraisal District – 214.631.0520
Denton County Central Appraisal District – 940.349.3800
Ellis County Central Appraisal District – 972.937.3552
Grayson County Central Appraisal District – 903.893.9673
Hunt County Central Appraisal District – 903.454.3510
Johnson County Central Appraisal District – 817.648.3000
Kaufman County Central Appraisal District – 972.932.6081
Parker County Central Appraisal District – 817.596.0077
Rockwall County Central Appraisal District – 972.771.2034
Tarrant County Central Appraisal District – 817.284.0024

City fast Facts Website Thumbnail Graphics-09

Spotlight on Lakewood

Whether you’re a lifelong resident or new to the area, there’s always something new to discover about your neighborhood.  With that in mind, we created a Fast Facts sheet for cities and neighborhoods all over the DFW area. Our DFW Area fast facts have detailed real estate insights, things to do, places to shop and some of our favorite restaurants in each area.

Lakewood, nestled near White Rock Lake in Dallas, is a highly sought-after neighborhood known for its natural beauty and distinctive architectural styles. With its tree-shaded streets, historic homes, and vibrant sense of community, Lakewood offers residents a picturesque and welcoming environment. The neighborhood boasts a thriving local scene with unique shops, trendy restaurants, and proximity to outdoor activities, making it a desirable place to live for those seeking a blend of tranquility and urban amenities.

Head to our website now to get all the details you need to stay up-to-date and in-the-know about your local neighborhood. Your community is waiting for you! republictitle.com/dfw-area-city-fast-facts

POPULATION

34.6K

AVERAGE HOUSEHOLD INCOME

$157K

MEDIAN AGE

37

HOUSING

55% OWN
45% RENT

AVERAGE SALES PRICE

$780K

AREA ACTIVITIES & FEATURES

• LAKEWOOD COUNTRY CLUB
• WHITE ROCK LAKE
• BOWLSKI
• FLAG POLE HILL
• SANTA FE TRAIL
• TIETZE PARK
• DALLAS ARBORETUM & BOTANICAL GARDEN
• BATH HOUSE CULTURE CENTER
• GRANADA THEATRE

FAVORITE LOCAL DINING & DRINK SPOTS

• WHITE ROCK COFFEE • GARDEN CAFE •
• WELL ROUNDED COFFEE • CAFE IZMIR •
• BALCONY CLUB • MOT HAI BA •
• TIMES TEN CELLARS • CRY WOLF •
• TERILLI’S • SMOKY ROSE • MERIDIAN •
• COCK & BULL NEIGHBORHOOD PUB •
• GOODFRIEND BEER GARDEN & BURGER •
• EL VECINO TEX MEX • HILLSIDE TAVERN •
• TACO JOINT • SISTER RESTAURANT •
• LOUNGE HERE • HUDSON HOUSE •

FAVORITE LOCAL SHOPPING

• THE T SHOP • THE COLLECTIVE • BETTY LOU •
• TALULAH & HESS • GOOD LOCAL MARKETS •
• FROGGIES 5&10 • WHITE ROCK SOAP GALLERY •
• BULLZERK • CURIOSITIES ANTIQUES •
• TEXAS GOODS COMPANY • THE LITTLE THINGS •
• JIMMY’S FOOD STORE •

AVERAGE DRIVE TIMES

DOWNTOWN DALLAS | 10 MINUTES
• DALLAS LOVE FIELD AIRPORT | 15 MINUTES
• DFW INTERNATIONAL AIRPORT | 33 MINUTES
• AT&T STADIUM & GLOBE LIFE FIELD | 34 MINUTES
• DOWNTOWN FORT WORTH | 45 MINUTES

**Print Version

Slide1

November 2023 DFW Real Estate Stats

November stats are in! New listings increased over November 2022 in all counties except for Denton County. Rockwall County saw the biggest increase in new listings with 219 (up 16.5% over November 2022). Days on market increased in Denton County (7.7% YoY), Dallas County (6.1% YoY), and Tarrant County (7.9% YoY) while Collin County slightly decreased by 2.3% from 2022. The National Association of Realtors is forecasting that Dallas-Fort Worth area will be one of the country’s top housing marketing in 2024, second to Austin. These stats provide valuable insights for both buyers and sellers as we round out 2023 and prepare for the new year.

In this ever-evolving real estate landscape, understanding local market trends is essential. Whether you’re buying, selling, or investing, our team is here to provide expert guidance tailored to your needs.

Our stats infographics include a year over year comparison and area highlights for single family homes broken down by county. We encourage you to share these infographics and video with your sphere.

For more stats information, pdfs and graphics of our stats including detailed information by county, visit the Resources section on our website at DFW Area Real Estate Statistics | Republic Title of Texas.

For the full report from the Texas A&M Real Estate Research Center, click here. For NTREIS County reports click here.

Winter Weather Emergency Preparedness

It’s no secret the weather in North Texas can be unpredictable and brutal at its extremes.  That’s why it’s important to be prepared for whatever mother nature throws our way.  Our Winter Weather Emergency Preparedness list will help you know how to prep beforehand, and give you tips to keep you and your family safe in even the harshest of winter storms.

TO DO BEFORE THE STORM
Create a winter storm emergency kit from the above list. Locate the main water line to your house.
Fill up your car with gas.
Winterize your home. (See the back for list)
Know your medical needs.
Replace wiper fluid with a wintertime mixture.
Make sure your tires have air in them.
Charge all your devices and power strips.
Lower the heat in your house a few degrees if you can to help avoid grid failure.

IF YOU LOSE POWER
Immediately turn off the water to your house. Then turn on all the faucets to your house and let the water flow until it stops. This ensures there is no water in your pipes that can burst.
Unplug Valuable devices in your house like TVs, computers, and gaming systems.
Choose one room in your house to “Live” in.
Close your garage door.
Keep your freezer and refrigerator closed.
Know the signs of hypothermia and monitor all loved ones. Cover your windows with blankets if you can.
Open your cabinets to let warmer air around the pipes.

IF YOU LOSE WATER
Turn off the power to your water heater if your power isn’t off. Use bottled water if you need to drink or cook.
If you have lost power, when you drain your faucets, save the water in the tub & sink to use.
If you have saved water you can use it to flush toilets.

AFTER THE STORM
Check to make sure no pipes burst before turning your water back on. If you must leave your house, try to keep roads clear for emergency vehicles and be careful when driving as roads could still be iced and dangerous.
Apply for FEMA if it applies to you.
Call any plumbers or other contractors to fix immediate damage. File any insurance claims as soon as possible.

KNOW THE SIGNS OF HYPOTHERMIA
Signs of Hypothermia in Adults: Shivering
Exhaustion or feeling very tired Confusion
Fumbling hands
Memory loss
Slurred speech
Drowsiness
Signs of Hypothermia in Babies:
bright red, cold skin
very low energy
Hypothermia is a medical emergency. If you notice any of the above signs, take the person’s temperature. If it is below 95° F, get medical attention immediately! Warm drinks can help increase body temperature, but never give alcoholic drinks.

STOCK UP ON THE BASICS BEFORE ANYTHING HAPPENS
Extra Gallons of Water or Bottled Water Extra Baby Food/Formula
Extra Pet Food
Extra Medication
Shelf Stable Meals
Shelf Stable Snacks
Battery Powered or Crank Flashlight Battery Powered or Crank Radio Consider a Portable Generator
Extra hats, coats, mittens, and blankets A Warm Winter Coat
Windshield scraper
Shovel
First Aid Kit
Tow Chains or Rope
Tire Chain if you need to drive
Cat Litter or Sand to help tires get traction

Notice:
1.  This is an emergency supply. Don’t use it! Save it for a true crisis.

2. Never attempt to use a gas or charcoal burning appliance, camp stove or generator in enclosed spaces. This can cause Carbon Monoxide poisoning. 

3.  In any true emergency call 911.

Click here for a pdf version.

City-fast-Facts-Website-Thumbnail-Graphics-15

Spotlight on Lake Highlands

Whether you’re a lifelong resident or new to the area, there’s always something new to discover about your neighborhood.  With that in mind, we created a Fast Facts sheet for cities and neighborhoods all over the DFW area. Our DFW Area fast facts have detailed real estate insights, things to do, places to shop and some of our favorite restaurants in each area.

Lake Highlands, located in the northeastern part of Dallas, is a well-established and diverse neighborhood known for its scenic beauty and strong sense of community. With its tree-lined streets, numerous parks, and proximity to White Rock Lake, Lake Highlands offers residents ample opportunities for outdoor recreation. The neighborhood also boasts a range of housing options, top-rated schools, and a variety of local businesses, making it a desirable place to live with a suburban feel within the city.

Head to our website now to get all the details you need to stay up-to-date and in-the-know about your local neighborhood. Your community is waiting for you! republictitle.com/dfw-area-city-fast-facts

POPULATION

48.9K

AVERAGE HOUSEHOLD INCOME

$80K

MEDIAN AGE

35

HOUSING

35% OWN
65% RENT

AVERAGE SALES PRICE

$437K

AREA ACTIVITIES & FEATURES

• FLAG POLE HILL
• DALLAS ARBORETUM & BOTANICAL GARDENS
• ROYAL OAKS COUNTRY CLUB
• TOPGOLF
• GEORGE W. BUSH PRESIDENTIAL CENTER
• HARRY S MOSS PARK
• SANDBOX VR | VIRTUAL GAMING CENTER
• WHITE ROCK LAKE
• LAKE HIGHLANDS NORTH PARK
• WATERCREST PARK
• PLAY STREET MUSEUM
• ALAMO DRAFTHOUSE CINEMA

FAVORITE LOCAL DINING & DRINK SPOTS

• CEDAR & VINE • RESIDENT TAQUERIA • THE TACO JOINT •
• SOCO BISTRO & CAFE • MOMO ITALIAN • FIRESIDE PIES •
• SHADY’S BURGERS & BREWHAHA • LOCHLAND’S IRISH
PUB • VECTOR BREWING • RONNIE’S CATFISH & MORE •
THE KOI WAY • ONE90 SMOKED MEATS • ZIZI RAMEN & SUSHI •
• MIJAS TAQUERIA • JJ’S CAFE • PLANO CAFE • TONY’S PIZZA
& PASTA • FISH CITY GRILL • ONE NOSTALGIA TAVERN •

FAVORITE LOCAL SHOPPING

• LAKE HIGHLANDS TOWN CENTER • THE STORE IN LAKE
HIGHLANDS • LAKERIDGE VILLAGE SHOPPING CENTER •
• WHITE ROCK SOAP GALLERY • THE UNDERGROUND
MARKET • CITY VIEW ANTIQUE MALL • CURIOSITIES •
• THE HILL SHOPPING CENTER •

AVERAGE DRIVE TIMES

• DOWNTOWN DALLAS | 30 MINUTES
• DALLAS LOVE FIELD AIRPORT | 30 MINUTES
• DFW INTERNATIONAL AIRPORT | 35 MINUTES
• AT&T STADIUM & GLOBE LIFE FIELD | 40 MINUTES
• DOWNTOWN FORT WORTH | 60 MINUTES

**Print Version

Texas-Housing-Insight-October-2023

Texas Housing Insight – October 2023 Summary

High mortgage rates continue to put downward pressure on the housing market, with Texas home sales decreasing 5.9 percent year-over-year (YOY). The average price fell alongside sales, with homes costing around $6,000 less than in September. Demand for new construction increased despite the high entry barrier into the housing market. Homes continue to sit on the market longer, increasing by a week since the start of the year.

Housing Demand Remains Weak

High mortgage rates continue to decrease demand for homebuyers, leading to Texas’ total home sales falling 3.7 percent to 26,164 sales in October (Table 1). The “Big Four” metros were split with Austin and Dallas experiencing gains while Houston and San Antonio fell significantly. Austin had the highest monthly elevation with a 2.4 percent growth rate while San Antonio plummeted by 6.1 percent. The gap between Dallas and Houston grew as they moved in opposite directions. High mortgage rates continue to increase the entry barrier for buyers, leaving only the most committed buyers in the market.

The state’s average days on market (DOM) enters its sixth month of decreases, falling from 59 days in February to 52 days in October, indicating a shorter listing period. Among the major metros, Houston (44 days) posted the only monthly decrease while San Antonio (70 days) posted the largest gain. Dallas (44 days) and Austin (68 days) remain unchanged from the previous month.

Housing supplies are stocking up as active listings marked their seventh straight month of increases, climbing 4.1 percent to 98,875 listings. All four major metros posted monthly gains with Houston (8.5 percent) adding 1,867 listings while Austin (0.9 percent) had a moderate gain of 84 listings. The constant increases since the start of 2023 have put the state’s active listings number at October 2019 levels.

The state’s new listings fell 1.45 percent to 42,100 in October. San Antonio contributed heavily to this decline, falling over 17 percent (790 homes). Amid the rise in active listings, the months of inventory (MOI) grew to 3.8 months with all four major metros posting marginal gains.

High Mortgage Rates Continue to Impair Affordability

The Fed’s effort to curb inflation has led to a substantial rise in both treasury and mortgage rates. The ten-year U.S. Treasury Bond yield grew for the sixth consecutive month reaching 4.8 percent. Likewise, the Federal Home Loan Mortgage Corporation’s 30-year fixed-rate increased to 7.62 percent, up 42 basis points. The inflated mortgage rate is expected to further raise the cost of homeownership, decreasing mortgage applications.

Single-Family Permit Levels Rebound

Texas’ single-family construction permits rose 1.1 percent month over month (MOM) to 12,619 issuances. All four major metros reported growing demand for permits except for Houston (4,007 units), falling 4.6 percent. Among the other three metros, both San Antonio (967 units) and Dallas (3,731 units) saw double-digit monthly percent gains at 31 and 24 percent, respectively. Austin rebounded from last month’s fall, climbing 8.7 percent to 1,643 units.

Construction starts grew alongside construction permits according to data from Dodge Construction Network. Single-family construction starts increased 1.2 percent MOM to 11,556 units. Both Dallas and Houston led with over 3,250 houses breaking ground, surpassing the combined total of other metros outside the Big Four. Home project starts in Austin (1,605 starts) and San Antonio (694 starts) surpassed the typical 2:1 ratio.

The state’s year-to-date total single-family starts value climbed to $25.4 billion, up from $22.8 billion in September. Starts values continued the previous month’s trend of mirroring the values observed in 2019. Houston and Dallas remain the largest contributors, accounting for more than half of the state’s construction activity values. Dallas’ market share rose to 30.2 percent, with Houston trailing at 29.7 percent.

Median Home Price Falls for First Time Since February

After last month’s spike in median home prices, October erased that increase with the housing market easing as the median home price fell 1.9 percent MOM, falling by over $6,000 from last month. Housing prices remained elevated, but this month they declined as all of the Big Four metros reported monthly decreases with Austin experiencing the greatest decrease at 3 percent. Dallas and Houston declined by over 1 percent while San Antonio declined the least at 0.7 percent (Table 2).

Due to the price rise, half of homes are now priced at $200,000-$300,000 or $300,000-$400,000, accounting for 26 percent and 24 percent of total home sales, respectively.

The Texas Repeat Sales Home Price Index (Dec 2004=100) moderated at a 0.1 percent MOM loss but was up 1.5 percent from the previous year. Austin had the lowest annual appreciation with a 5.7 percent YOY decrease while Houston showed the highest annual appreciation at 2.5 percent.

Source – Joshua Roberson and Koby McMeans (December 13, 2023)

https://www.recenter.tamu.edu/articles/technical-report/Texas-Housing-Insight