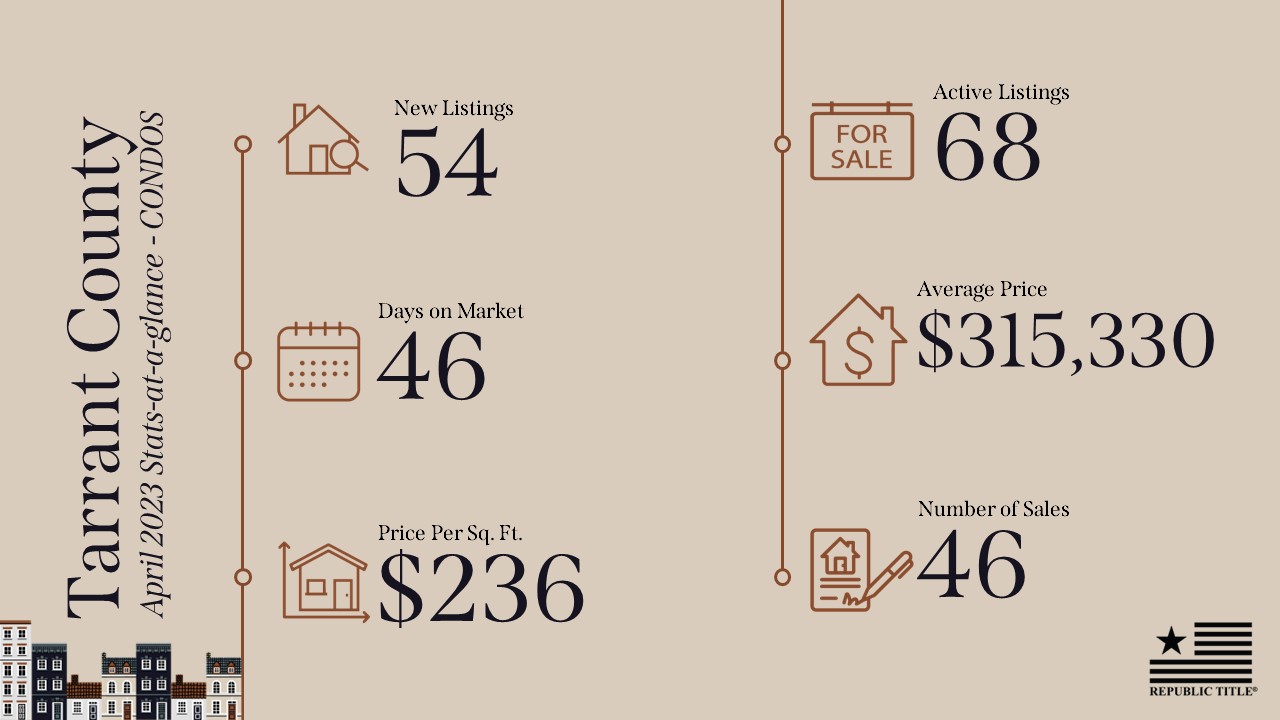
July-Gardening-Tips

July Landscape & Gardening Tips & To-Do’s

Need help planting a successful garden or landscape? Here are some July planting tips from the Dallas Arboretum horticulture staff and the Dallas County Master Gardeners that can help keep your home garden looking beautiful this Fall. Lawn and garden maintenance should be your focus in July.

  • July is the month to start your fall tomato garden.
  • Begin trimming spent flower stalks on perennials.
  • If you haven’t done so already, cut back some overgrown annuals (such as impatiens and coleus) and perennials (such as asters and salvia). A light shearing can help prevent the plants from falling over.
  • Roses can be trimmed back now by one-third to one-half so they will rejuvenate for the fall season.
  • Mature or overgrown climbing roses can be shaped up now without damaging next year’s bloom potential.
  • As it continues to heat up outside, keep your plants well watered.
  • Continue mowing your lawn once per week to maintain good healthy growth and reduce any unnecessary wear and tear on lawn equipment.
  • Continue fertilizing your lawn and garden with a high nitrogen fertilizer, following recommended application rates.
DFW-Breweries

Breweries in DFW

Cool off on a hot summer day with a cold one at a local brewery 🍺 DFW is full of breweries that are serving up handcrafted beers and even offer tours and game nights. Save this list for some July 4th fun and enjoy a cold one!
 
For more resources like this, visit our DFW resources page at republictitle.com/dfw-area-resources

ADDISON
Bitter Sisters Brewery
15103 Surveyor Blvd.
bittersistersbrewery.com

ARLINGTON
Division Brewing
506 E. Main St.
divisionbrewing.com

BEDFORD
Turning Point Beer
1307 Brown Tr.
turningpointbeer.com

CELINA
Rollertown Beerworks
412 N. Oklahoma St. #106
rollertownbeerworks.com

DALLAS

Bishop Cider
509 N. Bishop Ave.
bishopcider.com

Community Beer
3110 Commonwealth Dr.
communitybeer.com

Deep Ellum Brewing
2823 St. Louis St.
deepellumbrewing.com

Four Corners Brewing
1311 S. Ervay St.
fcbrewing.com

Manhattan Project Beer
2215 Sulpher Sr.
manhattanproject.beer

Oak Cliff Brewing
1300 S. Polk St.
oakcliffbrewing.com

Oak Highlands Brewery
10484 Brockwood Rd.
oakhighlandsbrewery.com

Outfit Brewing
7135 John W. Carpenter Fwy.
outfitbrewing.com

Pegasus City Brewery
1508 Commerce
pegasuscitybrewery.com

Peticolas Brewing
1301 Pace St.
peticolasbrewing.com

Steam Theory Brewing
340 Singleton Blvd.
steamtheorybrewing.com

Texas Ale Project
1001 N. Riverfront Blvd.
texasaleproject.com

White Rock Alehouse
7331 Gaston Ave.
whiterockalehouse.com

CARROLLTON
Three Nations Brewing
1033 Vandergrill Dr.
3nationsbrewing.com

FORT WORTH
Cowtown Brewing
1301 E. Belknap St.
cowtownbrewco.com

HopFusion Ale Works
200 E. Broadway Ave.
hopfusionaleworks.com

Martin House Brewing
220 S. Sylvania Ave.
martinhousebrewing.com

Panther Island Brewing
501 N. Main St.
pantherislandbrewing.com

Rahr & Sons
701 Galveston Ave.
rahrbrewing.com

Wild Acre Brewing
1734 E. El Paso St.
wildacrebrewing.com

GARLAND
Lakewood Brewing
2302 Executive Dr.
lakewoodbrewing.com

GRANBURY
Revolver Brewing
5650 Matlock Rd.
revolverbrewing.com

GRAPEVINE
Grapevine Craft Brewery
906 Jean St.
grapevineontap.com

KELLER
Shannon Brewing
818 N. Main St.
shannonbrewing.com

MANSFIELD
Dirty Job Brewing
117 N. Main St.
dirtyjobbrewing.com

MCKINNEY
Franconia Brewing
495 McKinney Pkwy.
franconiabrewing.com

Tupps Brewery
721 Anderson St.
tuppsbrewery.com

PLANO
Union Bear Brewing
5880 Texas 121
unionbear.com

Unlawful Assembly Brewing Co.
7800 Windrose Ave.
unlawfulassembly.com

RICHARDSON
Four Bullets Brewery
640 N. Interurban St.
fourbulletsbrewery.com

ROWLETT
Bankhead Brewing
3840 Main St.
bankheadbrewing.com

FARMERS BRANCH
Cedar Creek Brewery
13090 Bee St.
cedarcreekbrewery.com

SHERMAN
Cellerman’s Pub & Brewery
2130 Texoma Pkwy.
cellarmanspub.com

903 Brewers
1718 S. Elm St.
903brewers.com

WAXAHACHIE
Railport Brewing
405 W. Madison St.
railportbrewing.com

WILLOW PARK
Parker County Brewing
225 Shops Blvd.
parkercountybrewing.com

Staging-your-Home-to-Sell

Staging Your Home to Sell

1. Clean like you mean it!
Spring cleaning has nothing on you when you’re getting ready for a showing! A clean home suggests to the Buyer that the current owner has taken good care of the property. If you don’t have the time or have already moved, consider hiring a cleaning service. When your home is on the market, it’s important to keep everything tidy and in “show ready” condition at all times as you never know when a potential Buyer may schedule a last minute tour.

2. Clear out the clutter.
Clutter takes up space and space is what sells. You want Buyers to focus on how great your space is, not how messy it looks. Banish that pile of shoes from the entry, that stack of mail on your dresser, and all the extra small countertop appliances from the kitchen, and other areas that collect clutter. By editing down to the basics, you will make your home look bigger.

3. Go neutral.
You may love a certain bold accent wall color but bold colors can distract from a room’s assets. Repaint your rooms in neutral tones like tans, grays, and whites that allow Buyers to focus on the spaces themselves, not the color of the walls.

4. Give each room a purpose.
If you have a spare room that has been serving several purposes (or has been collecting extra stuff ), now is the time to give it a purpose. Pick a use (office, guest room, crafts room) and stage the space to showcase that purpose.

5. Let there be light!
A home’s lighting can make a big impact on a potential Buyer’s first impression of the home. Brighten up your rooms by replacing the light bulbs with daylight bulbs, open up all the windows to let in natural light (make sure those windows are sparkling clean!), and add floor or table lamps to areas that are dim. A bright,
cheery room looks bigger and more inviting.

6. Focus on fresh.
Track down any odors in your home and eliminate them. Adding in a scented plug-in or air freshener can help. Just don’t overdo it. Scents can be overwhelming and that may turn off Buyers when they step in the house. The goal is a nice, neutral, and clean smell. Keeping a dryer sheet on a new air filter is a great way to do this too!

7. Get rid of personal items.
Buyers want to be able to see themselves in your home, so remove anything overly personal, like family photos, toys, kids’ artwork, and personal collections. Don’t overlook the bathroom – clear bathroom counters of personal items,
like toothbrushes, other hygiene items, and makeup.

8. Organize your closets.
Storage space is a huge selling point. If your closets are stuffed to the brim, Buyers will think you don’t have enough of it. Give your closet some breathing room by removing items you don’t need immediately from your closet and
store the rest in the garage, attic, or in a pod/storage. Then stage your closet with just the necessities.

9. Make an entrance.
If your home’s curb appeal makes a great first impression, potential Buyers will want to see inside. Small fixes can make a huge difference. Plant some colorful flowers in your flower beds, fix any peeling paint, and keep the walkway clear. Adding a row of potted plants along the walkway or a cheerful wreath to your front door can make a big difference. Also, keep your shrubs trimmed and grass mowed the whole time your house is on the market.

10. Finish any projects.
Walk through your home as if it is the first time and make a list of all of the small projects that need finishing. Is there a cabinet that doesn’t shut quite right? Are there scuffs that need to be removed from the wall? Paint that needs touching up? Keep an eye out for areas that could use some extra TLC, then repair as necessary. Not only does this make your place look nice, it shows potential Buyers that you’ve put effort into maintaining the property.

Click here for print version

Wineries

Wineries in DFW

You had me at Merlot! Spend this upcoming weekend at one of these local wineries and unwind with a delicious glass of red wine, or white wine…or both!


For more seasonal content like this, head over to our DFW Area Resources page at: DFW Area Helpful Resources | Republic Title of Texas

AUBREY
Fortuna Hill Winery
2297 FM 2931
fortunatawinery.com

CELINA
Carmela Winery
132 N. Louisiana Dr.
carmelawinery.net

Caudalie Crest Winery
2045 Weston Rd.
goatsngrapes.com

Eden Hill Winery
4910 Eden Hill Lane
edenhill.com

DALLAS
Inwood Estate Vineyards
1350 Manufacturing, Ste. 209
inwoodwines.com

Times Ten Cellars
6324 Prospect Ave.
timestencellars.com

FORT WORTH
Cowtown Winery
112 W. Exchange Ave.
cowtownwinery.com

GRANBURY
Barking Rocks Winery & Vineyard
1919 Allen Ct.
barkingrockswine.com

GRAPEVINE
Bingham Family Vineyards
620 South Main St.
binghamfamilyvineyards.com

Cross Timbers Winery
805 N Main St.
crosstimberswinery.com

Delaney Vineyards & Winery
2000 Champagne Blvd.
delaneyvineyards.com

Grape Vine Springs Winery
409 S. Main St.
grapevinespringswinery.com

Messina Hof Grapevine Winery
201 S Main St.
messinahof.com

Sloan & Williams Winery
401 S. Main St.
sloanwilliams.com

Wine Fusion Winery
603 S. Main St., Suite 304
winefusionwinery.com

LEWISVILLE
Larue Vineyards
1491 N. Kealy Ave., Suite 55
laruevineyards.com

MCKINNEY
Landon Winery
101 N. Kentucky St.
landonwinery.com

Lone Star Wine Cellars
103 E. Virginia Street
lonestarwinecellars.com

PRINCETON
Collin Oaks Winery
6874 CR 398
collinoakswinery.com

ROCKWALL
San Martiño Winery
12512 Hwy 205 N.
sanmartinowinery.com

VALLEY VIEW
Firelight Vineyards
103 N Lee St.
firelightvineyards.com

WEATHERFORD
Thistleridge Vineyard
12700 FM Rd. 920
thistleridgeranches.com

Slide1

May 2022 DFW Area Real Estate Stats

May stats are here and we have the numbers! 

Inventory is increasing with new listings up in Collin, Dallas, Denton, and Tarrant Counties over April 2022. Average sales prices are up ranging from 14% in Dallas County to 26% in Rockwall County compared to May 2021. Average days on market across the five counties in North Texas was 18 days which is down in each county over 2021. According to the Dallas Business Journal, the DFW housing market had the largest increase in the close-to-list price ratio (average value of the sales price divided by the list price for each transaction) in the U.S. year-over-year with a close-to-list ratio of 104.7% compared to 98.4% in May 2021.

Our stats infographics include a year over year comparison and area highlights for single family homes broken down by county. We encourage you to share these infographics and video with your sphere.

For more stats information, pdfs and graphics of our stats including detailed information by county, visit the Resources section on our website at DFW Area Real Estate Statistics | Republic Title of Texas.

For the full report from the Texas A&M Real Estate Research Center, click here. For NTREIS County reports click here.

Housing-Insight-March-2022

Texas Housing Insight March 2022 Summary

Total Texas housing sales continued to grow, increasing by 3.4 percent in the first quarter. Sales were concentrated on homes priced over $300,000. The constrained inventory in the lower-priced cohort pushed the median housing prices to a record-breaking level. Despite rising mortgage rates, housing market demand remains robust, driven largely by demographics. As building material costs (notably for lumber) continued to increase, so did housing starts.

Supply1

The Residential Construction Cycle (Coincident) Index, which measures current construction levels, increased slightly for both Texas and the U.S. as construction employment, wages, and output remained elevated. Construction activity is expected to continue expanding according to the Texas Residential Construction Leading Index (RCLI). Despite increases in the interest rates, the pace of new building permits and housing starts is expected to push the new home market forward at least for the immediate future.

According to Metrostudy data, after hitting a record high in the last quarter, the supply side contracted at the earliest stage of the construction cycle in the number of new vacant developed lots (VDLs). Despite a 26.3 percent elevation in San Antonio’s lot development, the depressed activity in DFW and Houston outweighed the gain. The contraction was most notable in lots priced between $200,000 and $299,000 for both metros, and DFW accounted for most of the quarterly loss due to reduced investment across all price cohorts, except in lots priced above $500,000.

Quarterly growth in single-family construction permits remained steady, hiking to 10.4 percent quarter over quarter (QOQ). All metros posted positive seasonally adjusted growth. Houston and DFW were standouts not only in Texas but also compared with other metros nationwide. Austin edged out San Antonio building permit output with 6,000 permits. Texas’ multifamily sector registered a moderate expansion with 15.06 percent QOQ increase as issuance shifted from two to four units to five or more units.

In 1Q2022, lumber prices continued the latest wave of rises, hiking steeply at 34 percent. In spite of the lumber price disruption for new home construction, total Texas housing starts still grew by a narrow margin of 1.7 percent. Among the 36,000 homes that broke ground in the Texas Triangle, 80 percent were appraised at over $300K. Moreover, Dallas had the most growth in housing starts ($500K+), followed by Austin and Houston ($400K-$499K), and San Antonio ($300K-$399K).  

Single-family private construction values increased 7.8 percent QOQ in real terms as the metric trended upward in Texas’ major metros. Houston’s average total cost for building construction surpassed Dallas’ in September 2021, and since then it had been the highest among all the Texas metros. Austin registered a sharp increase of 19.2 percent, while the other metros advanced incrementally.

The number of homes added to the Texas Multiple Listing Services expanded in March with 9,700 listings. Despite this inventory expansion, compared with 1.2 months in 2021Q4, Texas’ months of inventory (MOI) still deflated due to fast turnovers. Homes priced in the $200s had the tightest inventory at 0.8 months for the first quarter.

Both Austin and DFW remained below one month’s inventory, at 0.5 and 0.8 months, respectively. Houston and San Antonio trailed slightly above the one-month mark, at 1.1 and 1.2 months respectively. Inventory levels in each of the big four metros continued to drop over the latest quarter with the exception of DFW, which may have bottomed out.

Demand

While the national demand for housing declined marginally, demand in Texas accelerated, elevating the state total housing sales by 3.4 percent QOQ to 110,737 closed listings. Sales for homes priced above $500,000 continued climbing at an impressive rate, and the luxury home market share jumped to 24 percent with almost as many sales as homes priced from $200,000 to $299,999.

Total quarterly sales expanded in Texas largely due to massive growth in Houston, over 10 percent QOQ. San Antonio grew at a more modest rate of 2.7 percent, while both Austin and DFW contracted. Statewide existing-home sales shrunk for the first quarter, but new-home sales grew enough to push overall sales into positive territory.

Active listings in the existing-home market plummeted, maintaining supply constraints. Active listings of new homes also fell during the first quarter. Houston led the boost in new-home sales with an average of 9,355 closed listings per month, expanding 9.7 percent QOQ. Austin and San Antonio increased marginally with 3,095 and 3,552 closed listings, respectively. New-home sales in DFW decelerated in 1Q2022 after a positive run that started last summer. They tumbled across all price cohorts except $500,000+ homes, most of which were in Dallas.

While the homeownership rate for the South was 67.4 percent, the U.S. Census Bureau announced the Texas homeownership rate ticked down 1.1 percentage points to 62.8 percent. Metro-level homeownership rates fell slightly except in San Antonio, where they rebounded 1.54 percent.

Texas’ average days on market (DOM) elevated to 33 days, demonstrating that, while the housing market is still hot, some signs of weakness are emerging. Austin’s DOM gained a day over the previous quarter, averaging 22 days in Q1, while homes sold after an average of 24 and 25 days in Dallas and Fort Worth, respectively. Houston’s metric gained 4.9 percent QOQ, staying above the state average at 35 days. San Antonio fell to 31.4 days. As supply has begun rising to meet demand, DOM has increased QOQ, signifying a slow return to a healthy market. 

The Federal Reserve is expected to reduce its balance sheet assets and increase the Federal Funds rate several more times by the end of the year. The ten-year U.S. Treasury bond yield2 rose from 1.5 percent last December to 2.1 percent this March, soaring by at least 60 basis points with much volatility along the way. Furthermore, the Federal Home Loan Mortgage Corporation’s 30-year fixed-rate skyrocketed by 4.2 percent in March 2022, rising firmly from a record low of 2.7 percent in January 2021. Responding to these increased property interests, Texas’ home-refinance applications declined 10.8 percent in the past month, and the metric shrunk 54.8 percent from a year ago. Home-purchase applications, on the other hand, showed strong growth in 2022, albeit diminishing 8 percent from a year ago.

Millennials emerged as a big force of the mortgage applications as many reached 32 years old—the median age for first-time buyers. Though the increased mortgage rates could cool the homebuying frenzy and depress the housing boom, the need for larger family homes as well as for home office space persists, and housing demand remains robust. For a typical Texas mortgagee, the median mortgage rates in March climbed to 3.6 percent for non-GSE loans and 4.1 for GSE loans, respectively. The rates for both loans shot up by about 30 percent from a year ago. Under the pressure of rising interest rates, the original loan balance that constituted the “typical” Texas conventional home loan dropped $222 million in a year to $314 million. Despite the big drop in loan values, the debt-to-income ratio (DTI) rose from 35.3 to 35.6 percent, leaving housing affordability a long-lasting constraint.

Prices

Texas’ median home price rose for the 15th consecutive month, increasing 4.9 percent QOQ to a record-breaking $335,000 in March. The ongoing compositional sales shift toward higher-priced homes contributed to a higher median price. The growing share of higher-priced homes in Austin has increased the median price of homes sold to a new high of $520,000, up 8.9 percent QOQ. The Dallas metric ($416,000) gained 7.4 percent, while the quarterly price growth in Fort Worth ($352,000) elevated 5.9 percent. Houston’s ($330,000) and San Antonio’s ($322,000) metrics rose 4.8 and 4.1 percent, respectively.

The Texas Repeat Sales Home Price Index accounts for compositional price effects and corroborated substantial home-price appreciation as the index hovered near a series maximum, gaining 20 percent YOY. Austin led price growth with almost 30 percent YOY growth. Despite its elevated growth rate, the pace has gradually slowed closer to levels observed in the other major Texas metros. Annual home-price appreciation is at 28 and 25 percent in Dallas and Fort Worth, respectively. San Antonio posted a 20 percent annual hike followed by Houston with 15 percent growth. Rapid price growth outpaced wage gains, adding additional pressure to housing affordability.

Household Pulse Survey

According to the U.S. Census Bureau’s Household Pulse Survey, the share of Texas homeowners behind on their mortgage payments jumped 3 percentage points to 7 percent (Table 1). Houston areas mirrored the statewide average, where the behind-the-payment share increased 2 percent points, while DFW area was unchanged at 4 percent. The share of Texas respondents who were somewhat likely to leave their houses in the next two months due to foreclosure shrunk by 20 percent to 5 percent, much lower than the national rate of 13 percent (Table 2).

________________

1 All measurements are calculated using seasonally adjusted data, and percentage changes are calculated month over month, unless stated otherwise.
2 Bond and mortgage interest rates are nonseasonally adjusted. Loan-to-value ratios, debt-to-income ratios, and the credit score component are also nonseasonally adjusted.

Source – Joshua Roberson, Weiling Yan, and John Shaunfield (June 9, 2022)

https://www.recenter.tamu.edu/articles/technical-report/Texas-Housing-Insight

What-is-a-Title-Policy

What Is A Title Policy

A title insurance policy is an insurance policy that insures you against liens or other claims against your property.  Unlike other types of insurance, you pay the premium one time and the policy generally insures you for as long as you own the property.  In Texas, Title Insurance rates are regulated by the Texas Department of Insurance and the rate is based on the amount of coverage provided by the policy. There are two basic types of title insurance, an owner’s title policy and a loan title policy.  Most financial lenders require a loan title policy as security for their investment in your property just as they require homeowners insurance or other types of coverage for their protection.  Owner’s title insurance lets the new homeowner feel safe and confident there are no other claims as to the ownership of the insured property.  Among other matters, it ensures access to the property, gives the homeowner the right to occupy the property, and provides indefeasible title. 

For more information, go to Blog for videos like this and other helpful information. Blog | REPUBLIC TITLE

June-Landscape-Tips

June Landscape & Gardening Tips & To-Dos

Need help planting a successful garden or landscape? Here are some June planting tips from the Dallas Arboretum horticulture staff and the Dallas County Master Gardeners that can help keep your home garden looking beautiful this Summer. Heat tolerant plant care should be your focus in June.

  • Plant summer annuals and tropicals. Don’t forget to water them in after planting and keep them watered regularly during the summer heat.
  • Begin cutting back any overgrown perennials and annuals to keep growth compact.
  • Continue mowing your lawn once per week to maintain good healthy growth and reduce any unnecessary wear and tear on lawn equipment.
  • Continue fertilizing your lawn and garden with a high nitrogen fertilizer, following recommended application rates.
Housing-Insight-February-2022-Summary

Texas Housing Insight February 2022 Summary

Texas’ housing market fell slightly in February as supply constraints continued pushing downward on the market, and mortgage rates increased. February sales and active listings were both down, resulting in an inventory level of about one month. Housing starts rose despite the continued surge in building material prices and dip in permits. The greatest challenge remains for homes in the lower price cohorts, as supply still has not caught up to the unprecedented demand. The state’s diverse and expanding economy, favorable business policies, and steady population growth, however, support a favorable outlook.

Supply1

The Texas Residential Construction Cycle (Coincident) Index, which measures current construction activity, increased both nationally and within Texas as employment exceeded the pre-pandemic level, and construction values accelerated. The Texas Residential Construction Leading Index (RCLI) advanced, signaling an expected elevation in future activity. The most influential metric in the leading index was the rise in residential construction value among new construction starts.

Single-family construction permits contracted half a percent seasonally adjusted for February, lagging the national increase of 3.9 percent month over month (MOM). Austin and Dallas-Fort Worth permit activity fell 10.7 and 0.3 percent, respectively. Houston and San Antonio, on the other hand, increased 9.1 and 2.4 percent, respectively. Houston’s permit growth rate topped the national list, issuing 5,316 permits, while Dallas followed with 4,091.

Lumber prices rose 11.4 percent in a month and were up 78.3 percent year over year (YOY), drastically raising the costs associated with home building. Despite the lumber market disruption, robust economic conditions and copious demand pushed total Texas housing starts up for the fourth consecutive month, soaring 11.3 percent MOM. However, single-family private construction values subsided 0.7 percent MOM. Austin accounted for the majority of the loss with a 23.4 percent dip from the previous month, while San Antonio had a 0.1 percent decrease. Dallas-Fort Worth was unchanged, and Houston posted an 8.3 percent hike.

Texas’ months of inventory (MOI) remained one-month in February while the U.S. had 2.5 months of inventory for the same period, accentuating how intense housing demand is in Texas. Supply continued to be an issue across all price categories but especially for homes in the lowest price range. Total housing inventory is still tight in Texas’ four biggest metros. Both Austin and DFW remained below one month while Houston and San Antonio were slightly above.

Demand

Texas home sales were down from January, ending February slightly above 28,000. Sales fell in each of the four major Texas metros except San Antonio, where sales grew by almost 1 percent. February sales were negatively impacted by rising mortgage rates and higher home prices that continue to shut out some potential homebuyers.

The Federal Reserve is expected to reduce its balance sheet assets and increase the Federal Funds rate at least two to four times in 2022. The ten-year U.S. Treasury bond yield rose to 1.8 percent2, up 0.3 percent from the previous month. The Federal Home Loan Mortgage Corporation’s 30-year fixed-rate hovered around 3.5 percent, rising 0.4 percent over the previous month. The median mortgage rate for the typical Texas homebuyer climbed to 3.5 percent for government sponsored enterprise (GSE) loans in January3 and to 3.2 percent for non-GSE loans. February home-purchase applications inched up by 3.1 percent year to date (YTD), while refinance activities declined by 23.4 percent. (For more information, see Finding a Representative Interest Rate for the Typical Texas Mortgagee). 

In January, the median loan-to-value (LTV) constituting the “typical” Texas conventional-loan mortgage dropped from 87.7 a year ago to 83.8. The debt-to-income ratio (DTI) stayed unchanged from a year ago at 36.4 YOY, while the median credit score increased 8.7 points to 752.8 over the same period. The LTV for GSE borrowers stayed constant from December through January at 85.5; meanwhile, their DTI increased slightly from 36.8 to 37.3.

Prices

Texas’ median home price continued to increase, consistently growing since the start of the pandemic. Austin remains at the top with half the homes selling for almost $500,000. DFW is a distant second with a median home price around $375,000. Median prices for both Houston and San Antonio hovered slightly above $300,000.

The Texas Repeat Sales Home Price Index accounts for compositional price effects and provides a better measure of changes in single-family home values. The Texas index has risen 31.7 percent since the pandemic started. Texas home prices were up 1.24 percent MOM, escalating for the 21st consecutive month. While growth in all other metros accelerated at a steady pace, Austin’s explosive growth has slowed since last summer. In summary, Texas’ overall increasing home prices decreased its affordability advantage over states like California.

At the metropolitan level, Austin’s repeat sales home price index value surpassed all other metros with 29.1 percent YOY growth. Corroborating with the growth rate of median prices, Dallas followed with a 28 percent YOY expansion. Fort Worth and San Antonio’s indexes rose 23.3 and 19.7 percent, respectively. Houston followed with a 16.9 percent gain.

Household Pulse Survey

According to the U.S. Census Bureau’s Household Pulse Survey, the share of homeowners unable to make next month’s mortgage payment increased on a state level. Over 8.6 percent were “not at all confident” or only “slightly confident” they’d be able to make payments. The national average was just over 7.1 percent (Table 1). The number of Texas mortgage owners facing foreclosure increased (Table 2). However, the share of respondents who reported themselves as “not likely at all” to lose their house due to foreclosure also increased, inching up 1 percent to 43 percent. This is marginally above the national average of 42.9 percent (Table 2).

________________

1 All measurements are calculated using seasonally adjusted data, and percentage changes are calculated month over month, unless stated otherwise.
2 Bond and mortgage interest rates are nonseasonally adjusted. Loan-to-value ratios, debt-to-income ratios, and the credit score component are also nonseasonally adjusted.
3 The release of Texas mortgage rate data typically lags the Texas Housing Insight by one month.

Source – Joshua Roberson, Weiling Yan, and John Shaunfield (May 31, 2022)

https://www.recenter.tamu.edu/articles/technical-report/Texas-Housing-Insight

April 2022 DFW Area Real Estate Stats

April stats are here and we have the numbers! 

The housing market in North Texas continues to be hot! New listings are up consistently in all five counties over March 2022 as the Spring market continues to heat up. Despite higher mortgage rates, demand remains strong in North Texas. Average sales prices are up ranging from 16% in Dallas County to 35% in Rockwall County compared to April 2021.

Our stats infographics include a year over year comparison and area highlights for single family homes broken down by county. We encourage you to share these infographics and video with your sphere.

For more stats information, pdfs and graphics of our stats including detailed information by county, visit the Resources section on our website at DFW Area Real Estate Statistics | Republic Title of Texas.

For the full report from the Texas A&M Real Estate Research Center, click here. For NTREIS County reports click here.