February

February Landscape & Gardening Tips & To-Dos

Need help planting a successful garden or landscape? Here are some February planting tips from the Dallas Arboretum horticulture staff and the Dallas County Master Gardeners that can help keep your home garden looking beautiful this winter, whilst having it ready and set up for success in Spring! Plant care should be your focus in February. 

  • Plant winter annuals such as pansies, dianthus, snapdragons and chard on warmer days.
  • Sow seeds for spring annuals and veggies, inside, per instructions based on the last frost date for your area. Remember they need full sun and temperatures around 65 to 70 degrees (watch out for cold window sills!).
  • Divide and replant summer and fall blooming perennials while they are still dormant.
  • Plant or relocate native and cold hardy trees and shrubs while they are dormant. It is also the perfect time to perform any tree trimming.
  • Start pruning roses. A good rule of thumb is to prune them by Valentine’s Day. Climbing roses won’t need any trimming until after they bloom in spring.
  • Mulch flower beds before the weather warms up and weeds begin to sprout.
  • Fertilize winter annuals throughout the winter and continue into spring. Use a complete, water soluble fertilizer to help them get established while it’s still cold.
2021 DFW Real Estate Stats-at-a-glance

2021 DFW Real Estate Year-End Stats at a Glance

We’ve taken our monthly stats-at-a-glance reports from January through December of 2021, totaled, averaged, and compared the data to the numbers from 2020. The result is an annual report of the DFW area real estate market in 2021. The annual totals reiterate the lack of inventory we saw in 2021, indicating a very strong seller’s market. This drove up lists prices by an average of 20% across the five counties reported on, for an average list price of just over $442k. While list prices steadily rose as the year progressed, so did average price per square foot, averaging $187 in the five counties. It sure will be interesting to see how 2022 plays out!

For more stats information, pdfs and graphics of our stats including detailed information by MLS area and condo stats, visit the Resources section on our website at DFW Area Real Estate Statistics | Republic Title of Texas.

December 2021 Stats Blog Header

December 2021 DFW Area Real Estate Stats

December 2021 stats are here and we have the numbers! Let’s see how the DFW real estate market ending 2021. Active listing fell slightly from November, but that is to be expected over the holiday season. As expected due to the lack of inventory, the overall number of sales is down in all counties while the days on market continues to drop. Not surprisingly, the price per square foot in the metroplex continues to rise in all five counties with Collin County seeing the biggest increase up 33% over last year, followed by Denton county at 26%.

Our stats infographics include a year over year comparison and area highlights for single family homes and condos broken down by MLS area. We encourage you to share these infographics and video with your sphere.

For more stats information, pdfs and graphics of our stats including detailed information by MLS area and condo stats, visit the Resources section on our website at DFW Area Real Estate Statistics | Republic Title of Texas

For the full report from the Texas A&M Real Estate Research Center, click here. For NTREIS County reports click here.

January-Landscape-&-Gardening

January Landscape & Gardening Tips & To-dos

Need help planting a successful garden or landscape? Here are some January planting tips from the Dallas Arboretum horticulture staff and the Dallas County Master Gardeners that can help keep your home garden looking beautiful this winter, whilst having it ready and set up for success in Spring.

January’s focus is prep! Decide what plants need to be replaced or moved this month and create a wallet list of plants to watch for as you begin to peruse the nurseries in preparation spring.

Planting:
– Plant annual color in beds and containers during days with warmer temperatures. Fertilize annuals regularly with a complete, water soluble fertilizer.
– Continue to plant new shade trees, fruit trees, and evergreen shrubs. Mulch root areas
– Continue to transplant established trees and shrubs while they are dormant.
– Finish planting pre-chilled tulip and hyacinth bulbs if you did not do so in December.
– Plant any bare-root plants including fruit and nut trees as well as roses.
– Continue planting pansies, snapdragons, kale, Swiss chard and other cool season annuals. Plant onion transplants anytime soil is ready. Plant spinach and snap peas mid to late month.
– Sow seeds in flats or containers to get a jump on the season. Petunias, begonias and impatiens can be started now.
– Tomatoes, peppers and beans can be started in late January into mid-February indoors, in a hot bed or heated greenhouse.
– Spring blooming bulbs can still be planted until mid-January in order to give them enough time to establish roots and bloom.

Pruning:

– Prune with a purpose. Do not “top” any trees or shrubs including crape myrtles. Never leave stubs. Cut flush against remaining branches on shrubs and along the branch collar on trees. Peach and plum trees should be pruned to encourage horizontal branching, remove any strongly vertical shoots.
– Continue to prune evergreen trees such as magnolias, live oaks, and wax myrtles to minimize possible ice damage.
– Re-shape evergreen shrubs and shade trees, as needed, during the winter dormant period.

Plant Care:

– Mulch new plantings to help retain moisture and insulate roots against cold temperatures.
– Keep frost cloth handy to cover any tender annuals, perennials or new plantings since January is usually the coldest month in North Texas.
– Check houseplants for insect pests such as scale, mealy bugs, and spider mites.
– Continue to mulch leaves from the lawn and remove debris from turf areas to reduce disease and insect problems.
– Continue to water lawn once every three weeks or so, if you have not had at least 1” of supplemental rain.
– Watch for scale insects on camellias, hollies, and euonymus.
– Water outdoor landscape plants, as needed, when the soil is dry. Water plants thoroughly before a hard freeze to reduce chances of freeze damage.
– Fertilize pansies and other winter annuals about once a month throughout the winter.
– Protect tender plants from hard freezes.
– Till and prepare new planting beds when soil is workable. Work in organic material. Add compost and mulch to all beds.
– Recycle your Christmas trees. Contact your city’s waste disposal department for sites. Know your soil by getting a soil test through Texas A&M.

Planning:
– Plan your early spring vegetable garden. Sow seeds for spring annuals and veggies, inside, per instructions based on the last frost date for your area. They need full sun and temperatures around 65 to 70 degrees (watch out for cold window sills!).

Mapping-Tools-in-Matrix-

NTREIS Phasing Out Areas and Subareas

Over the next few months NTREIS users will be experiencing the phasing out of areas and subareas. NTREIS is rebuilding the Matrix system to be in compliance with the Real Estate Standards Organization (RESO) data dictionary. Through this process, the area/subarea fields will not be included. The decision was made over two years ago to remove areas and subareas. The reasons for doing so are many:

  • Area boundaries are subjective; some are school boundaries which change, others are neighborhood or street boundaries.
  • Area identifiers are not useful to consumers.
  • The vendor that updated the geo boundaries for our area maps is no longer available for that service.
  • Subjective area boundaries can be likened to the “redlining” maps of old and any suggestion of discriminatory steering has no place in the future of this industry.

NTREIS has been encouraging the use of the digital mapping layers and custom shapes for searches—consumers have become comfortable with digital mapping and agents should use the same tools their customers use. However, many of NTREIS statistics were based on area identifiers and they are embedded in several tools, so it has been a long processes to get to the point where they can be phased out.

The steps to be taken over the next 60-90 days are:

  • Texas A&M has been using other geo identifier in working with statistics for the Texas REALTORS® Data Relevance Project.
  • The area breakdowns will be removed from the NTREIS statistical reporting.
  • NTREIS Trends will be removing the Area criteria option for creating reports.
  • Area/Subarea fields are being removed from IDX data feeds and we are working with those vendors for Broker tools.
  • Any remaining NTREIS products that use Areas in search criteria are in the process of removing those.
  • Notifications to users will be sent out notifying them that they need to remove that search criteria from saved searches.
  • Area/Subarea will be removed from the Realist auto-pop.
  • Area/Subarea will be removed from the input screen and displays.

Make sure to join Annette Carvalho-Jordan, VP/Real Estate Technology Trainer, for our Mapping Tools in Matrix class on January 12th. In this class, we will explore all the map tool functions in Matrix so you can create powerful searches for your clients who want to live in specific neighborhoods, near points of interest or certain distances to where they work.

Courtesy of MetroTex Association of Realtors

Housing-Insight-October-2021

Texas Housing Insight October 2021

Texas housing sales slowed in October but trended upward amid continued supply constraints. Along with higher mortgage interest rates, double-digit home-price appreciation chipped away at housing affordability. Elevated demand persisted as homes averaged roughly one month on the market. On the supply side, single-family housing permits increased for the second consecutive month, but housing starts declined as lumber and other input material prices rose. The relatively low level of inventory available for sale is the greatest challenge to Texas’ housing market. The state’s diverse and expanding economy, favorable business policies, and steady population growth, however, support a favorable outlook.

Supply1

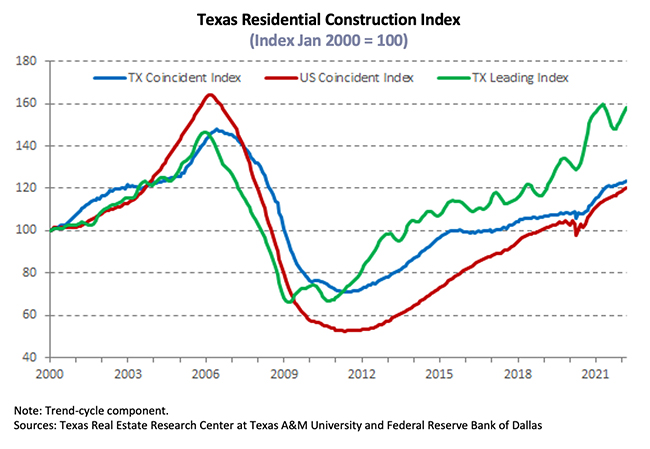
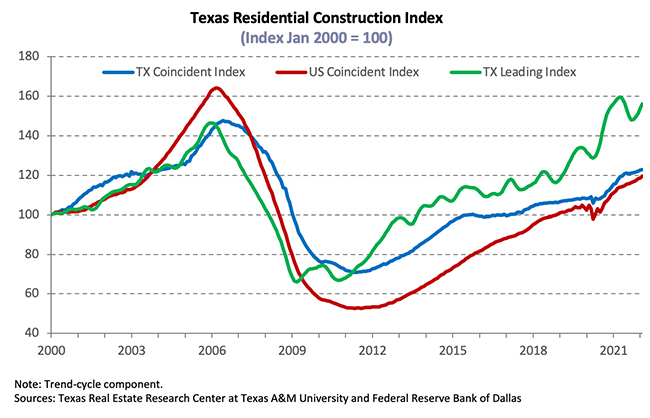
The Texas Residential Construction Cycle (Coincident) Index, which measures current construction activity, flattened nationally and within Texas due to decreased construction values despite employment and wage gains during October. The Texas Residential Construction Leading Index ticked down as weighted building permits decreased, signaling a potential slowdown in future activity. Among the major metros, weighted building permits and residential starts increased, except in Dallas-Fort Worth (DFW), where there was a decrease in both metrics. Inflationary pressures, however, tempered economic expectations and may slow construction activity in coming months.

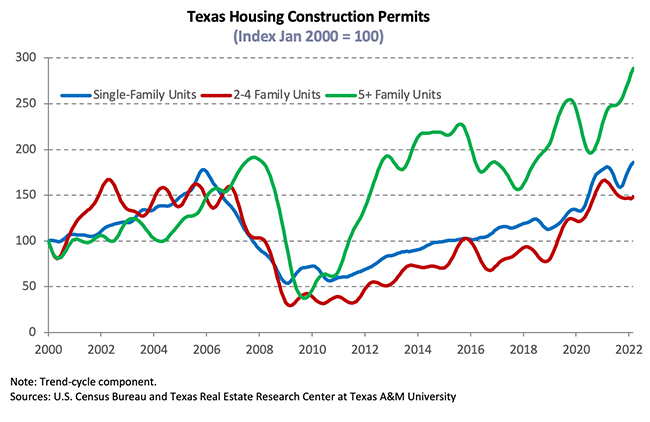
Single-family construction permits accelerated 4.5 percent in October, increasing for a second straight month. Houston topped the national list for seven consecutive months with 3,887 nonseasonally adjusted permits after registering a healthy seasonally adjusted increase. DFW ranked second on the national list and posted a double-digit monthly expansion to 3,523 permits. Meanwhile, Austin and San Antonio issued 1,480 and 872 permits, respectively. On the other hand, Texas’ multifamily sector registered incremental growth as issuance shifted from two-to-four units to five-or-more units. The metric ticked up just 0.7 percent on a monthly basis but elevated 12.3 percent year to date (YTD) relative to the same period last year.

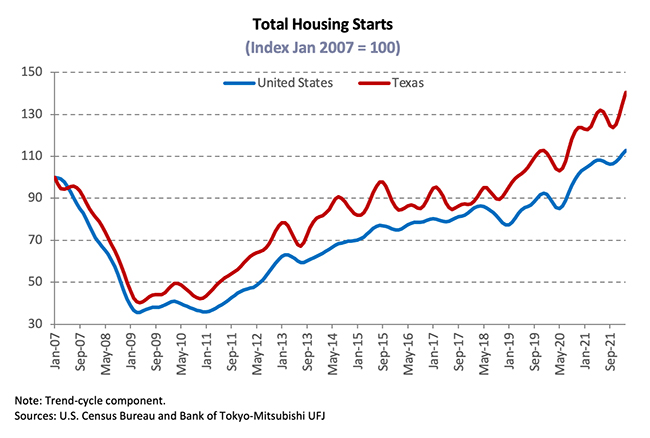
Despite strengthening economic conditions and ample housing demand, total Texas housing starts declined as lumber prices increased 17.9 percent in October. Single-family private construction values, however, increased slightly in real terms, but the metric continued to trend downward in Texas’ major metros. The majority of the statewide growth was attributed to the elevation in Austin and DFW values.

Texas’ months of inventory (MOI) normalized at 1.6 months as sales activity and new listings slowed. A total MOI around six months is considered a balanced housing market. Supply remained relatively constant across all price cohorts except in the upper and lower extremes. For example, inventory tightened for homes priced less than $300,000 and for luxury homes (those priced more than $500,000), diminishing to 1.2 and 2.5 months, respectively.

Inventory in the major metros decreased slightly in October, except in Houston, where MOI flattened at 1.7 months. Supply remained the most constrained in Austin at 0.9 months, while San Antonio’s MOI lowered to 1.7 months. North Texas’ metric declined at the largest rate, falling to 1.1 and 1.2 months in Dallas and Fort Worth, respectively. Depleted inventory remains a major headwind to the health of Texas’ housing market.

Demand

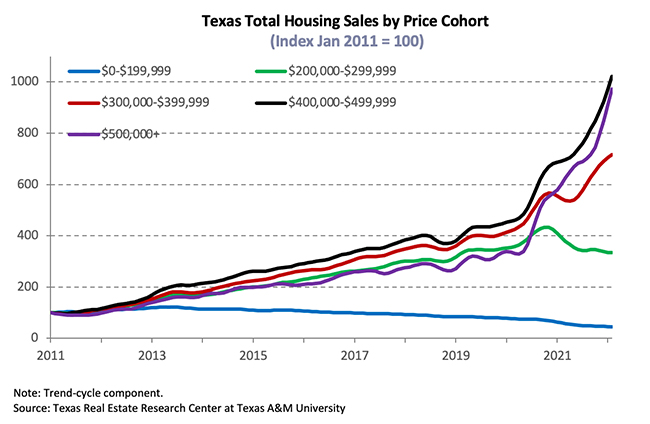
Total housing sales flattened in October, dipping 0.3 percent amid rising mortgage interest rates and dwindling inventory. The slowdown was attributed to historically low activity for homes priced less than $200,000. On the other hand, the number of homes sold priced between $400,000 and $499,999 reached an all-time high. Reduced transactions at the lower end of the price spectrum slightly outweighed the uptick in the higher price ranges.

Housing sales decreased in all metro areas except for in Dallas. San Antonio reflected statewide fluctuations across the price spectrum as total sales declined 1.5 percent. In Houston, the metric dropped 0.9 percent, while activity in Austin contracted 3.2 percent. Sales in North Texas slowed overall, decreasing 3.4 percent in Fort Worth. However, transactions in Dallas increased 1.9 percent due to strong gains for homes priced between $200,000 and $299,999.

Texas’ average days on market (DOM) rose marginally to 32 days, confirming robust demand and attributing sales decrease to limited inventory. Austin’s DOM improved by one day, averaging 19 days, while North Texas’ metric also increased, selling after an average of 23 days in Fort Worth and 27 days in Dallas. San Antonio’s and Houston’s metrics registered narrow gains, matching the statewide average of 32 days in both metros.

With monetary policy possibly normalizing, starting with the Federal Reserve Bank’s tapering of bond purchases, economic growth forecasts for the coming years point to a slow return to the long-run structural trend as the initial and strongest stage of recovery likely reached its peak. It’s becoming clearer that inflation pressures will be permanent. The ten-year U.S. Treasury bond yield ticked up for the second consecutive month to 1.6 percent2, while the Federal Home Loan Mortgage Corporation’s 30-year fixed-rate elevated to 3.1 percent. The median mortgage rate for the typical Texas homebuyer remained constant at 3.1 percent for GSE loans in September3 and ticked down ten basis points to 2.9 percent for non-GSE loans. Although mortgage interest rates rose over the past two months, Texas home-purchase applications increased in October but fell 6.5 percent YTD. Meanwhile, refinance applications declined on a monthly basis and were down 24.6 percent since December 2020. Year-over-year (YOY) purchase and refinance applications diminished 9.8 and 10 percent, respectively, largely due to baseline effects after a surge of remodeling and refinancing in 2020. Increasing rates, lenders adding more requisites, and the shrinking pool of households able to refinance are likely impacting refinance activity as well. (For more information, see “Finding a Representative Interest Rate for the Typical Texas Mortgagee“.

In September, the median loan-to-value ratio (LTV) constituting the “typical“ Texas conventional-loan mortgage dropped from 87.8 a year earlier to 84.5. The debt-to-income ratio (DTI) elevated from 35.4 to 36.4, while the median credit score increased ten points to 749 over the same period. The LTV GSE borrowers decreased from 85.4 last September to 85.9; however, DTI grew from 35.4 to 36.4. Overall improved credit profiles reflected the fact that only the most qualified housing applicants were able to outbid their competition for their desired homes amid exceptionally tight inventories and robust demand.

Prices

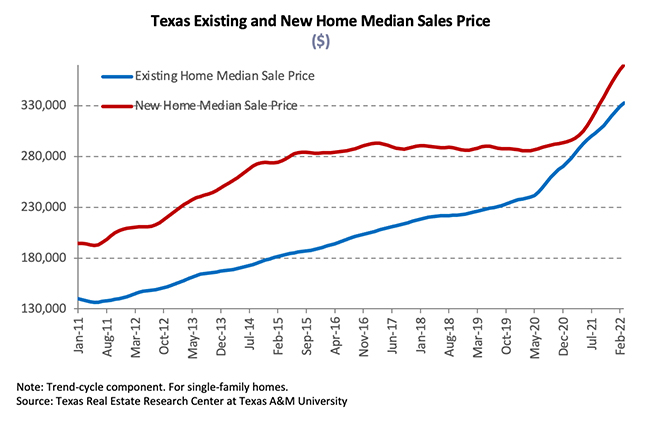
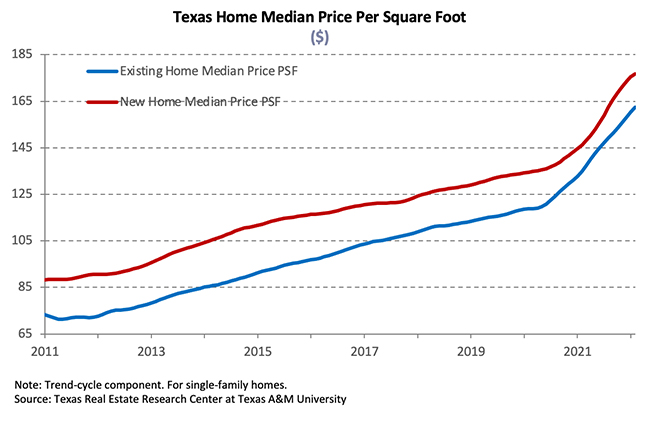
Average home prices were boosted by the ongoing shift in the composition of sales toward higher-priced homes due to constrained inventories at the lower end of the market. The Texas median home price rose for the tenth consecutive month, appreciating 1.4 percent on a monthly basis and 15.5 percent YOY to a record-breaking $312,700 in October. The share of luxury homes sold in Austin continued to expand, contributing to the 24.4 percent YOY surge in the median price ($453,600). The Dallas metric ($383,100) increased 17.6 percent, while annual price growth in Fort Worth ($319,600) shot up to 18.2 percent. Houston’s ($309,100) and San Antonio’s ($303,000) metrics elevated 15.1 and 18.4 percent, respectively.

The Texas Repeat Sales Home Price Index accounts for compositional price effects and provides a better measure of changes in single-family home values. Texas’ index corroborated significant home-price appreciation, accelerating 18.6 percent YOY. The repeat sales index also accelerated in the major metros, except in Austin and Houston, as annual price growth reached recent peaks. The metric dipped to 35.1 percent in Austin, followed by Dallas and Fort Worth with 24.1 and 22 percent home-price appreciation, respectively. San Antonio posted an 18.4 percent annual hike, while Houston’s index decelerated to 14.6 percent. Increasing home prices pressured housing affordability, particularly in an environment of low real wage growth.

Single-Family Forecast

The Texas Real Estate Research Center projected single-family housing sales using monthly pending listings from the preceding period (Table 1). Only one month in advance was projected due to uncertainty surrounding the COVID-19 pandemic and the availability of reliable and timely data. Texas sales are expected to recover 2.7 percent in November after October’s decline. The metric is estimated to rebound 2.5 and 2.4 percent in Austin and Houston, respectively, with additional increases of 4.9 percent in DFW. Transactions in San Antonio, however, are forecasted to slow further to -3.6 percent. Sales through November 2021 should accelerate relative to the same period in 2020. On the supply side, inventories reached a trough in May 2021 and should improve in the coming months. Listings seemed to reach a trough in May and are rising, easing some of the price pressures amid a rise in new and pending listings. (For more information, see 2021 Mid-Year Texas Housing & Economic Outlook).

Household Pulse Survey

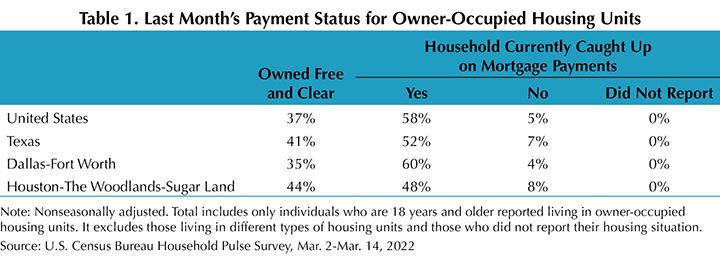
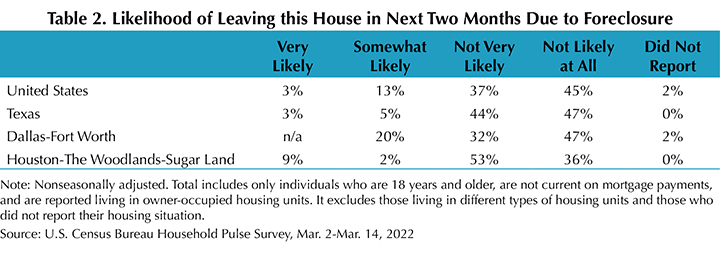
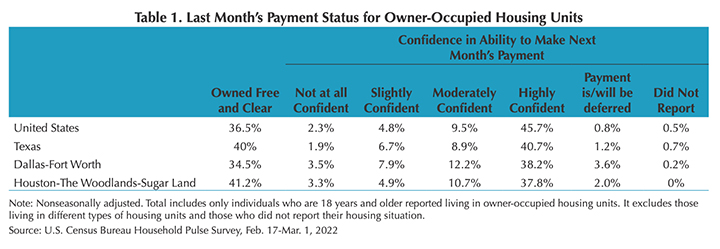
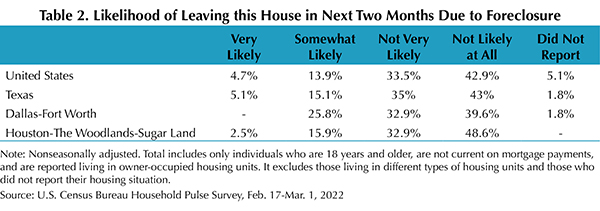
According to the U.S. Census Bureau’s Household Pulse Survey, the share of homeowners behind on their mortgage payments increased to 6 percent nationally and 9 percent in Texas (Table 2). Houston and DFW hovered above the national average at 13 and 8 percent, respectively. The share of Texas respondents who were not current and expected foreclosure to be either very likely or somewhat likely in the next two months declined from 27 percent in September to 14 percent in October (Table 3). The proportion of delinquent individuals at risk of foreclosure fell in North Texas, decreasing from 20 to 18 percent, and declining 28 percentage points to 16 percent in Houston. The Federal Housing Finance Agency’s foreclosure and REO eviction moratoria for properties owned by Fannie Mae and Freddie Mac (the Enterprises) expired Sept. 30, 2021. Continued stability in the housing market is essential to Texas’ economic recovery.
________________

1 All measurements are calculated using seasonally adjusted data, and percentage changes are calculated month over month, unless stated otherwise.

2 Bond and mortgage interest rates are nonseasonally adjusted. Loan-to-value ratios, debt-to-income ratios, and the credit score component are also nonseasonally adjusted.

3 The release of Texas mortgage rate data typically lag the Texas Housing Insight by one month.

Source – Luis B. Torres, Wesley Miller, Jacob Straus, and Brendan Harrison (Jan 5, 2022)

https://www.recenter.tamu.edu/articles/technical-report/Texas-Housing-Insight

November 2021 Stats Blog Header

November 2021 DFW Area Real Estate Stats

November 2021 North Texas real estate stats are out and we’ve got the numbers! Our stats infographics include a year over year comparison and area highlights for single family homes and condos broken down by MLS area. We encourage you to share these infographics and video with your sphere.

For more stats information, pdfs and graphics of our stats including detailed information by MLS area and condo stats, visit the Resources section on our website at DFW Area Real Estate Statistics | Republic Title of Texas

For the full report from the Texas A&M Real Estate Research Center, click here. For NTREIS County reports click here.

Homestead-changes-January-2022

Important Homestead Exemption Changes Effective January 1st

Homestead Exemption Filing Changes

Effective January 1, 2022, a Buyer may file for a homestead exemption immediately after closing if the Seller did not have a homestead exemption on the property for the current tax year.

For more important tax exemption information for new homeowners, please read below or download our Tax Exemption Resource. 

Important Tax Exemption Information for New Homeowners

  1. Exemptions are a form of tax relief that can reduce the taxable value of your property.
    Types of exemptions include:
    • Homestead
    • Over 65 years of age
    • Disabled individual
    • Disabled veteran
    • Agricultural
  2. If you own and occupy your new home, it is your homestead and you likely qualify for a homestead exemption. This is the most common type of tax exemption.
  3. When submitting an application for exemptions, you must submit a copy of your driver’s license. The address on your license must match the property address of the property you are filing the exemption for.
  4. To apply for an exemption, the homeowner, in most cases, must be occupying the property as their homestead on January 1st of the tax year in which the exemption is granted. It may be possible to apply for an exemption sooner. Please reach out to your county appraisal district to confirm the date that you may apply.
  5. It is free to file exemptions. The forms can be downloaded on the Central Appraisal District’s website for the county in which the property is located. 
Housing-Insight-Sept-2021

Texas Housing Insight – September 2021 Summary

Total Texas housing sales ticked up 0.9 percent during the third quarter as inventories remained relatively low in September. Most of the quarterly increase can be attributed to accelerated activity for existing homes priced above $300,000, offsetting the decline in new-home sales and reduced transactions in the lower price ranges. Texas’ homeownership rate decreased amid reduced housing affordability. Overall, housing demand remained healthy but was hindered by depleted inventories, pushing annual median home-price growth well into double-digit territory. Despite low levels of inventory, supply-side indicators declined compared with year-ago measures as supply chain issues persist.

Supply1

The Residential Construction Cycle (Coincident) Index, which measures current construction levels, decreased nationally but increased slightly for Texas as improvements in industry wages and employment outweighed depressed construction values. Construction activity is expected to slow in coming months as indicated by the Texas Residential Construction Leading Index (RCLI), which fell amid lower weighted building permits and housing starts, while the ten-year real Treasury bill yield decreased. Austin and Houston’s leading index reflected statewide fluctuations, while the trend decreased in the former and increased slightly in the latter. Dallas-Fort Worth (DFW) and San Antonio’s indexes decreased, trending downward despite issuing more building permits and elevating residential starts.

According to Zonda data, the supply side contracted at the earliest stage of the construction cycle with a 3.3 percent quarterly decrease in the number of new vacant developed lots (VDLs). DFW accounted for most of the losses amid a reduction in investment across all price cohorts except in homes priced between $400,000 and $499,000. Similarly, San Antonio’s lot development decreased significantly due to depressed activity at the bottom of the price spectrum. Despite the statewide contraction, Houston and Austin’s metric gained as VDLs intended for homes priced between $200,000 and $299,000 rebounded in the former and development heated up for lots targeted for homes selling between $300,000 and $399,000 in the latter.

Quarterly fluctuations in single-family construction permits reflected movements in VDLs. Although the metric ticked up 0.9 percent on a monthly basis, the trend continued its downward trajectory amid a recent reduction in issuance. Houston and DFW topped the national list at the metropolitan level and accounted for most of the state’s improvement, issuing 3,889 and 3,345 nonseasonally adjusted permits, respectively. In Central Texas, permits staggered in September and trended downward after negative quarterly growth. Austin issued 1,829 single-family permits, while San Antonio issued 1,061. Meanwhile, Texas’ multifamily sector registered a surge in issuance as investment shifted from duplexes, triplexes, and four-unit structures to buildings with five or more units. The multifamily metric remained up 13.3 percent year to date (YTD) relative to the same period last year.

With lumber prices falling, total Texas housing starts increased for the second consecutive quarter. Zonda data revealed roughly 38,000 homes broke ground in the Texas Triangle in 3Q2021, pushing single-family housing starts up 3.9 percent on a quarterly basis amid strengthening economic conditions and robust housing demand. Housing starts in North Texas and Austin reached an all-time high, increasing 8 and 13.8 percent, respectively, from last quarter. Activity also hit record levels in San Antonio, elevating 6.4 percent due to increased investment for homes priced more than $300,000 but decreased in Houston for similarly priced homes.

Single-family private construction values declined 14.4 percent this quarter, extending its contraction to four consecutive months as the metric trended downward in all of Texas’ major metros. On a monthly basis, however, values in Houston increased slightly, but the incremental change did little in lifting the 12.7 percent quarter-over-quarter (QOQ) reduction. Values also fell in Central Texas as Austin and San Antonio’s single-family construction contracted 18.3 and 19.4 percent, respectively. Similarly, activity in DFW declined 25.7 percent QOQ.

The number of homes added to the Texas Multiple Listing Services expanded in September, nudging Texas’ months of inventory (MOI) up to 1.6 months as inventory rose across all price ranges. A total MOI around six months is considered a balanced housing market. The price range at which inventory was at its most expansive was between $200,000 and $299,000, increasing its MOI to 1.3 months. Despite the monthly improvement, homes priced less than $300,000 remained constrained.

Supply in the major metros reflected the statewide fluctuation as inventories expanded at the metropolitan level. Austin’s MOI increased to a month, while the metric in North Texas and San Antonio flattened to 1.2 and 1.7 months, respectively. Although Houston’s overall MOI was greater than the state average at 1.4 months, inventory for homes priced less than $300,000 flattened to 1.2 months. Depleted inventory is a major headwind to the continued health of Texas’ housing market.

Demand

Sales rebounded in September despite ongoing inventory constraints, elevating total housing sales 0.9 percent QOQ. Strong quarterly growth in the luxury-home sector and double-digit growth for homes priced between $300,000 and $499,000 outweighed reduced activity for homes priced less than $300,000. The increase in the major metros exceeded the state average, except in Houston, where quarterly sales contracted.

In contrast to elevated quarterly sales in the existing-home market, Zonda data revealed negative sales growth in three of the major metros’ new-home sectors, pulling the statewide metric down 8.2 percent QOQ. New-home sales in Austin, however, rose 7.9 percent to 5,294 sales, rebounding after last quarter’s steep decline as activity accelerated for homes priced less than $200,000 and for homes priced between $400,000 and $499,000. New-home sales in North Texas and San Antonio declined 8.5 and 8.7 percent QOQ, respectively, even as transactions rose for homes priced between $400,000 and $499,000. Houston’s metric tumbled 13.6 percent QOQ.

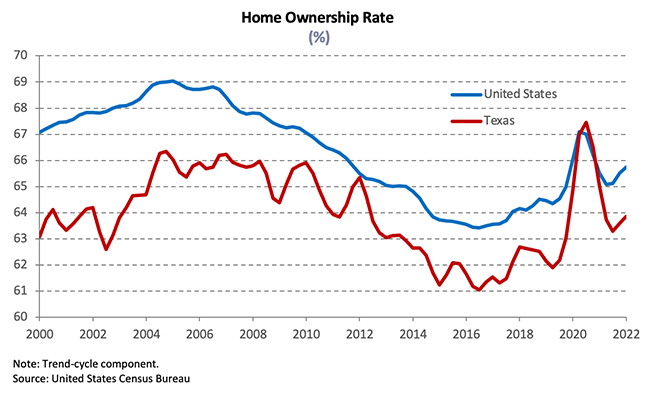
Amid recovering economic conditions and overall robust sales activity, Texas’ homeownership rate ticked down to 63.5 percent, 1.7 percentage points below the U.S. rate, per the U.S. Census Bureau’s Current Population Survey/Housing Vacancy Survey. Nationally, homeownership dipped slightly from last quarter for white households but increased for minority households and householders under 35 years. Metro-level homeownership rates exceeded the national average only in San Antonio, where it improved 8.6 percentage points to 65.9 percent. The metric fell in Austin and Houston to 59.9 and 60.9 percent, respectively. The rate in North Texas ticked down 1.1 percentage points to 60.5 percent. Homeownership rates may remain depressed in the coming months as COVID-19 foreclosure-protection policies expired and home prices continue to rise.

Texas’ average days on market (DOM) increased from last month’s record low to 30 days. This marked the first increase since July 2020. The relatively low DOM indicated robust housing demand despite lackluster sales. Austin’s DOM shed almost six weeks off its year-ago reading, plummeting to an average of 18 days, while homes in North Texas sold after an average of 23 days in both Fort Worth and Dallas. San Antonio and Houston’s metrics also registered steep annual declines and hovered one day above the statewide average, falling to 31 days in each respective MSA. Despite monthly increases in the average DOM in all the major metros, the metric continued to trend downward as low levels persisted, corroborating strong housing demand.

During possible movement to monetary policy normalization starting with the tapering of bond purchases by the Federal Reserve Bank, economic growth forecasts for the rest of the year cooled as the initial and strongest stage of recovery likely reached its peak. It’s unclear whether inflation pressures are temporary or permanent. The ten-year U.S. Treasury bond yield increased to 1.4 percent but was down from pre-pandemic levels of 1.62 percent, and the Federal Home Loan Mortgage Corporation’s 30-year fixed-rate ticked up to 2.9 percent. For the typical Texas mortgagee, the median mortgage rate ticked down in August3 to 3.1 and 2.9 percent for GSE and non-GSE loans, respectively, and, similar to the national headline metric, remained constant relative to year-ago levels. Texas home-purchase applications increased for three consecutive months in September but diminished 12.7 percent YTD, and refinance applications declined 14.6 percent over the same period. Lenders adding more requisites and the shrinking pool of households able to refinance are likely impacting refinance activity. (For more information, see “Finding a Representative Interest Rate for the Typical Texas Mortgagee“.)

In August, the median loan-to-value ratio (LTV) constituting the “typical” Texas conventional home loan dropped from 87.8 a year ago to 84.3. The debt-to-income ratio (DTI) declined from 37.1 to 35.2, while the median credit score jumped 12 points in the last year to 752. The LTV and DTI for GSE borrowers decreased from 85.5 and 35.5 last August to 85.2 and 36, respectively. Overall improved credit profiles reflect the fact that only the most qualified housing applicants are able to outbid their competition for their desired homes amid exceptionally tight inventories and robust demand.

Prices

The Texas median home price rose for the ninth consecutive month, increasing 16.8 percent YOY to a record-breaking $310,100 in September. The ongoing compositional sales shift toward higher-priced homes contributed to a higher median price. The share of luxury-homes sold in Austin more than doubled in the last year, representing more than two-fifths of total transactions and contributing to the 28.3 percent YOY surge in the median price ($456,300). The Dallas metric ($378,300) gained 17 percent, while annual price growth in Fort Worth ($315,900) elevated 18.6 percent. Houston ($303,900) and San Antonio’s ($294,200) metrics rose 14.8 and 15.5 percent, respectively.

The Texas Repeat Sales Home Price Index accounts for compositional price effects and corroborated substantial home-price appreciation as the index hovered near a series maximum, gaining 18.2 percent YOY. The metric skyrocketed 36.1 percent in Austin, followed by North Texas with annual home-price appreciation at 22.9 and 20 percent in Dallas and Fort Worth, respectively. San Antonio posted a 17.2 percent annual hike, while Houston’s index registered double-digit growth for five consecutive months, elevating 14.9 percent. Rapid price growth outpaced wage gains, adding additional pressure to housing affordability.

Single-Family Forecast

The Texas Real Estate Research Center projected single-family housing sales using monthly pending listings from the preceding period (Table 1). Only one month in advance was projected due to uncertainty surrounding the COVID-19 pandemic and the availability of reliable and timely data. Texas sales are expected to tick down 0.3 percent in October after rebounding this month. The metric is estimated to decline 5 and 0.5 percent in Austin and San Antonio, respectively, with additional decreases of 0.8 percent in Houston. Only sales in DFW are expected to remain positive, increasing 0.7 percent next month. Sales through September 2021 should accelerate relative to the same period in 2020, except in North Texas, where forecasts predict a 2.1 percent dip in transactions.

Household Pulse Survey

According to the U.S. Census Bureau’s Household Pulse Survey, the share of Texas homeowners behind on their mortgage payments decreased to 5 percent in September (Table 2). The metric within Texas’ largest metropolitan areas mirrored the statewide average, except in Houston, where the share was 7 percent. The share of Texas respondents who were not current and expected foreclosure to be either very likely or somewhat likely in the next two months grew to 27 percent in September, higher than the national rate of 22 percent (Table 3). The proportion of delinquent individuals who were at risk of foreclosure declined in North Texas, falling to 20 percent, while Houston’s metric shot up 26 percentage points to 44 percent. The Federal Housing Finance Agency’s eviction moratorium for properties owned by Fannie Mae and Freddie Mac (the Enterprises) officially expired as of Sept. 30, 2021. Continued stability in the housing market is essential to Texas’ economic recovery.

________________

1 All measurements are calculated using seasonally adjusted data, and percentage changes are calculated month over month, unless stated otherwise.

2 Bond and mortgage interest rates are nonseasonally adjusted. Loan-to-value ratios, debt-to-income ratios, and the credit score component are also nonseasonally adjusted.

3 The release of Texas mortgage rate data typically lag the Texas Housing Insight by one month.

Source – James P. Gaines, Luis B. Torres, Wesley Miller, Paige Silva, and Griffin Carter (November

Source – James P. Gaines, Luis B. Torres, Wesley Miller, Paige Silva, and Griffin Carter (November 23, 2021)

https://www.recenter.tamu.edu/articles/technical-report/Texas-Housing-Insight

, 2021)

https://www.recenter.tamu.edu/articles/technical-report/Texas-Housing-Insight

2021 Holiday Events in DFW

Our annual list of DFW area holiday events is here! From the Mistletoe Market to Menorah lightings and everything in between, there’s a little something for everyone. From everyone at Republic Title, we wish you a happy and healthy holiday season!

Addison
Vitruvian Lights
Nov. 26 – Jan. 2
UDR.com/Vitruvian-Park

Allen
Grand Menorah Lighting
Dec. 2
JewishMcKinney.com

Holly Jolly Celebration
Dec. 4
AllenSpecialEvents.org

Arlington
Holiday Lights Parade
Dec. 11
HolidayLightsParade.com

Texas Christkindl Market
Nov. 18 – Jan. 2
TXChristkindlMarket.com

Carrollton
Santa On The Square
Dec. 4
CityOfCarrollton.com

Celina
Christmas On The Square
Dec. 1
Celina-TX.org

Dallas
Dallas Holiday Parade
Dec. 4
DallasHolidayParade.com

Dallas Zoo Lights
Nov. 19 – Jan. 2
DallasZoo.com

Galleria Dallas Chanukah Celebration
Nov. 28
GalleriaDallas.com/Holiday

Enchant Christmas
Nov. 26 – Jan. 2
EnchantChristmas.com

Dallas Cont.
Holiday At The Arboretum
Nov. 10 – Dec. 31
DallasArboretum.org

Kwanzaa Fest
Dec. 11-12
FairPark.org

Park Tree Lighting
Dec. 4
KlydeWarrenPark.org

Posada
Dec.12
LCC.DallasCulture.org

Snowday At The Galleria
Nov. 19 – Jan. 17
SnowDayDallas.com

The Trains At Northpark
Nov. 13 – Jan. 2
TheTrainsAtNorthPark.com

Farmers Branch
Tree Lighting & Holiday Market
Dec. 4
FarmersBranchTX.org

Ft. Worth
Gift Of Lights
Nov. 25 – Jan. 2
GiftOfLightsTexas.com

Jingle Ball 2021
Nov. 30
DickiesArena.com

Frisco
Chanukah Celebration
Dec. 5
ChabadFrisco.org

Merry Main Street
Dec. 4
FriscoTexas.Gov

Grapevine
Carol Of Lights
Nov. 22
GrapevineTexasUSA.com

Grapevine Christmas Market
Various Dates In Nov. & Dec.
GrapevineTexasUSA.com

Singing Christmas Tree
Nov. 22 – Jan. 9
GrapevineTexasUSA.com

Little Elm
Magic Of Lights
Nov. 20 – Jan.2
LittleElm.org

McKinney
Home For The Holidays
Nov. 26 – 28
McKinneyTexas.org

Plano
Lights On The Farm
Nov. 26 – Dec. 26
VisitPlano.org

Menorah Lighting & Chanukah Gelt Drop
Nov. 29
ChabadPlano.org

Mistletoe Market In Downtown Plano
Dec. 11 – 12
VisitDowntownPlano.com

Southlake
Santa’s Village
Nov. 21 – Dec. 24
VisitSouthlakeTexas.com

Carriage Rides In The Square
Nov. 12 – Dec.23
VisitSouthlakeTexas.com