Total Texas housing sales fell 2.5 percent in April on top of a first-quarter decline, confirming that the rapid-fire activity last year has lost momentum. Residential construction loan values decreased during the first three months of the year, but housing starts and building permits picked up in April, pointing to stable construction during the summer. Due to rising supply costs, however, new homes are unlikely to be priced at the lower end of the price spectrum, where inventory is most constrained. Persistent demand for housing amid limited availability at the bottom price cohorts pushed sales toward higher-priced homes. Double-digit home-price appreciation and rising mortgage interest rates chipped away at housing affordability and may dampen housing demand moving forward. The unprecedented low level of inventory available for sale is the greatest challenge to Texas’ housing market, assuming the pandemic remains contained.
Supply*
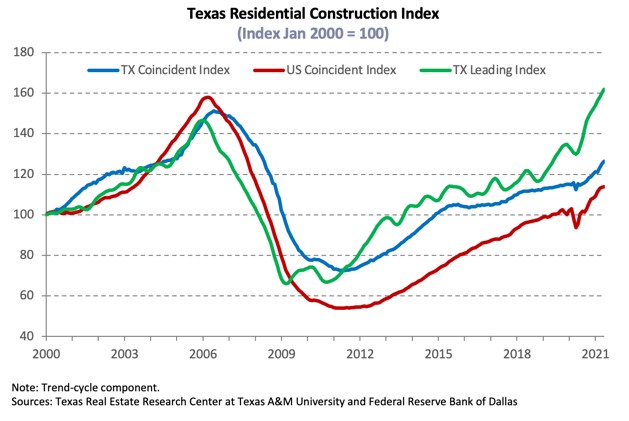
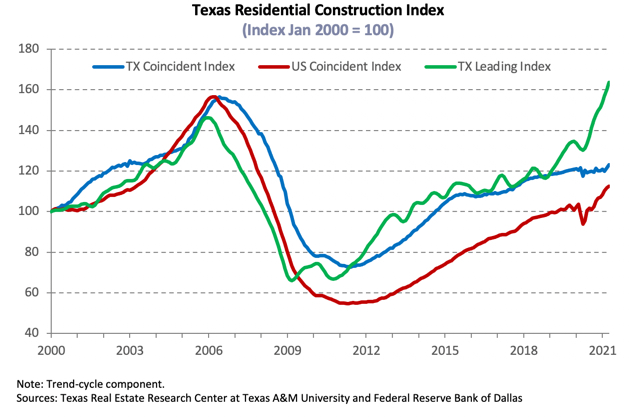
The Residential Construction Cycle (Coincident) Index, which measures current construction levels, trended upward nationally and within Texas due to increased industry wages, employment, and construction values during April. Moreover, the Texas Residential Construction Leading Index indicated construction activity is expected to strengthen in the coming months as weighted building permits and residential starts elevated and the ten-year real Treasury bill declined. Houston accounted for much of the statewide rise in permits and starts, reversing the local leading index’s downward trend. The leading indexes in North and Central Texas decelerated but continued to suggest stable future activity.
Net residential loans extended a three-quarter decline, inching down 0.7 percent quarter over quarter (QOQ) during the first three months of 2021 due to decreases in both the one-to-four unit and multifamily sectors. Corroborating the data, the Board of Governors of the Federal Reserve System’s Senior Loan Officer Opinion Survey indicated a moderate share of banks tightened standards on construction and land development loans. A modest portion, however, eased standards on multifamily loans.
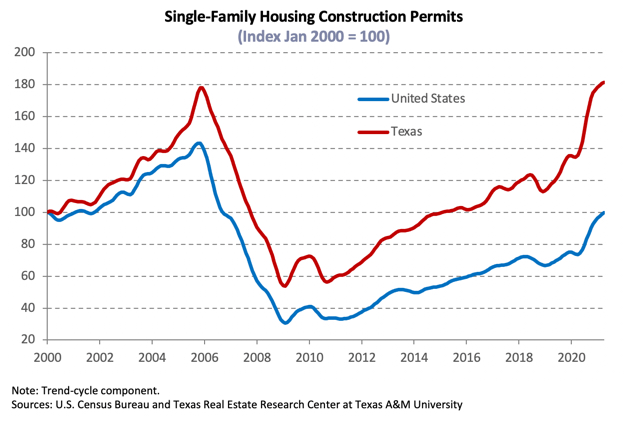
Single-family construction permits increased 4.4 percent in April, extending a year-long upward trend despite falling with residential loan values during the first quarter. Houston topped the national list with 5,254 nonseasonally adjusted permits, registering double-digit growth for the second straight month after adjusting for seasonality. On the other hand, activity in the state’s other major metros slowed, although Dallas-Fort Worth still ranked second in the nation, flattening at 4,515 permits. Meanwhile, Austin and San Antonio issued 2,599 and 1,244 permits, respectively. In Texas’ multifamily sector, permits for five-or-more units rebounded after a two-month decline, shifting attention away from two-to-four units.
After a sluggish start to the year, total Texas housing starts recovered above year-end levels, increasing 4.1 percent on a per capita basis. As single-family starts in the southern region of the U.S. decreased for the third consecutive month, Texas’ single-family private construction values plummeted 24.6 percent in real terms during April. Austin values in particular corrected downward after climbing the past year, falling every month since January. Meanwhile, activity in Houston and Dallas-Fort Worth (DFW) normalized to average levels during 2019. San Antonio registered a steep monthly decline, but values continued on an upward trajectory due to strong growth at the beginning of the year.
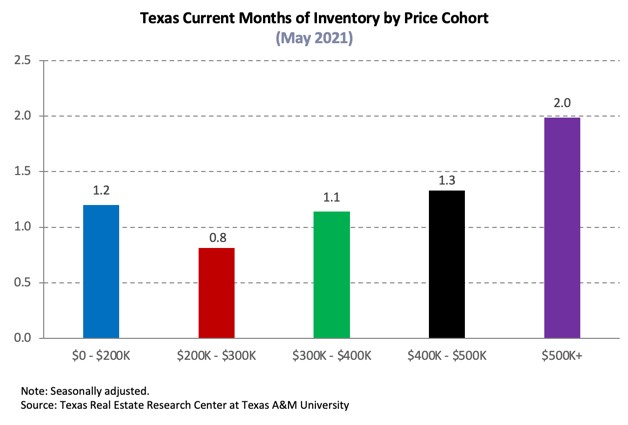
The number of homes added to the Multiple Listings Service flattened at 2016 oil-bust levels in April as homeowners were reluctant to list their house amid ongoing hesitance of in-person home viewing or of being unable to find another home to buy. Moreover, the pace of sales in the last 12 months was still rapid despite a monthly slowdown to start the second quarter of the year, pulling Texas’ months of inventory(MOI) down to 1.3 months. A total MOI around six months is considered a balanced housing market. Inventory for homes priced less than $300,000 was even more constrained, dropping to 0.9 months. Even the MOI for luxury homes (homes priced more than $500,000), the price range at which inventory was at its most expansive, slid to 2.2 months.
The supply situation in the major metros was even more critical than the statewide metric. Although Austin’s MOI ticked up across all price ranges after an influx of new listings the previous month boosted April’s supply of active listings, the metric was still constrained at just 0.5 months. Inventory flattened at one month in both Dallas and Fort Worth and slipped to 1.2 months in San Antonio. Houston’s overall MOI was greater than the state average at 1.5 months, but the metric for homes priced less than $300,000 slipped below 0.8 months. Depleted inventory is a major headwind to the health of Texas’ housing market.
Demand
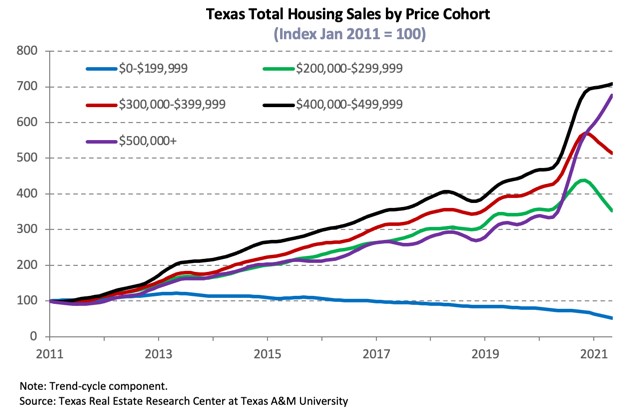
Despite healthy demand, total housing sales decreased 2.5 percent in April on top of a first-quarter decline. Much of the slowdown may be attributed to limited inventory for homes priced less than $300,000. Rising mortgage rates also pressured affordability, especially for first-time homebuyers. On the other hand, sales for homes priced more than $400,000 increased for the second straight month.
Housing sales also continued to normalize from accelerated activity over the past year at the metropolitan level. Monthly fluctuations across Dallas’ price spectrum mirrored the state’s, falling 10.3 percent year to date (YTD). Meanwhile, sales in San Antonio and Fort Worth dropped 16.1 and 12.4 percent YTD, respectively, despite positive growth in the luxury-home sector. Luxury-home sales increased by a third relative to year-end levels in Austin, but the overall metric still contracted 8.4 percent. Although Houston sales declined across all price cohorts in April, YTD activity decreased only 4.4 percent.
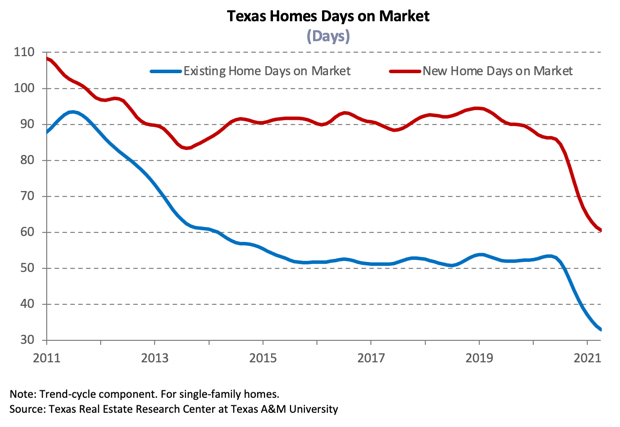
Texas’ average days on market (DOM) registered a steep drop to just 37 days in April, corroborating robust demand amid steady population growth and favorable economic conditions for higher-income potential homebuyers. In Austin and North Texas, the average home sold even faster, staying on the market only 19 days in the former and 28 and 27 days in Dallas and Fort Worth, respectively. San Antonio’s DOM matched the statewide metric, while Houston’s steadied at 41 days.
National economic data fulfilled expectations from earlier in the year, which were priced into first-quarter interest rates. The ten-year U.S. Treasury bond yield stabilized at pre-pandemic levels of 1.6 percent** in April, while the Federal Home Loan Mortgage Corporation’s 30-year fixed-rate flattened at 3.1 percent. Reflecting the national trend during 1Q2021, the median mortgage rate within Texas inched up to 2.89 and 2.76 percent for GSE and non-GSE loans, respectively, in March***. Amid higher mortgage rates, Texas home-purchase applications slid 17.3 percent YTD in April but remained one-third above year-ago activity. On the other hand, refinance applications decreased 34.1 percent YTD, being more sensitive to mortgage rate fluctuations. Lenders adding more requisites and the shrinking pool of households able to refinance is likely impacting refinance activity as well. (For more information, see Finding a Representative Interest Rate for the Typical Texas Mortgagee.)
In March, the median loan-to-value ratio (LTV) constituting the “typical” Texas conventional-loan mortgage decreased from 85.4 to 83.9. The debt-to-income ratio (DTI) flattened at 35.4, but the median credit score jumped from 753 to 757. The median LTV of the GSE borrower inched up from 85.1 to 85.7 but continued to trend downward, while the DTI dipped from 35.9 to 35.6. Overall improved credit profiles may reflect the fact that only the most qualified housing applicants are able to outbid their competition for their desired homes amid exceptionally tight inventories and robust demand.
Prices
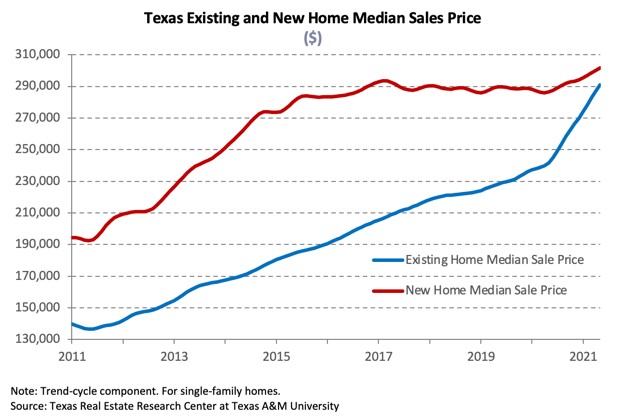
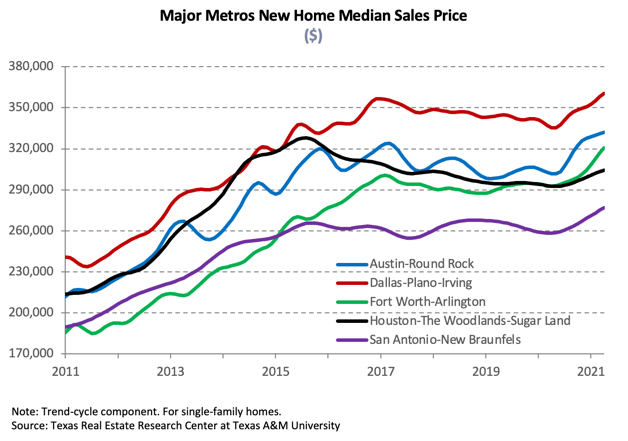
A shift in the composition of sales toward higher-priced homes due to constrained inventories at the lower end of the market contributed to home-price appreciation. The Texas median home price rose for the fourth consecutive month, accelerating 17.3 percent YOY to a record-breaking $289,700 in April. The share of luxury-homes sold in Austin more than doubled to two-fifths compared with this time last year, contributing to the 41.7 percent annual surge in the median price ($451,400). The Dallas metric ($355,400) also increased at a higher rate than the state average, skyrocketing 20.4 percent. The median price elevated 17.5 percent YOY in Houston ($291,300) and 15.2 and 15.1 percent in San Antonio ($275,200) and Fort Worth ($290,300), respectively.
The Texas Repeat Sales Home Price Index accounts for compositional price effects and provides a better measure of changes in single-family home values. Texas’ index corroborated substantial and unsustainable home-price appreciation, soaring 13.5 percent YOY. Austin’s index rose 34.5 percent, followed by North Texas with 11.9 and 15.2 percent home-price appreciation in Dallas and Fort Worth, respectively. Meanwhile, the metric climbed 12.0 percent in San Antonio and 9.2 percent in Houston. Increasing home prices pressure housing affordability, particularly in an environment of mortgage rate hikes and low wage growth.
Single-Family Forecast
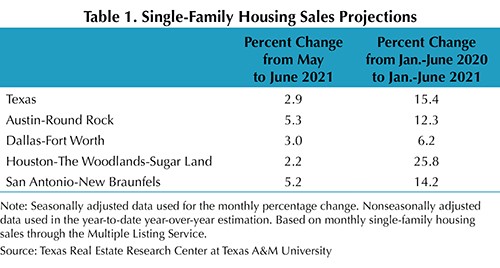
The Texas Real Estate Research Center projected single-family housing sales using monthly pending listings from the preceding period (Table 1). Only one month in advance was projected due to the uncertainty surrounding the COVID-19 pandemic and the availability of reliable and timely data. Texas sales are expected to decrease for the second straight month in May, falling around 5 percent. Activity is likely to decline about 5.5 percent in Houston and San Antonio, and drop 7.3 percent in DFW. Austin’s single-family sales are predicted to slump 4.3 percent, normalizing to a more sustainable pace in a low-inventory environment. Nevertheless, sales through the first five months of 2021 should surpass sales during the same period in 2020.