Total Texas housing sales ticked up 0.9 percent during the third quarter as inventories remained relatively low in September. Most of the quarterly increase can be attributed to accelerated activity for existing homes priced above $300,000, offsetting the decline in new-home sales and reduced transactions in the lower price ranges. Texas’ homeownership rate decreased amid reduced housing affordability. Overall, housing demand remained healthy but was hindered by depleted inventories, pushing annual median home-price growth well into double-digit territory. Despite low levels of inventory, supply-side indicators declined compared with year-ago measures as supply chain issues persist.
Supply1
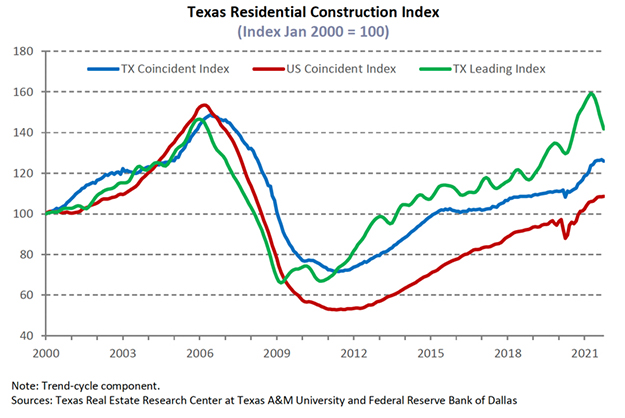
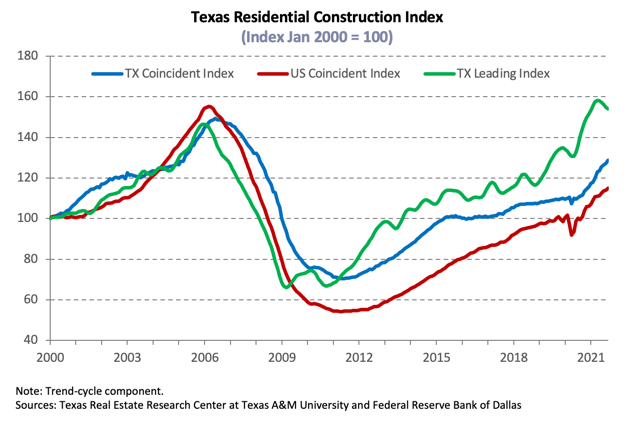
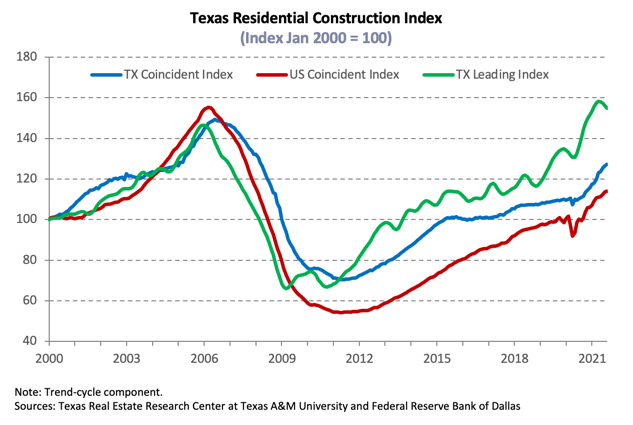
The Residential Construction Cycle (Coincident) Index, which measures current construction levels, decreased nationally but increased slightly for Texas as improvements in industry wages and employment outweighed depressed construction values. Construction activity is expected to slow in coming months as indicated by the Texas Residential Construction Leading Index (RCLI), which fell amid lower weighted building permits and housing starts, while the ten-year real Treasury bill yield decreased. Austin and Houston’s leading index reflected statewide fluctuations, while the trend decreased in the former and increased slightly in the latter. Dallas-Fort Worth (DFW) and San Antonio’s indexes decreased, trending downward despite issuing more building permits and elevating residential starts.
According to Zonda data, the supply side contracted at the earliest stage of the construction cycle with a 3.3 percent quarterly decrease in the number of new vacant developed lots (VDLs). DFW accounted for most of the losses amid a reduction in investment across all price cohorts except in homes priced between $400,000 and $499,000. Similarly, San Antonio’s lot development decreased significantly due to depressed activity at the bottom of the price spectrum. Despite the statewide contraction, Houston and Austin’s metric gained as VDLs intended for homes priced between $200,000 and $299,000 rebounded in the former and development heated up for lots targeted for homes selling between $300,000 and $399,000 in the latter.
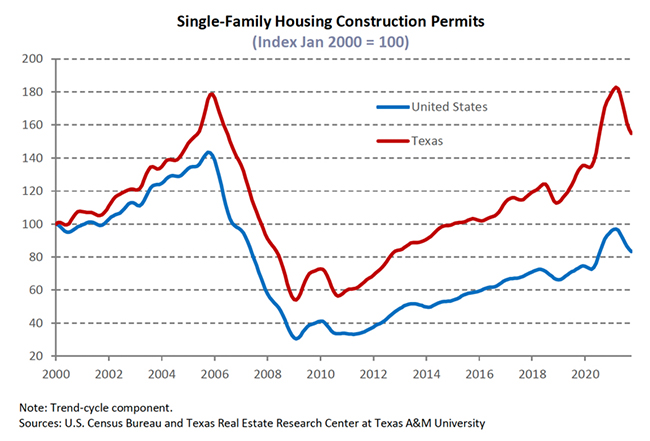
Quarterly fluctuations in single-family construction permits reflected movements in VDLs. Although the metric ticked up 0.9 percent on a monthly basis, the trend continued its downward trajectory amid a recent reduction in issuance. Houston and DFW topped the national list at the metropolitan level and accounted for most of the state’s improvement, issuing 3,889 and 3,345 nonseasonally adjusted permits, respectively. In Central Texas, permits staggered in September and trended downward after negative quarterly growth. Austin issued 1,829 single-family permits, while San Antonio issued 1,061. Meanwhile, Texas’ multifamily sector registered a surge in issuance as investment shifted from duplexes, triplexes, and four-unit structures to buildings with five or more units. The multifamily metric remained up 13.3 percent year to date (YTD) relative to the same period last year.
With lumber prices falling, total Texas housing starts increased for the second consecutive quarter. Zonda data revealed roughly 38,000 homes broke ground in the Texas Triangle in 3Q2021, pushing single-family housing starts up 3.9 percent on a quarterly basis amid strengthening economic conditions and robust housing demand. Housing starts in North Texas and Austin reached an all-time high, increasing 8 and 13.8 percent, respectively, from last quarter. Activity also hit record levels in San Antonio, elevating 6.4 percent due to increased investment for homes priced more than $300,000 but decreased in Houston for similarly priced homes.
Single-family private construction values declined 14.4 percent this quarter, extending its contraction to four consecutive months as the metric trended downward in all of Texas’ major metros. On a monthly basis, however, values in Houston increased slightly, but the incremental change did little in lifting the 12.7 percent quarter-over-quarter (QOQ) reduction. Values also fell in Central Texas as Austin and San Antonio’s single-family construction contracted 18.3 and 19.4 percent, respectively. Similarly, activity in DFW declined 25.7 percent QOQ.
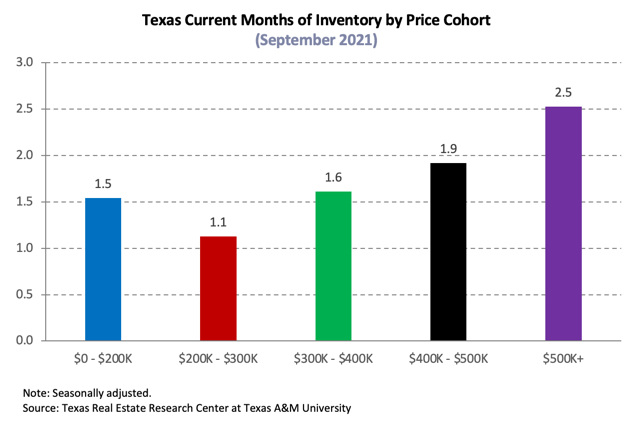
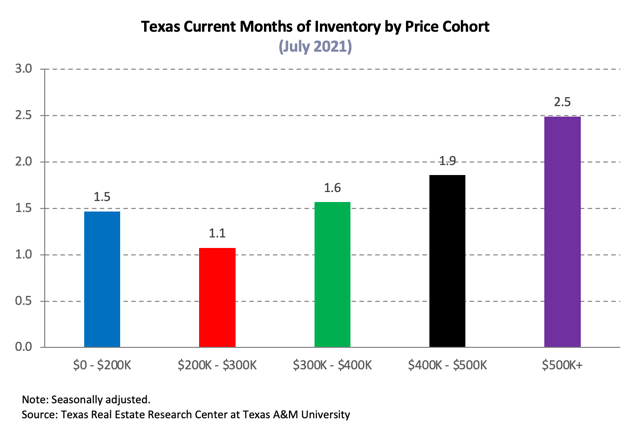
The number of homes added to the Texas Multiple Listing Services expanded in September, nudging Texas’ months of inventory (MOI) up to 1.6 months as inventory rose across all price ranges. A total MOI around six months is considered a balanced housing market. The price range at which inventory was at its most expansive was between $200,000 and $299,000, increasing its MOI to 1.3 months. Despite the monthly improvement, homes priced less than $300,000 remained constrained.
Supply in the major metros reflected the statewide fluctuation as inventories expanded at the metropolitan level. Austin’s MOI increased to a month, while the metric in North Texas and San Antonio flattened to 1.2 and 1.7 months, respectively. Although Houston’s overall MOI was greater than the state average at 1.4 months, inventory for homes priced less than $300,000 flattened to 1.2 months. Depleted inventory is a major headwind to the continued health of Texas’ housing market.
Demand
Sales rebounded in September despite ongoing inventory constraints, elevating total housing sales 0.9 percent QOQ. Strong quarterly growth in the luxury-home sector and double-digit growth for homes priced between $300,000 and $499,000 outweighed reduced activity for homes priced less than $300,000. The increase in the major metros exceeded the state average, except in Houston, where quarterly sales contracted.
In contrast to elevated quarterly sales in the existing-home market, Zonda data revealed negative sales growth in three of the major metros’ new-home sectors, pulling the statewide metric down 8.2 percent QOQ. New-home sales in Austin, however, rose 7.9 percent to 5,294 sales, rebounding after last quarter’s steep decline as activity accelerated for homes priced less than $200,000 and for homes priced between $400,000 and $499,000. New-home sales in North Texas and San Antonio declined 8.5 and 8.7 percent QOQ, respectively, even as transactions rose for homes priced between $400,000 and $499,000. Houston’s metric tumbled 13.6 percent QOQ.
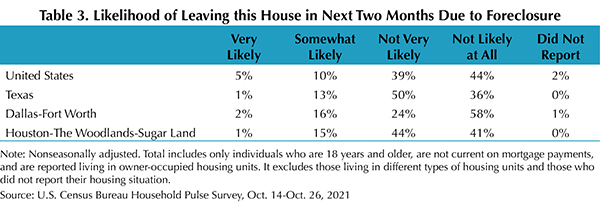
Amid recovering economic conditions and overall robust sales activity, Texas’ homeownership rate ticked down to 63.5 percent, 1.7 percentage points below the U.S. rate, per the U.S. Census Bureau’s Current Population Survey/Housing Vacancy Survey. Nationally, homeownership dipped slightly from last quarter for white households but increased for minority households and householders under 35 years. Metro-level homeownership rates exceeded the national average only in San Antonio, where it improved 8.6 percentage points to 65.9 percent. The metric fell in Austin and Houston to 59.9 and 60.9 percent, respectively. The rate in North Texas ticked down 1.1 percentage points to 60.5 percent. Homeownership rates may remain depressed in the coming months as COVID-19 foreclosure-protection policies expired and home prices continue to rise.
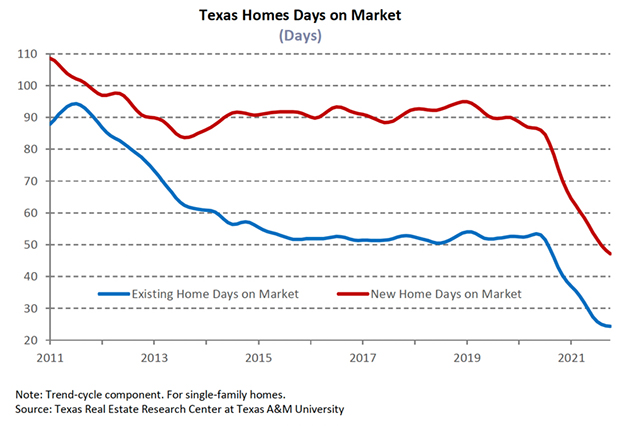
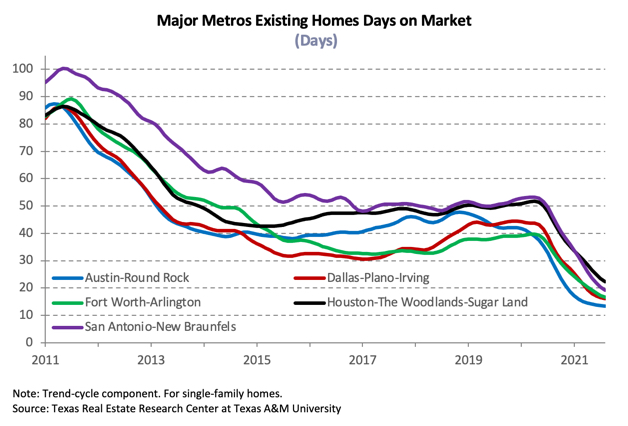
Texas’ average days on market (DOM) increased from last month’s record low to 30 days. This marked the first increase since July 2020. The relatively low DOM indicated robust housing demand despite lackluster sales. Austin’s DOM shed almost six weeks off its year-ago reading, plummeting to an average of 18 days, while homes in North Texas sold after an average of 23 days in both Fort Worth and Dallas. San Antonio and Houston’s metrics also registered steep annual declines and hovered one day above the statewide average, falling to 31 days in each respective MSA. Despite monthly increases in the average DOM in all the major metros, the metric continued to trend downward as low levels persisted, corroborating strong housing demand.
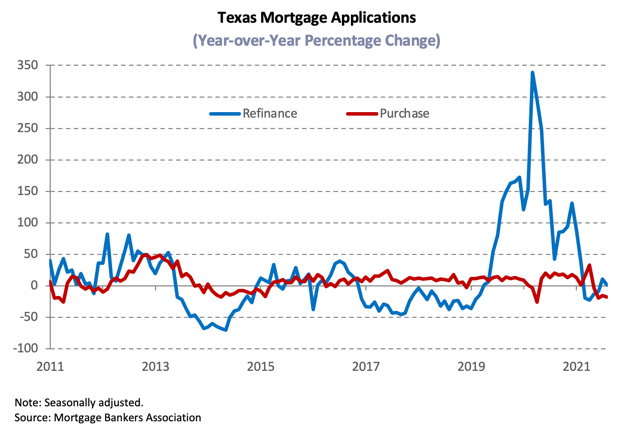
During possible movement to monetary policy normalization starting with the tapering of bond purchases by the Federal Reserve Bank, economic growth forecasts for the rest of the year cooled as the initial and strongest stage of recovery likely reached its peak. It’s unclear whether inflation pressures are temporary or permanent. The ten-year U.S. Treasury bond yield increased to 1.4 percent but was down from pre-pandemic levels of 1.62 percent, and the Federal Home Loan Mortgage Corporation’s 30-year fixed-rate ticked up to 2.9 percent. For the typical Texas mortgagee, the median mortgage rate ticked down in August3 to 3.1 and 2.9 percent for GSE and non-GSE loans, respectively, and, similar to the national headline metric, remained constant relative to year-ago levels. Texas home-purchase applications increased for three consecutive months in September but diminished 12.7 percent YTD, and refinance applications declined 14.6 percent over the same period. Lenders adding more requisites and the shrinking pool of households able to refinance are likely impacting refinance activity. (For more information, see “Finding a Representative Interest Rate for the Typical Texas Mortgagee“.)
In August, the median loan-to-value ratio (LTV) constituting the “typical” Texas conventional home loan dropped from 87.8 a year ago to 84.3. The debt-to-income ratio (DTI) declined from 37.1 to 35.2, while the median credit score jumped 12 points in the last year to 752. The LTV and DTI for GSE borrowers decreased from 85.5 and 35.5 last August to 85.2 and 36, respectively. Overall improved credit profiles reflect the fact that only the most qualified housing applicants are able to outbid their competition for their desired homes amid exceptionally tight inventories and robust demand.
Prices
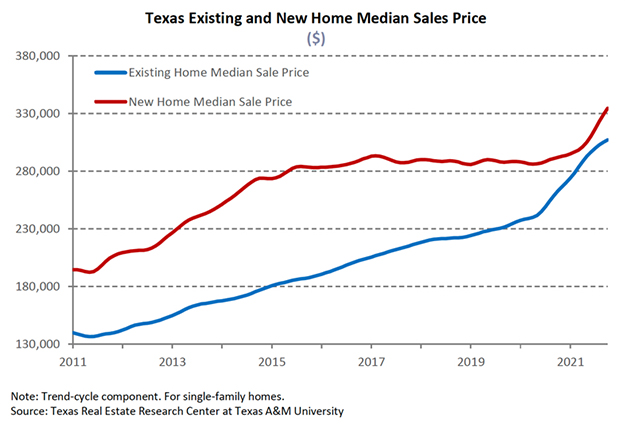
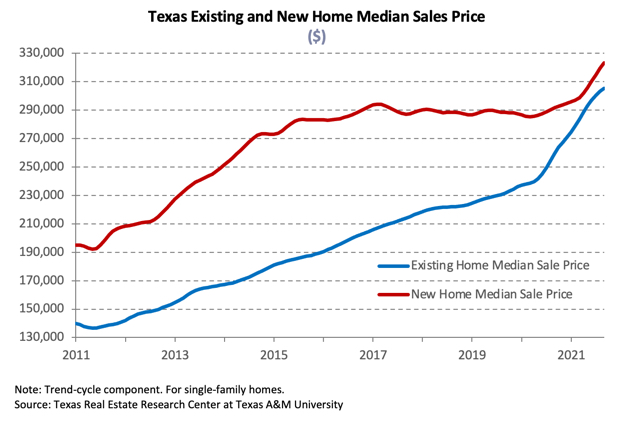
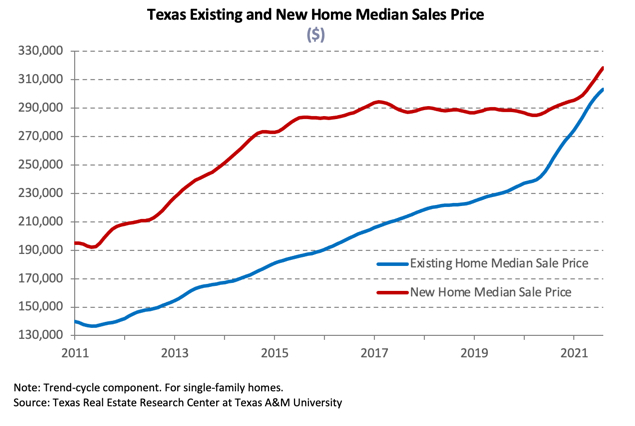
The Texas median home price rose for the ninth consecutive month, increasing 16.8 percent YOY to a record-breaking $310,100 in September. The ongoing compositional sales shift toward higher-priced homes contributed to a higher median price. The share of luxury-homes sold in Austin more than doubled in the last year, representing more than two-fifths of total transactions and contributing to the 28.3 percent YOY surge in the median price ($456,300). The Dallas metric ($378,300) gained 17 percent, while annual price growth in Fort Worth ($315,900) elevated 18.6 percent. Houston ($303,900) and San Antonio’s ($294,200) metrics rose 14.8 and 15.5 percent, respectively.
The Texas Repeat Sales Home Price Index accounts for compositional price effects and corroborated substantial home-price appreciation as the index hovered near a series maximum, gaining 18.2 percent YOY. The metric skyrocketed 36.1 percent in Austin, followed by North Texas with annual home-price appreciation at 22.9 and 20 percent in Dallas and Fort Worth, respectively. San Antonio posted a 17.2 percent annual hike, while Houston’s index registered double-digit growth for five consecutive months, elevating 14.9 percent. Rapid price growth outpaced wage gains, adding additional pressure to housing affordability.
Single-Family Forecast
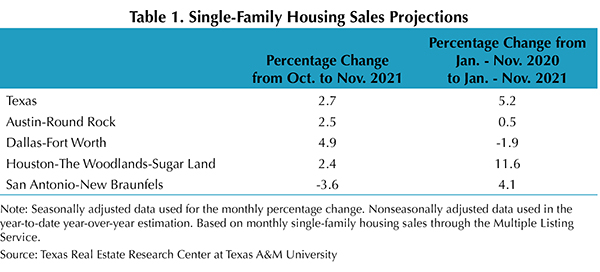
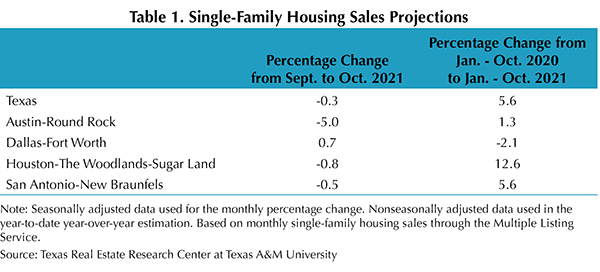
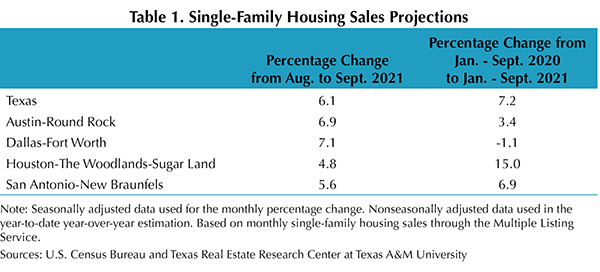
The Texas Real Estate Research Center projected single-family housing sales using monthly pending listings from the preceding period (Table 1). Only one month in advance was projected due to uncertainty surrounding the COVID-19 pandemic and the availability of reliable and timely data. Texas sales are expected to tick down 0.3 percent in October after rebounding this month. The metric is estimated to decline 5 and 0.5 percent in Austin and San Antonio, respectively, with additional decreases of 0.8 percent in Houston. Only sales in DFW are expected to remain positive, increasing 0.7 percent next month. Sales through September 2021 should accelerate relative to the same period in 2020, except in North Texas, where forecasts predict a 2.1 percent dip in transactions.