ALTAEndorsementGuide

2024 Commercial Endorsement Guide

We’re excited to announce the release of the 2024 Commercial Endorsement Guide, your go-to resource for the top ALTA commercial endorsements. This guide is now available in both printed and digital formats, ensuring that you have the flexibility to access the information you need, whenever and wherever you need it.

What’s New in the 2024 Guide?

  • Interactive Digital Flipbook: The digital version of our guide is designed as an easy-to-navigate flipbook. You can quickly access a clickable list of top commercial endorsements and perform keyword searches to find exactly what you’re looking for. The flipbook is linked here for your convenience.
  • Alignment with 2021 Policy Forms: All endorsements in the guide are related to the 2021 Owners and Loan Policy forms.
  • New Endorsements: We’ve included new ALTA 10.2 and 10.3 endorsements.
  • Revised Endorsements: The guide also features updated endorsements, including the ALTA 3.3, ALTA 14 series, and ALTA 42.

Whether you prefer the tactile experience of a printed guide or the convenience of a digital one, the 2024 Commercial Endorsement Guide is designed to make your work easier and more efficient. Access it today and ensure you have the best tools at your disposal for your commercial transactions.

Click here to access the digital 2024 Endorsement Guide.

Printed guides are also available. Please contact Vicki Summerall or Andi Bawcum to request yours today.

Slide1

July 2024 DFW Real Estate Stats

In July 2024, the real estate market in the DFW Metroplex displayed varied trends across different counties.  Overall, the DFW Metroplex saw a mix of rising listing activity and extended market times, with some counties experiencing price growth while others faced slight declines in sales.

Collin County saw significant activity, with new listings increasing by 27% and active listings surging by 46.1%. The days on market (DOM) rose to 39 days, marking a 25% increase from the prior year. The average sales price was approximately $580K, slightly down by 1.4%, while the average price per square foot rose by 1.3% to $228. Closed sales increased marginally by 1.2%, reaching 1,452 units.

In Dallas County, new listings grew by 14.9%, and active listings by 42.2%. The DOM increased to 37 days, up over 27% from the previous year. The average sales price rose by 8.7% to $575K, with the price per square foot also seeing a rise of 2.1% to $241. However, closed sales declined by 3.3%, totaling 1,797 units.

Denton County followed a similar trend, with new listings up by 11.9% and active listings by 26.8%. The DOM was 39 days, up 8.3% from the previous year. The average sales price increased by 1.5% to $578K, and the price per square foot rose slightly by 0.5% to $223. Closed sales remained nearly flat, with a slight decrease of 0.1%, ending at 1,274 units.

Rockwall County experienced a modest increase in new listings by 6.2% and active listings by 31.7%. However, the DOM rose significantly to 60 days, an increase of over 33% from the prior year. The average sales price increased by 11% to $537K, while the price per square foot went up by 3.7% to $197. Closed sales dropped notably by 17.5%, totaling 179 units.

In Tarrant County, new listings increased by 11.9%, and active listings by 30.5%. The DOM was 40 days, a 25% increase from the previous year. The average sales price was $454K, with the price per square foot at $201. Closed sales saw a slight rise of 2.1%, reaching 2,054 units.

Our stats infographics include a year over year comparison and area highlights for single family homes broken down by county. We encourage you to share these infographics and video with your sphere.

For more stats information, pdfs and graphics of our stats including detailed information by county, visit the Resources section on our website at DFW Area Real Estate Statistics | Republic Title of Texas.

For the full report from the Texas A&M Real Estate Research Center and for NTREIS Local Market reports click here.

HousingInsightJune2024

Texas Housing Insight June 2024 Summary

Housing activity for both new and existing homes decreased considerably in June. Growth in active listings resulted in downward pressure on home prices. Seasonally adjusted home prices dipped 1.5 percent, which is uncharacteristic for June when housing activity normally peaks for the year.

Home Sales Take Major Downhill Slide in June

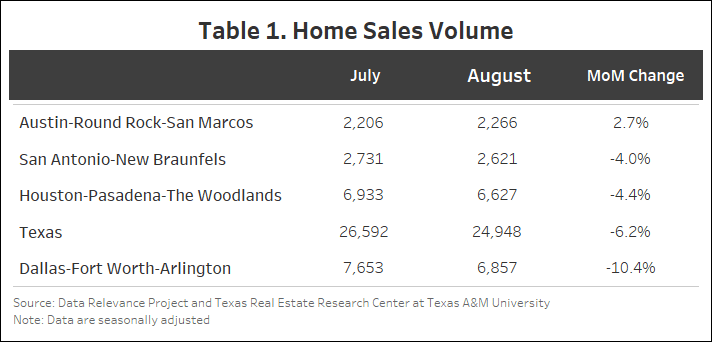
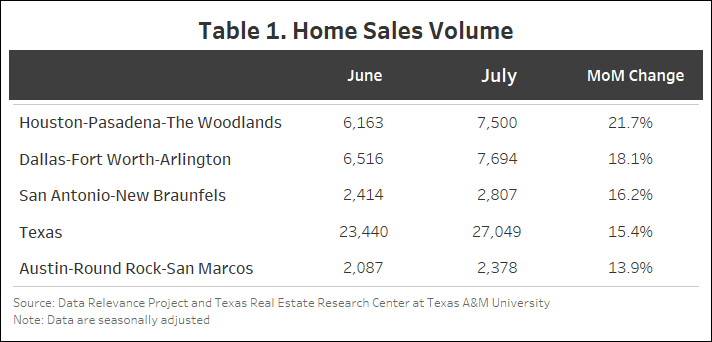
Texas witnessed a 14.2 percent month over month (MOM) decrease in seasonally adjusted home sales in June, resulting in 23,791 homes sold (Table 1). Dallas experienced the largest decrease among the Big Four at 16.8 percent (6,571) followed by Houston (6,474) and Austin (2,299), which each fell by 14.5 percent. The decline in San Antonio was relatively minimal, at 13 percent (2,587). As of June, year-to-date home sales are at the same levels as last year.

Recent data indicate a shift in new listings following a period of steady growth, notably led by Austin among the major metropolitan areas, which experienced a 13.6 percent decline to 3,513 listings. While all Big Four cities saw decreases, Austin’s decline was the most pronounced. Houston and San Antonio saw reductions of 3.8 percent (12,919 listings) and 2.4 percent (4,692 listings), respectively. Dallas exhibited the least variation, with a modest decrease of 1.2 percent (10,852 listings).

The state’s average days on market (DOM) increased from 57 to 59. Austin and Houston each increased by three days and are currently at 68 and 50 days, respectively. San Antonio and Dallas each increased by two days. San Antonio had the highest days on market among the Big Four with 74 days. Dallas had an average of 51 days. The number of Texas active listings went up from 113,714 to 116,797 (2.7 percent). The active listings across the Big Four were mixed in June with Houston increasing by 15.7 percent (30,179) while Dallas fell 9.7 percent (24,557). San Antonio and Austin had relatively smaller increases of 2.5 percent (13,576) and 0.3 percent (11,407), respectively.

Statewide pending listings in Texas have been on a decline since February with only a slight increase of 0.3 percent in June. San Antonio and Dallas both decreased by 10 percent and are currently at 2,459 and 6,493, respectively. Houston and Austin increased by 8 percent (7,592) and 4 percent (2,464), respectively. The slowdown in sales and pending listings in San Antonio and Dallas have contributed to their higher-than-normal active listing count.

Interest Rates Dip Slightly

Treasury and mortgage rates both declined in the month of June but was not enough to positively influence housing sales. The average ten-year U.S. Treasury Bond yield fell 17 basis points to 4.31 percent. The Federal Home Loan Mortgage Corporation’s 30-year fixed-rate fell by 14 basis points to 6.92 percent.

Single-Family Permits Follow Sales Decline

Texas state monthly building permits plummeted 18.9 percent MOM in June reaching 10,977. The Big Four faced a comprehensive decline to varying degrees. The decrease in Austin was the most significant, reaching 30.1 percent. Dallas also experienced a substantial drop, with a decrease of 20.1 percent. Houston and San Antonio had smaller declines of 7.1 and 7.7 percent, respectively.

Single-family construction starts also declined but to a much lesser degree according to data from Dodge Construction Network. Seasonally adjusted statewide single-family starts decreased by 0.3 percent MOM to 13,198 units. Austin had a slower month for permits with a decline of 3.2 percent. DFW actually increased 2.8 percent over May, reaching 3,566 starts. Houston and San Antonio had a slight increase of 0.4 and 0.1 percent, respectively.

The state’s total value of single-family starts climbed from $14.68 billion in June 2023 to $20.06 billion in June 2024. Houston accounted for 36.3 percent of the state’s total starts value followed by Dallas with 26.8 percent.

Home Price Declines

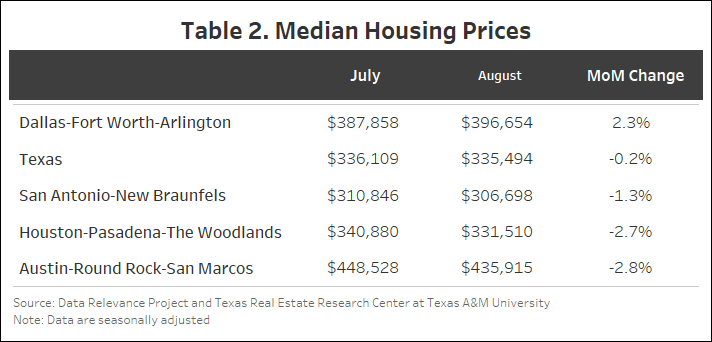
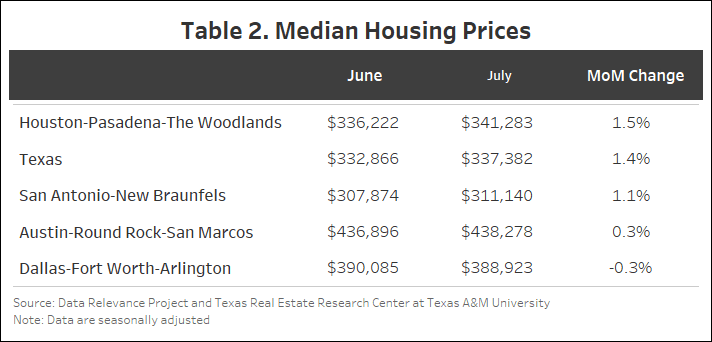
Texas’ median home price fell by 1.5 percent MOM in June with an overall decline in the Big Four areas (Table 2). Houston, San Antonio, and Austin each declined by less than one percent. Dallas experienced the largest decline, with a drop of 1.7 percent, surpassing the overall state decline. For a better understanding of repeat sales from the median approach, see Texas Home Price Index Explained – REC 101.

The Texas Repeat Sales Home Price Index (Jan 2005=100), which is a more accurate reflection of home price changes, fell 0.4 percent MOM in June but increased 1.4 percent year over year (YOY). Austin’s annual appreciation remains below the state’s average and fell by 1.5 percent YOY in June.


Source: Texas Housing Insight | Texas Real Estate Research Center (tamu.edu)

BY JOSHUA ROBERSON, RHUTU KALLURand WESLEY MILLER (August 6, 2024)

Sold house sign in Midwest suburban setting. Focus on sign.

The Home-Buying Process: An 11-Step Journey to Your New Home

Buying a home is an exciting journey, often marking a significant milestone in one’s life. However, it can also be a complex process, filled with important decisions and necessary steps. Partnering with an experienced and reliable title company, like Republic Title, can make this journey smoother and more enjoyable. With a mission to provide value to every customer they serve through Proven Experience, Dedicated Service, and Lasting Relationships, Republic Title ensures the transfer and protection of your title with the highest level of professionalism and integrity. Let’s walk through the steps of the home-buying process to help you confidently move forward in finding your dream home.

Step 1: Determine Your Budget and Get Pre-Approved

The first step in the home-buying process is determining how much you can afford. This involves evaluating your income, debts, and savings. Use a mortgage calculator to get an estimate of your monthly payments and consider getting pre-approved for a loan. Pre-approval gives you a clear picture of what you can afford and strengthens your offer when you find the right home.

Step 2: Research and Select a Real Estate Agent

knowledgeable real estate agent is valuable in navigating the home-buying process. They provide expertise on the local market, help you find homes that meet your criteria, and guide you through negotiations. Look for agents with good reviews, local experience, and a solid track record.

Step 3: Start House Hunting

Once you have your budget and real estate agent, it’s time to start looking for your new home. Make a list of must-haves and nice-to-haves to narrow down your search. Attend open houses, schedule private showings, and explore various neighborhoods to find a home that fits your needs and lifestyle.

Home Buying Process

Step 4: Make an Offer

When you find the right home, your real estate agent will help you make an offer. This involves determining a fair price based on comparable homes in the area, the condition of the property, and current market conditions. Be prepared for negotiations with the seller until you reach an agreement.

Step 5: Option Period

After your offer is accepted, you’ll enter the option period, a phase allowing you to conduct due diligence. While the option period is not mandatory, it is commonly negotiated and agreed to by the parties in residential real estate transactions. Typically lasting seven to 10 days, this period lets you further inspect the property and negotiate repairs or terms based on your findings. The option period allows you to back out of the contract without losing your earnest money if significant issues arise.

Step 6: Escrow and Title Work

Following the acceptance of your offer and the signing of the contract, you have three days to deposit the agreed-upon amount of earnest money with the title company. This deposit, held in escrow, demonstrates your commitment to the purchase. Republic Title will then conduct a thorough examination of public records to determine the property’s ownership, identify any liens, and uncover other matters that could affect the title, such as judgments, bankruptcies, divorce, or death. Any issues found will require further investigation by the title company before closing can occur, ensuring that you receive a clear title.

Home Buying Process

Step 7: Conduct a Home Inspection

home inspection is crucial to identify any potential issues with the property. Hire a professional inspector to evaluate the home’s condition, including the foundation, roof, electrical systems, and plumbing. If significant issues are found, you may negotiate repairs or adjust your offer.

Step 8: Get a Home Appraisal

Your lender will require a home appraisal to determine the property’s value. This ensures that the loan amount does not exceed the home’s worth. An appraiser will assess the property’s condition, location, and comparable home sales in the area.

Step 9: Loan Approval

After the home appraisal, your lender will review your loan application, accompanying documents, and credit history. An underwriter will analyze this information to ensure everything meets the lender’s requirements. Once approved, you will receive final loan approval, confirming your financing is secure.

Step 10: Purchase Homeowners Insurance

Homeowners insurance is essential for protecting your new investment. This insurance covers damages to the home and personal property due to events like fire, theft, and natural disasters. Ensure you have a policy in place before closing to protect your home from the day you take ownership.

Step 11: Close the Deal

The final step is the closing process. During this stage, you’ll review and sign various documents, including the loan agreement and deed. Republic Title’s team will facilitate the transfer of funds and ensure all legal requirements are met. After closing, you’ll receive the keys to your new home.

The home-buying process can be intricate, but with the right guidance and support, it becomes a rewarding experience. By choosing Republic Title, you’re not just protecting your investment; you’re partnering with a company dedicated to making your home-buying experience smooth, secure, and successful. For more home-buying resources, visit republictitle.com/buyer-resources.

Source: The Home-Buying Process: An 11-Step Journey to Your New Home – CandysDirt.com

Slide1

June 2024 DFW Real Estate Stats

In June 2024, the real estate landscape across various counties in the Dallas-Fort Worth area continued to show varied patterns.

In Collin County, there was a notable 9% increase in new listings, alongside a substantial 41.5% rise in active listings compared to the previous year. The average days on the market saw an 11% increase, while the average sales price slightly decreased to $593,841, and the average price per square foot dropped by 0.5%. Closed sales experienced an 8% decline from the prior year.

Dallas County observed a 5.6% growth in new listings, accompanied by a significant 38.7% increase in active listings year-over-year. The average days on market surged by 23.3%, while the average sales price decreased by 4.1% to $518,889. The average price per square foot, however, saw a slight uptick of 0.8%. Closed sales declined notably by 21.2% compared to the previous year.

In Denton County, new listings decreased by 6.2%, but active listings rose by nearly 25% from June 2023. The average days on market increased by 5.7%, while the average sales price showed a 4% uptick. The average price per square foot also increased by 4%, despite closed sales declining by 15% compared to the same period last year.

Overall, the real estate market in North Texas appears to be navigating through a phase of adjustment and recalibration in mid-2024. Monitoring these trends will be crucial to understanding how the market evolves in response to economic conditions and buyer sentiment in the coming months.

Our stats infographics include a year over year comparison and area highlights for single family homes broken down by county. We encourage you to share these infographics and video with your sphere.

For more stats information, pdfs and graphics of our stats including detailed information by county, visit the Resources section on our website at DFW Area Real Estate Statistics | Republic Title of Texas.

For the full report from the Texas A&M Real Estate Research Center, click here. For NTREIS County reports click here.

HousingInsightMay2024

Texas Housing Insight May 2024

All measurements are calculated using seasonally adjusted data, and percentage changes are calculated month-over-month, unless stated otherwise. Data are current as of June 22, 2024.

Housing activity for both new and existing homes decreased in May. Despite a rise in active listings, home prices remained the same at $340,000 for the second month in a row.

Slow Home Sales for May

Texas witnessed a 4.2 percent decrease in total seasonally adjusted home sales month over month (MOM), resulting in 27,845 homes sold (Table 1). Austin and Dallas experienced decreases of 4.5 percent (2,731) and 2.4 percent (7,920), respectively. However, San Antonio and Houston experienced slight increases of 1.7 percent (3,049) and 1 percent (7,623). Overall, there has been a significant downward trend for sales compared with the past few years.

New listings have been steadily increasing, although there is a slight drop of 2.9 percent (45,878) in May. Among the Big Four, San Antonio experienced the only increase at 6.4 percent. Austin saw the largest decline at 13.3 percent while Dallas dropped 6.6 percent. Houston’s new listings were relatively unchanged. 

The state’s average days on the market (DOM) remained unchanged at 57. Austin and San Antonio each fell by two days while Dallas has remained at 50 days for two months. San Antonio continues to have the highest days on market among the Big Four with 71 days followed by Austin at 65 and Houston and Dallas have continued to average 50. 

The number of active listings went up from 111,053 to 116,404 (4.8 percent). The level of active listings increased across three of the Big four with Dallas (7.3 percent) and Austin (6.3 percent) leading the way with 26,758 and 11,604 listings, respectively.

Pending listings during May have been on a decline of 7.5 percent. All the Big Four except Houston experienced a substantial decline during this month. San Antonio pending listings fell the most dropping 10.6 percent followed by DFW and Austin dropping 8.4 and 7.8 percent, respectively. Houston was the only major city that experienced an increase in pending listings of less than 1 percent. The slowdown in sales and pending listings have contributed to the higher-than-normal active listing count.

Interest Rates Dip Slightly

Treasury and mortgage rates remain below their peak 2023 levels but have been increasing since the start of the year. The average ten-year U.S. Treasury Bondyield fell six basis points to 4.48 percent. The Federal Home Loan Mortgage Corporation’s 30-year fixed-rate fell by two basis points to 7.52 percent.

Housing Highlight

Outside of Hurricane Harvey (and a data anomaly in June 2019), Houston’s single-family housing starts were relatively stable month to month during the 2010s, exhibiting a slight downturn during the 2015 oil bust followed by a steady upward trend in the latter half of the decade. Figure 1 illustrates the trend breaks and increased volatility that characterized the COVID-19 pandemic and post-pandemic eras. Historically, low interest rates and a shift in preferences toward more living space (for both health concerns and work-from-home accommodations) fueled demand for single-family housing. Homebuilders, who also leveraged lower costs of financing, responded with a surge in single-family housing starts to levels not seen since the onset of the Great Recession.

The Federal Reserve’s interest-rate hike in March 2022 marks a transition in the post-pandemic period, when housing starts descended and bottomed out at decade-level lows. In the second half of 2023, however, Houston housing starts trended near pre-pandemic levels, and activity surged to a record-high in March 2024. Despite correcting downward from the spring-time surge, the volume of starts remained above pre-pandemic levels. Figure 2 plots the intra-year progression of single-family start totals, highlighting the current trajectory in context of pre-pandemic, COVID-19 pandemic, and post-pandemic economic conditions. Houston is on a record-setting pace for single-family housing starts in 2024, but economic disruptions from Hurricane Beryl and projections of a hyper-active hurricane season present headwinds and short-run uncertainty.

Single-Family Starts and Permit Declining

Texas’ number of single-family construction permits decreased by 2 percent MOM, reaching 13,539 issuances. San Antonio had the biggest monthly increase adding 1,048 permits or 9.7 percent. Houston had a slower month for permits with a decline of 15 (4,098) percent, following a big increase in April. Dallas decreased by a negligible 0.4 percent (4,207). Austin experienced a modest increase of 1.7 percent (1,409). 

Construction starts declined according to data from Dodge Construction Network. Seasonally adjusted single-family starts decreased by 3.09 percent MOM to 13,290 units. After a massive drop in April of 27 percent, there was a slight upward swing in single-family starts for Houston of 2.8 percent (4,452). Dallas dropped by 17.8 percent (3,451) while San Antonio and Austin reported modest increases of 3.2 percent (892) and 1.6 percent (1,420), respectively.

The state’s total value of single-family starts climbed from $11.8 billion in May 2023 to $16.65 billion in May 2024. Houston accounted for 36.4 percent of the state’s total starts value followed by Dallas with 26.4 percent. 

Home Prices Unchanged

Texas’ median home price has remained stable at approximately $340,000 for four months (Table 2). The prices have remained stable this month with San Antonio and Houston increasing by 0.4 percent and 0.2 percent, respectively. Austin and Dallas both have declined by 0.4 percent. Despite there being an increase in new listings and active listings, housing prices have remained resilient.  The Texas Repeat Sales Home Price Index (Jan 2005=100) grew 0.4 percent MOM and 2.2 percent year over year (YOY). Austin’s annual appreciation remains below the state’s average, falling by 1.5 percent YOY.

Source: Texas Housing Insight | Texas Real Estate Research Center (tamu.edu)

BY JOSHUA ROBERSON, RHUTU KALLUR, and WESLEY MILLER (July 17, 2024)
 
Avoid-Common-Closing-Delays

How To Avoid Common Closing Delays

Purchasing a home is a monumental event, but the journey from signing the contract to receiving the keys can be fraught with potential delays. Understanding these common issues and taking proactive steps to deal with them can help ensure a smooth and timely closing. Republic Title understands the intricacies of the home-buying process, having served the North Texas real estate community for over 30 years. As the market leader in title insurance with 11 conveniently located residential offices across North Texas, Republic can be your trusted authority to guide you through these potential closing delays.

Loan Requirements

One of the most critical aspects of purchasing a home is securing a mortgage. The loan approval process involves several steps, and delays often occur when buyers fail to promptly respond to lender requests. Lenders require various documents, including income verification, tax returns, bank statements, and proof of employment. To keep your closing date on track, it’s essential to:

  1. Respond Promptly: Return all requested documents as quickly as possible. Delays in providing these documents can slow down the underwriting process, leading to a potential postponement of your closing date.
  2. Complete Required Tasks: Follow through on any additional tasks your lender asks you to complete. This might include clarifying information or providing additional documentation.
Matt Visinsky

By staying organized and responsive, you can help your lender process your loan efficiently, reducing the likelihood of delays.

As Matt Visinsky, Senior Residential Counsel at Republic Title, advises, “Timely communication with your lender is crucial. Delays in submitting documents or answering questions from your lender can cascade into significant setbacks in the closing timeline.”

Tax Information

During the title process, the title company will search the property tax records for any delinquent taxes or unearned tax exemptions. If unpaid taxes or unearned exemptions are discovered, the seller may need to work with the County Appraisal District and/or Tax Office to resolve these issues before closing. Failure to promptly address these issues can result in the closing being delayed until the unearned exemptions can be removed and any resulting supplemental tax bills issued. Ensuring all your taxes and exemptions are current can prevent this common delay.

Power of Attorneys

Common Closing Delays

Using a Power of Attorney (POA) at closing may be necessary if you or the other party cannot be present. It also adds additional steps and requirements that must be meticulously followed:

  1. Approval: The title company and lender (if there is one) must approve the POA before closing.
  2. Delivery: The original POA document must be delivered to the title company at or before closing, as it needs to be recorded with the County Clerk before other closing documents.
  3. Verification: On the day of closing, the title company must be able to contact you in order to verify that you are alive, well, and have not revoked the POA. To avoid closing delays please make sure that you have provided the title company with your contact information so they can reach you on the day of closing.

By ensuring these steps are followed, you can avoid delays related to POA issues.

Common Names

If you have a common surname it may be necessary for you to provide the title company with information or documentation to prove that certain liens do not apply to you and are in fact filed against someone else with the same name. Please be sure to respond to any questions or requests for documentation timely in order to avoid delays.

Marital Status

Common Closing Delays

In Texas, a community property state that also has constitutional homestead rights, marital status can impact the closing process:

  1. Single to Married: If you purchased the property when single but are now married, your spouse will need to join in signing the deed at closing due to Texas Homestead Laws, so plan accordingly.
  2. Divorced: If you acquired the property while you were married and are now divorced you may need to provide the title company with a copy of the divorce. Depending on the language contained in the divorce it may be necessary to have your ex-spouse sign a deed.

Addressing these marital status issues in advance helps ensure a smoother closing process. “Marital status changes can affect property rights and closing requirements, explains Visinsky. “Being proactive about these changes can prevent delays.”

Out of Town Mail-Outs

If a Remote Online Closing is not possible and closing documents must be sent to a party to be signed outside of the office of the title company, follow these tips to avoid closing delays:

  1. Exact Signatures: Sign all documents exactly as requested. Failure to do so may result in the lender requiring the parties to re-sign all closing documents.
  2. Proper Notarization: Ensure all documents are properly notarized. If documents are sent out of the country it may be necessary to make an appointment at a US embassy or consulate to have your documents notarized. In some cases it may be possible to have a local notary acknowledge the documents. If you will be out of the country please communicate that to the title company early so they can help to guide you through the process.

By following these guidelines, you can avoid delays related to out-of-town mail-outs.

Review Important Documents

Several important documents must be reviewed before closing, including the Survey, Title Commitment, HOA documents (if applicable), and the Closing Disclosure. It’s crucial to:

  1. Timely Review: Review these documents promptly upon receipt and ask any questions at that time.
  2. Alert for Errors: Inform your Realtor and the title company of any errors or discrepancies immediately.

Timely review and communication can help rectify any issues before they become roadblocks, ensuring a smoother closing process. Visinsky emphasizes, “Careful review of all documents is essential. Early identification of errors can prevent last-minute complications.”

By understanding and proactively addressing these common issues that can lead to closing delays, you can help ensure a more seamless home-buying experience. Choosing Republic Title as your title company means partnering with North Texas’ market leader in title insurance, with over 30 years of expertise in the real estate community. Stay organized, responsive, and communicative with your lender, title company, and Realtor to navigate the closing process efficiently. With Republic Title, you can avoid many of the common pitfalls that lead to delays, bringing you one step closer to owning your new home.

Source: Republic Title Tip: How to Avoid Common Closing Delays – CandysDirt.com
Slide1

May 2024 DFW Real Estate Stats

In May 2024, real estate trends across several counties in the Dallas-Fort Worth area showed varied patterns.

In Collin County new listings increased by 22%, while active listings rose by 47% compared to the previous year. The average days on the market decreased by nearly 10% and the average sales price remained unchanged, but average price per square foot saw a 3.7% increase. Closed sales saw a slight uptick of 1.5% from the prior year.

In Dallas County new listings grew by 13.4%, and active listings saw a significant rise of 42.2% year-over-year. The average days on market increased by 9.4% while the average sales price surged by 16.4% to exceed $600,000. The average price per square foot increased by 7.6%, while closed sales decreased by 8.3% compared to the previous year.

In Denton County new listings increased by 8.7%, with active listings up by almost 34% from May 2023 and the average days on market decreased by 12.2%. The average sales price rose by 5.7%. and the average price per square foot showed a nearly 4% increase. Closed sales were slightly lower compared to the same period last year.

These statistics indicate a robust market with increased listings in most counties, fluctuating prices, and varying trends in days on market and closed sales. For more detailed statistics on Rockwall and Tarrant counties and condominium markets for all counties, take a look at our complete report and make it a great summer from your friends at Republic Title!

Our stats infographics include a year over year comparison and area highlights for single family homes broken down by county. We encourage you to share these infographics and video with your sphere.

For more stats information, pdfs and graphics of our stats including detailed information by county, visit the Resources section on our website at DFW Area Real Estate Statistics | Republic Title of Texas.

For the full report from the Texas A&M Real Estate Research Center, click here. For NTREIS County reports click here.

HousingInsightApril2024

Texas Housing Insight April 2024 Summary

Seasonally adjusted housing sales bounced back in April following March’s decline. New listings
grew for the fourth month in a row resulting in the total active listings count growing to its highest level since July 2012. Home prices remained the same at $340,000 for the second month in a row.

New Home Listings on the Rise

Texas witnessed a 5.9 percent increase in total seasonally adjusted home sales month over month (MOM), resulting in 29,212 homes sold (Table 1). All the major cities saw a slight increase in home sales. Previously, San Antonio had the highest decline at 9.2 percent, but looks to be recovering at an increasing rate of 8 percent—the highest among the Big Four, followed by Dallas at 4 percent.

New listings have been steadily increasing from December to April (2.8 percent) with only a slight decline of 0.5 percent in March. The April 2024 number stands at 47,000. Among the Big Four, Dallas has been declining for two months and is currently at 11,523 new listings. Austin, however, has increased by 25 percent between January and April.

The state’s average days on the market remained unchanged at 57. Austin fell by almost four days while Dallas rose by less than one. San Antonio is the only Big Four metro to experience an increase of a little over three days. As of April, San Antonio had the highest days on market of the Big Four, at 72 days. Austin followed at 66 days. Houston had the lowest at 46 days.

The number of active listings went up from 106,428 to 111,707 (4.9 percent) following the increase in new listings. Pending listings during April went up by only 0.6 percent. This growth was driven largely by Houston (10 percent) but offset by Dallas (5.6 percent) and San Antonio (3.3 percent). The Big Four experienced an upward trend in active listings with an addition of 1,555 for Austin (16.5 percent). Houston experienced a similar increased trend in active listings (10.7 percent) with an addition of 2,788 listings, almost five times that of the previous month. Dallas and San Antonio experienced relatively modest increases of 8.2 percent and 2 percent, respectively.

Interest Rates on the Rise

Treasury and mortgage rates remain below their peak 2023 levels but have been increasing since the start of the year. The average ten-year U.S. Treasury Bond yield jumped almost 33 basis points to 4.54 percent. The Federal Home Loan Mortgage Corporation’s 30-year fixed-rate rose by 17 basis points to 6.99 percent.

Housing Highlight

The housing market may be adjusting to a new normal that is characterized by an average 30-year fixed mortgage rate above 6 percent. Despite the persistence of higher mortgage interest rates, Texas’ residential mortgage activity is steadily improving as more pre-approved customers are searching for homes. Texas’ robust labor market and general economic strength are supporting housing demand despite scattered signals of financial distress across the nation. Financial vulnerability (e.g., rising credit card delinquencies) are currently concentrated on the lower end of the income distribution, where households are less likely to be prospective homebuyers. While that credit-health distinction somewhat shields the home-purchase market, it has broader implications for housing affordability and may carry consequences for the future economy.

Single-Family Starts Declining

Texas’ number of single-family construction permits increased by 0.9 percent MOM, reaching 13,805 issuances. After a massive dip in March, Houston has increased by almost 30 percent while all other major cities experienced moderate changes. Austin was the only city that had a fall of 5.9 percent (1,411) while San Antonio and Dallas experienced slight increases of 3.5 percent (953) and 1.6 percent (4,063), respectively.

Construction starts reduced according to data from Dodge Construction Network. Seasonally adjusted single-family starts decreased by 15.1 percent MOM to 13,731 units. Part of the pullback could be because February was such a strong month for starts, signaling an earlier-than-normal start to the construction home season. Houston had been experiencing an almost vertical increase from 56.8 percent in February, which began to slow down and has declined by 25.2 percent, while Dallas increased slightly by 10.7 percent (4,052). In contrast, Austin and San Antonio saw declines of 17.5 percent and 4.6 percent, respectively.

The state’s total value of single-family starts climbed from $9.15 billion in April 2023 to $13.19 billion in April 2024. Houston accounted for 36.2 percent of the state’s total starts value. Starts value activity is up from last year as Austin and San Antonio also posted moderate increases.

Home Prices Stabilizing

Texas’ median home price has remained stable at approximately $340,000 for two months (Table 2). However, across most major metropolitan areas, home prices saw a decline. Notably, Austin experienced an increase of 5.1 percent, moving the price from $421,572 to $443,247. Austin had the highest increase among the four major cities with a price change of $21,675. Prices increased by 2.1 percent in Houston and by a mere 0.7 percent in Dallas. San Antonio is the only city among the Big Four to experience a decline (0.9 percent).

The Texas Repeat Sales Home Price Index (Jan 2005=100) grew 0.9 percent MOM and 2.6 percent year over year (YOY). Austin’s annual appreciation remains below the state’s average, falling by 2 percent YOY.