republic title-56

Republic Title Tip: Understanding Survey Deletion Coverage in Texas

When navigating complex property transactions in Texas, having a trusted partner like Republic Title can make all the difference. Republic Title has long been recognized as a reliable resource for homeowners and real estate professionals, offering invaluable insights and solutions for various issues, including the critical aspect of survey deletion coverage. In this article, we will provide a comprehensive understanding of this essential component of title insurance.

What is Survey Deletion Coverage?

Survey deletion coverage, also known as survey coverage or survey amendment, covers any errors and omissions by a surveyor. This coverage provides assurance the survey of the property is accurate, that all improvements are accurately depicted, and that the property lines are properly defined.

Equally important — what survey coverage does not insure. Survey coverage does not insure against matters, conflicts, discrepancies, or encroachments that are shown on the survey. 

In a standard title policy there is an exception for “any discrepancies, conflicts, shortages in area or boundary lines, or any encroachments or protrusions, or any overlapping of improvements.” When survey coverage is purchased, the exception is revised to read only “shortages in area” which provides the insured with significant additional coverage, as explained below.  

What is Required to Obtain Survey Coverage?

To obtain survey deletion coverage in Texas, you typically need the following:

a. A current survey that accurately reflects the property lines, improvements, any easements, setback lines, or other items that are located on the property. If the Seller in a transaction has an existing survey it may be possible to use the survey as long as there have not been any changes to the property since the survey was prepared. If the Seller has an existing survey be sure to check the appropriate boxes in Paragraph 6 of the TREC 1-4 Family Contract (the “TREC contract”) and deliver the survey and the T-47 to the Buyer and Title Company within the number of days stated in the contract. The survey will be reviewed by the Title Company and must meet certain criteria and standards to be accepted. If an existing survey is not acceptable to the title company a new survey will be required, and the party responsible for that is negotiable and is set out in paragraph 6C(1) of the TREC Contract. 

b. A new survey may be required in certain circumstances. If the Seller does not have a survey, if they have made changes to the property since the last survey was done, or if an existing survey is not acceptable to the Title Company, a new survey would have to be ordered. The party responsible for paying for the new survey is negotiable, and is set out in Paragraph 6C of the TREC Contract. It is important to note that a new survey cannot be prepared until the title work has been completed, so keep that in mind when calculating the number of days the parties have in Paragraph 6 to provide the new survey.    

c. Request Survey Deletion Coverage: This is typically requested by checking the appropriate box in Paragraph 6A(8)of the TREC. The party who will be responsible for paying the premium for survey coverage is negotiable and can be set out in Paragraph 6A(8)(ii). The cost for survey coverage on a residential transaction is 5 percent of the basic premium. See the chart below for some examples of the cost:


Even with survey coverage, it is important to note that a Title Company will add any necessary exceptions for items disclosed on the survey thereby removing those items from coverage in the title policy even when survey coverage is provided. For example, if the survey shows that a fence encroaches on to the neighbor’s property, the Title Company will revise the title commitment to add an exception. The Buyer would have an opportunity under the TREC Contract to object to the new exception under Paragraph 6D of the TREC Contract. If no objection is made, and the Buyer purchases the property, and a dispute arises regarding the fence, it would not be covered under the Title Policy.  

Why is the Phrase “Shortages in Area” Not Deleted from the General Exception?

One notable aspect of survey deletion coverage in Texas is that the phrase “Shortages in Area” is not deleted from the general exception. This phrase is included in standard title insurance policies, and it signifies that the Texas Department of Insurance prohibits title companies from insuring exact acreage. In other words, the title insurance policy does not provide coverage for discrepancies in the property’s area or size.

The reason for not deleting this phrase is to take into account the fact that Surveyors and Appraisers may use slightly different methods and technologies to measure property area, and discrepancies can arise. By retaining the “Shortages in Area” phrase, it clarifies that the title insurance policy does not guarantee the property’s exact size, only the boundaries and encroachments.

What is the Benefit of Purchasing Survey Coverage?

The primary benefit of purchasing survey coverage is protection against unexpected boundary issues and encroachments. Here are some key advantages:

a. Legal Protection: Survey coverage offers legal and financial protection in case a dispute arises regarding the property’s boundaries or improvements. For example, if someone claims ownership of a portion of your land or that they have a right to use a portion of your land, the title insurance company will step in to defend your rights and potentially cover any financial losses.

b. Potential Cost Savings: In the event of a boundary dispute involving a matter covered in your title policy, the title insurance company may be required to cover legal expenses and potential settlements, saving you from bearing these costs yourself.

Why Should You Not Use Old Surveys When Buying a New Home?

Using old surveys when buying a new home can be risky for several reasons:

a. Changes Over Time: Property boundaries and improvements can change over time due to various factors, including renovations, construction of new structures, installation of new fences along a boundary line, or land erosion. An old survey may not accurately reflect these changes.

b. Encroachments: An old survey may not identify encroachments from neighboring properties or other issues that have developed since the survey was conducted. This could lead to boundary disputes and costly legal proceedings.

c. Title Insurance Requirements: Most title insurance companies require a current survey to provide survey deletion coverage. Using an old survey may result in the denial of coverage or additional costs to update the survey.

d. Lender Requirements: If you are obtaining a mortgage loan to purchase the property, your lender may also require a current survey to ensure the property’s boundaries, easements, and setback lines are accurately defined.

In Texas, survey deletion coverage is a crucial aspect of title insurance that can protect homeowners in certain property disputes and from financial losses related to property boundaries and improvements. Republic Title’s commitment to serving as a trusted resource for homeowners and real estate professionals is evident in its expertise and dedication to secure property transactions in Texas.


Source: Candysdirt.com – Republic Title Tip: Understanding Survey Deletion Coverage in Texas – CandysDirt.com
Sold Home For Sale Real Estate Sign in Front of Beautiful New House.

Republic Title Tip: Unlocking Savings with Texas Tax Exemptions for New Homeowners

Becoming a homeowner in Texas is a significant milestone, but it also comes with financial responsibilities. One aspect that new homeowners should be aware of is property taxes but here’s the exciting part: Texas offers a range of property tax exemptions that can save you money and make your homeownership journey even sweeter. In this post, our friends at Republic Title share how exemptions can save you significant money while guiding you through the process of applying for them. So, get ready to discover how you can maximize your savings as a homeowner in the Lone Star State!

Understanding Property Tax Exemptions

Property tax exemptions are a valuable tool designed to reduce the property tax burden for homeowners in Texas. These exemptions work by reducing the assessed value of your property, which in turn lowers the amount you owe in property taxes. It’s essential to be aware of the various exemptions available, as they can help you save money and improve your financial situation as a homeowner.

Different Types of Property Tax Exemptions in Texas

  1. Homestead Exemption:
    The homestead exemption is perhaps the most well-known property tax exemption in Texas. It is available to any homeowner who uses their property as their primary residence. After a homeowner purchases a home they will generally be able to apply for a homestead exemption starting on Jan. 1 of the year after acquisition. A recent change in the law allows homeowners to apply for the homestead exemption immediately upon acquisition if their seller did not already have a homestead exemption on the property for that tax year.
  2. Disabled Veteran Exemption:
    Disabled veterans in Texas are eligible for additional property tax exemptions on their homestead property based on their percentage of disability as determined by the U.S. Department of Veterans Affairs (the “VA”). The exemption can range from a partial reduction to a full exemption from property taxes. To qualify, veterans must have a service-connected disability rating of at least 10 percent from the VA.
  3. Over 65 Years of Age Exemption:
    Texans who are 65 years of age or older can apply for an additional property tax exemption on their residential homestead property. This exemption can provide a cap or freeze on school district taxes and can result in significant savings on property taxes. It’s important to note that this exemption can only be granted on property that is also the property owner’s homestead.
  4. Agricultural Exemption:
    If you own property that is used for agricultural purposes you may qualify for an agricultural exemption. This exemption is designed to support the state’s agricultural industry and can significantly reduce property taxes on agricultural land. To qualify, you must meet certain criteria related to agricultural use.
  5. Disabled Individual Exemption:
    Disabled individuals who are not veterans may also be eligible for a property tax exemption in Texas. To qualify, the disability must be certified by a relevant authority, such as the Social Security Administration, or a licensed physician.

How to File for a Tax Exemption in Texas

Now that you’re aware of the various property tax exemptions available in Texas, let’s explore how to apply for them:

  1. Homestead Exemption: An application must be completed and submitted to your county’s appraisal district. The application typically requires proof of residency, such as a driver’s license or voter registration card, and may have specific deadlines, so be sure to check with your local appraisal district.
  2. Disabled Veteran Exemption: The veteran must complete the necessary application and send it to the county appraisal district, and will need to provide documentation of their service-connected disability rating from the VA.
  3. Over 65 Years of Age Exemption: To claim the over 65 exemption on your homestead property, you must complete the application and send it to the county appraisal district to provide proof of your age, and complete any additional required paperwork. Documents that can be used to prove your age can include a birth certificate or driver’s license.
  4. Agricultural Exemption: Property owners seeking an agricultural exemption must demonstrate that their land is used primarily for agricultural purposes. Documentation such as farm income, agricultural productivity, and evidence of ongoing agricultural activities will be required.
  5. Disabled Individual Exemption: To apply for the disabled individual exemption, you must fill out the appropriate application form and send it to the county appraisal district and provide documentation of your disability.

It is important to note that the exemption forms can be found and downloaded or printed from most local county appraisal district websites.

Property tax exemptions in Texas can significantly reduce the financial burden of homeownership, making it an essential aspect of understanding for new homeowners. Whether you qualify for the homestead exemption, disabled veteran exemption, over 65 years of age exemption, agricultural exemption, or disabled individual exemption, taking advantage of these tax incentives can lead to substantial savings over time. To ensure you receive the tax relief you deserve, be sure to research the specific requirements for each exemption and file the necessary paperwork with your county’s appraisal district. By doing so, you can make the most of the opportunities available to you as a new homeowner in the Lone Star State. Check out Republic Title’s convenient resource with more information on tax exemptions and contact information for local appraisal districts.


Source: Candysdirt.com – Republic Title Tip: Unlocking Savings with Texas Tax Exemptions for New Homeowners – CandysDirt.com
Texas-Housing-Insight-November-2023

Texas Housing Insight November 2023 Summary

The housing market remains tight despite mortgage rates falling from their elevated levels. Home sales decreased just shy of 1 percent month over month (MOM). Prices did not fall alongside sales as most of the state experienced minimal change in prices. Construction permits plummeted in November despite construction starts increasing. Homes sat on the market for less time as average days on market continued its decreasing trend observed this year.

Home Sales Fall as Listings Increase

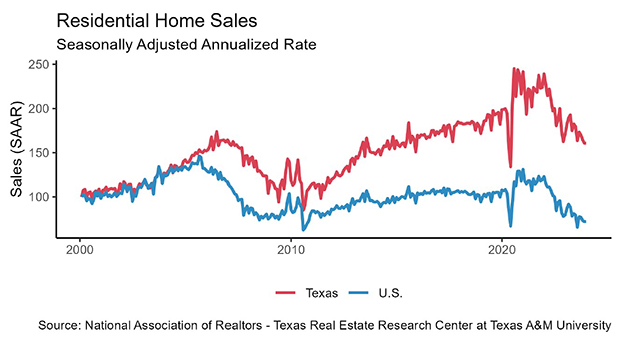
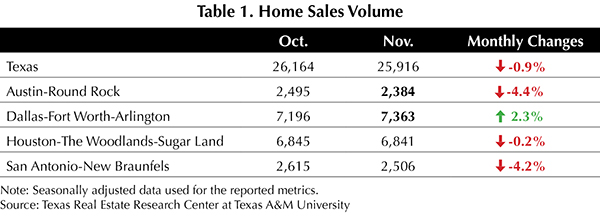
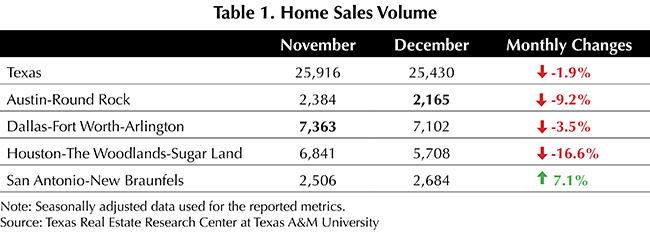
Mortgage rates fell this month, but their elevated level remains problematic for homebuyers as Texas’ total home sales fell 0.9 percent MOM to 25,916 sales in November (Table 1). Among the Big Four, Dallas reported the only increase in home sales, rising 2.3 percent to 7,363 sales. Austin fell 4.4 percent, and San Antonio reported its second straight month of significant decreases, plummeting 8.9 percent. The gap between Dallas and Houston widened as both continued to move in opposite directions. High mortgage rates have created an affordability problem, with people needing to spend more of their total income on affording a median-priced home.

The state’s average days on market (DOM) fell to 51, continuing the decline observed in 2023. For the past seven months, readings have gone from 59 to 51 days, indicating a shorter listing period. Among the major metros, Austin (75 days) and San Antonio (70 days) reported DOM significantly above the state average, while Houston (43 days) and Dallas (46 days) experienced minor fluctuations from the previous month.

Housing supplies are stocking up as active listings marked their sixth straight month of increases, climbing to 104,058 listings. This is the first time in four years supply has hit six-digit numbers. All four major metros posted monthly gains with Dallas adding 1,949 listings (9.1 percent) while Austin added fewer than a hundred homes for the third consecutive month. The constant increases since the start of 2023 have put the state’s active listings at January 2019 levels.

The state’s new listings rose 1.85 percent to 43,255 in November. San Antonio contributed heavily to this jump, rebounding from last month’s fall with a 9.4 percent increase. Dallas’s numbers remained unchanged from October. Amid the rise in active listings, the months of inventory (MOI) had a small increase to 3.7 months with all four major metros also posting small increases.

Mortgage Rates Fall from Peak Values

As news broke that the Fed might be finished with their rate hikes, treasury and mortgage rates fell. The ten-year U.S. Treasury Bond yield fell 30 basis points to 4.5 percent. Likewise, the Federal Home Loan Mortgage Corporation’s 30-year fixed-rate fell 18 basis points to 7.44 percent. The decreases across the board signal an increase in housing affordability.

Mixed Single-Family Construction Activity

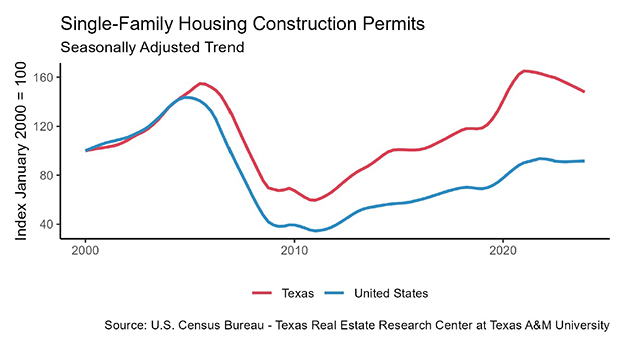
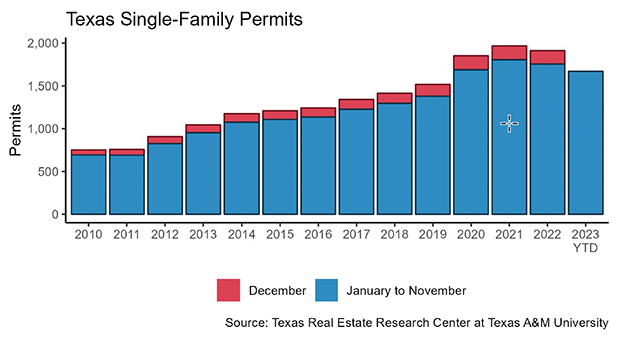
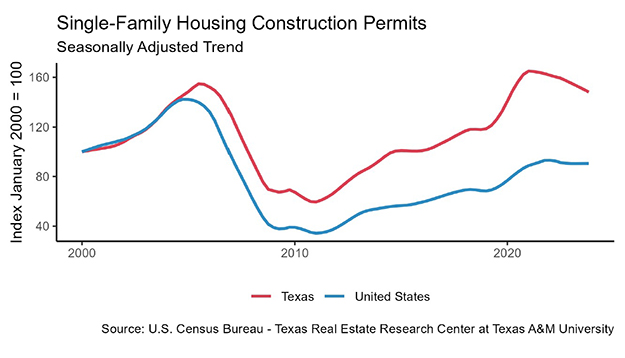
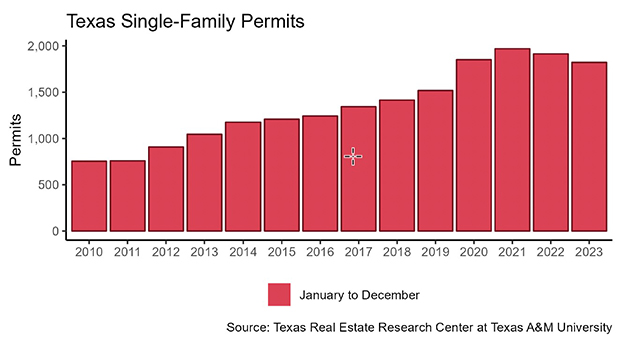
Texas’ single-family construction permits fell 1.7 percent MOM to 12,418 issuances. Both Austin and San Antonio had MOM dips falling 7 percent and 16 percent, respectively. Houston was essentially unchanged with only a 0.3 percent decline while Dallas grew by 1.3 percent.

Construction starts grew while construction permits fell, according to data from Dodge Construction Network. Single-family starts increased 1.1 percent MOM to 11,744 units. Both Dallas (3,393 starts) and Houston (3,510 starts) continued to outperform the rest of the state, combining for 58 percent of the total starts. Austin increased its lead over San Antonio, with 1,647 starts approaching a 3:1 ratio compared to San Antonio. Historically, Austin’s advantage has been about 2:1 in total starts.

The state’s year-to-date total single-family starts value climbed to $27.7 billion, up from $25.4 billion in October. Starts values have been mirroring 2019 values since May, remaining within $1 billion dollars from the observed 2019 values. Houston and Dallas both accounted for 30 percent of the state’s construction activity values.

Median Home Price Steady Across the Big Four

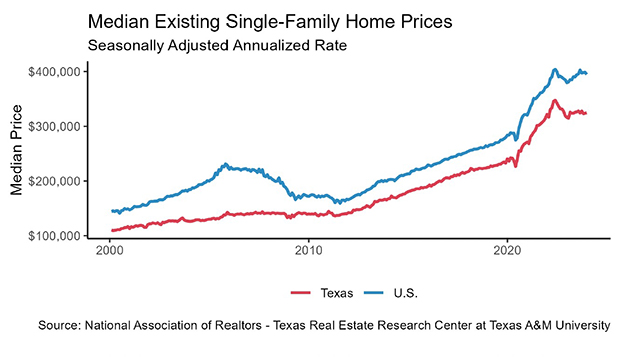
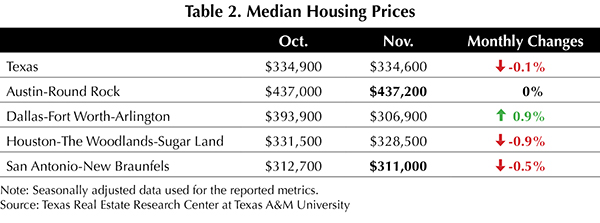
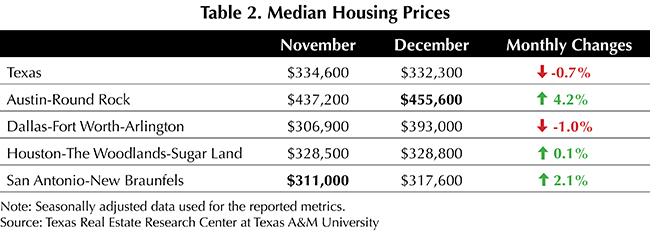
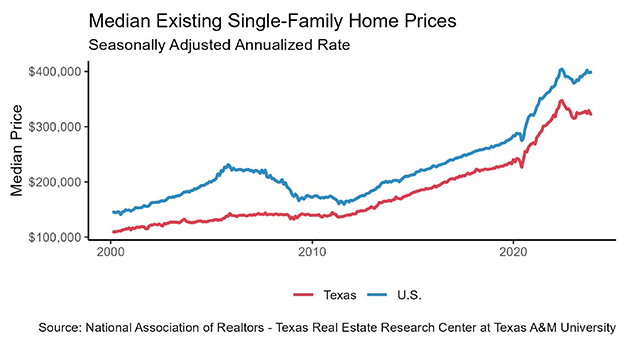
Texas’ median home prices recorded a modest decline, falling 0.1 percent to $334,600 (Table 2). All of the Big Four recorded marginal changes of less than 1 percent, with Dallas exhibiting the only increase in price at 0.9 percent. Austin’s home prices have come down significantly from the highly inflated 2022 prices, although remain elevated from pre-COVID prices.

Home prices continued to hover around $200,000-$300,000 and $300,000-$400,000, accounting for 26 and 24 percent of total home sales, respectively.

The Texas Repeat Sales Home Price Index (Dec 2004=100) fell 0.9 percent MOM but remains 2 percent up from the previous year. Houston had the highest annual appreciation at 2.6 percent YOY increase while Austin showed the lowest annual appreciation at negative 3 percent.

Source – Joshua Roberson and Koby McMeans (January 24, 2024)

https://www.recenter.tamu.edu/articles/technical-report/Texas-Housing-Insight

Texas-Housing-Insight-October-2023

Texas Housing Insight – October 2023 Summary

High mortgage rates continue to put downward pressure on the housing market, with Texas home sales decreasing 5.9 percent year-over-year (YOY). The average price fell alongside sales, with homes costing around $6,000 less than in September. Demand for new construction increased despite the high entry barrier into the housing market. Homes continue to sit on the market longer, increasing by a week since the start of the year.

Housing Demand Remains Weak

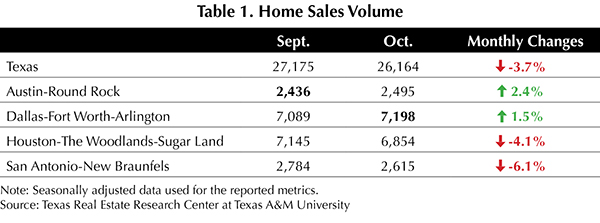
High mortgage rates continue to decrease demand for homebuyers, leading to Texas’ total home sales falling 3.7 percent to 26,164 sales in October (Table 1). The “Big Four” metros were split with Austin and Dallas experiencing gains while Houston and San Antonio fell significantly. Austin had the highest monthly elevation with a 2.4 percent growth rate while San Antonio plummeted by 6.1 percent. The gap between Dallas and Houston grew as they moved in opposite directions. High mortgage rates continue to increase the entry barrier for buyers, leaving only the most committed buyers in the market.

The state’s average days on market (DOM) enters its sixth month of decreases, falling from 59 days in February to 52 days in October, indicating a shorter listing period. Among the major metros, Houston (44 days) posted the only monthly decrease while San Antonio (70 days) posted the largest gain. Dallas (44 days) and Austin (68 days) remain unchanged from the previous month.

Housing supplies are stocking up as active listings marked their seventh straight month of increases, climbing 4.1 percent to 98,875 listings. All four major metros posted monthly gains with Houston (8.5 percent) adding 1,867 listings while Austin (0.9 percent) had a moderate gain of 84 listings. The constant increases since the start of 2023 have put the state’s active listings number at October 2019 levels.

The state’s new listings fell 1.45 percent to 42,100 in October. San Antonio contributed heavily to this decline, falling over 17 percent (790 homes). Amid the rise in active listings, the months of inventory (MOI) grew to 3.8 months with all four major metros posting marginal gains.

High Mortgage Rates Continue to Impair Affordability

The Fed’s effort to curb inflation has led to a substantial rise in both treasury and mortgage rates. The ten-year U.S. Treasury Bond yield grew for the sixth consecutive month reaching 4.8 percent. Likewise, the Federal Home Loan Mortgage Corporation’s 30-year fixed-rate increased to 7.62 percent, up 42 basis points. The inflated mortgage rate is expected to further raise the cost of homeownership, decreasing mortgage applications.

Single-Family Permit Levels Rebound

Texas’ single-family construction permits rose 1.1 percent month over month (MOM) to 12,619 issuances. All four major metros reported growing demand for permits except for Houston (4,007 units), falling 4.6 percent. Among the other three metros, both San Antonio (967 units) and Dallas (3,731 units) saw double-digit monthly percent gains at 31 and 24 percent, respectively. Austin rebounded from last month’s fall, climbing 8.7 percent to 1,643 units.

Construction starts grew alongside construction permits according to data from Dodge Construction Network. Single-family construction starts increased 1.2 percent MOM to 11,556 units. Both Dallas and Houston led with over 3,250 houses breaking ground, surpassing the combined total of other metros outside the Big Four. Home project starts in Austin (1,605 starts) and San Antonio (694 starts) surpassed the typical 2:1 ratio.

The state’s year-to-date total single-family starts value climbed to $25.4 billion, up from $22.8 billion in September. Starts values continued the previous month’s trend of mirroring the values observed in 2019. Houston and Dallas remain the largest contributors, accounting for more than half of the state’s construction activity values. Dallas’ market share rose to 30.2 percent, with Houston trailing at 29.7 percent.

Median Home Price Falls for First Time Since February

After last month’s spike in median home prices, October erased that increase with the housing market easing as the median home price fell 1.9 percent MOM, falling by over $6,000 from last month. Housing prices remained elevated, but this month they declined as all of the Big Four metros reported monthly decreases with Austin experiencing the greatest decrease at 3 percent. Dallas and Houston declined by over 1 percent while San Antonio declined the least at 0.7 percent (Table 2).

Due to the price rise, half of homes are now priced at $200,000-$300,000 or $300,000-$400,000, accounting for 26 percent and 24 percent of total home sales, respectively.

The Texas Repeat Sales Home Price Index (Dec 2004=100) moderated at a 0.1 percent MOM loss but was up 1.5 percent from the previous year. Austin had the lowest annual appreciation with a 5.7 percent YOY decrease while Houston showed the highest annual appreciation at 2.5 percent.

Source – Joshua Roberson and Koby McMeans (December 13, 2023)

https://www.recenter.tamu.edu/articles/technical-report/Texas-Housing-Insight

Prop-4-info

Proposition 4 – Property Tax Relief for Homeowners

The largest property tax cut in Texas history was passed on November 7, 2023. Here are the key points of the bill and what you need to know. 

  • HOMESTEAD EXEMPTION TO INCREASE FROM $40,000 TO $100,000 
  • UP TO AN ADDITIONAL $15,000 EXEMPTION FOR CERTAIN ELDERLY AND DISABLED HOMEOWNERS FOR THE 2023 PROPERTY TAX YEAR 
  • APPRAISAL REVIEW BOARD IN COUNTIES WITH A POPULATION GREATER THAN 75,000

  • A CAP ON ANNUAL APPRAISED VALUE INCREASES FOR CERTAIN NON-HOMESTEAD PROPERTIES

 For more detailed information visit the following resources:

Texas’ Proposition 4 would cut property taxes for homeowners, businesses | The Texas Tribune

Property-Tax Relief – Texas REALTORS® (texasrealestate.com)

Answering Your Questions About The Biggest Property Tax Break in Texas History – CandysDirt.com
 

Slide1

September 2023 DFW Real Estate Stats

In September 2023, active listings varied across counties. Collin County witnessed a 10% decline, Denton County experienced a 10% decrease, while Dallas County and Tarrant County saw increases of almost 4% and 3.7% respectively. Rockwall County noted a 4.5% reduction in active listings.

Regarding closed price per square foot, Collin County saw an increase of 2.3%, Dallas County experienced a 3% rise, Denton County remained flat, and Rockwall County and Tarrant County witnessed decreases of 3.6% and 1.1% respectively. Average days on Market are still up across the board over 2022 with Rockwall County having the largest increase of 97% increase.

In this ever-evolving real estate landscape, understanding local market trends is essential. Whether you’re buying, selling, or investing, our team is here to provide expert guidance tailored to your needs.

Our stats infographics include a year over year comparison and area highlights for single family homes broken down by county. We encourage you to share these infographics and video with your sphere.

For more stats information, pdfs and graphics of our stats including detailed information by county, visit the Resources section on our website at DFW Area Real Estate Statistics | Republic Title of Texas.

For the full report from the Texas A&M Real Estate Research Center, click here. For NTREIS County reports click here.
Texas-Housing-Insight-August-2023

Texas Housing Insight August 2023

August was a positive month for Texas’ residential real estate industry. Despite persistently high interest rates, total home sales picked up 9.5 percent on the consumer side, and construction permits accelerated by 5.3 percent on the supplier side. Amid the growth, the median price slipped for the first time after seven consecutive upticks. While the price drop seemed noteworthy, it was moderate at $800 and may reflect a balanced market. With many sellers stuck with pandemic-era low rates and many buyers struggling to keep up with rising costs, the housing market does not signal any significant volatility anytime soon.

Rebounded Home Sales Speed up Market Time by Two Days

Amid a slowdown in the real estate industry, Texas’ total home sales improved from last month’s three-year low after reaching over 27,000 transactions in August. The sales activity picked up at an impressive rate of 9.5 percent month-over-month (MOM), albeit the activity level was still 8 percent lower than last year’s reading. Sales ticked up uniformly this month in all four major metros, growing between 0.8 percent to 9.7 percent (Table 1).

Reduced home sales were mostly reflected by constrained sales of existing homes, while the new construction market hiked in demand. Sales for new construction grew by 20 percent in a year. Correspondingly, the market share of new construction sales climbed five percentage points to 21.7 percent. This indicates that for every five closed listings, one will be a new home. Both demand and supply factors contributed to the increasing trend for new homes. The shortage of existing homes is due to current owners’ reluctance to give up their homes in exchange for a higher-cost home.

After balancing at 57 days for two months, the state’s average days on market (DOM) dropped to 55 days, deviating from the steep rebounding trend that lasted for over a year. For the past six months, readings fluctuated between 55 days and 59 days. That small range suggests the housing market may be stabilizing. Among the major metros, Austin (69 days) and San Antonio (66 days) reported a longer-than-average DOM, while Dallas and Houston had DOM figures of 47 days and 48 days, respectively.

Housing supplies are stocking up, as active listings have trended upward since February, and the accumulation speed is accelerating. In August, the number of homes available for sales rose 5.9 percent, reaching 90,750 listings. The four major metros posted monthly gains between 4.4 percent and 5.2 percent, with Dallas leading the pack. The state’s new listings rose 5.7 percent to 40,620 units, with Austin contributing a double-digit jump and an increase of 642 units. Despite the rise in active listings, months of inventory (MOI) had a marginal loss to 3.2 months due to recouped home sales.

High Mortgage Rates Push Down Loan Applications by One Fifth

Since the Fed initiated the series of interest rates hikes, both treasury rates and mortgage rates have increased accordingly. The ten-year U.S. Treasury Bond yield has had an average yield of 3.8 percent in 2023, up from 3 percent in 2022 and 1.5 percent in 2021. The expectation of further rate hikes pushed the bond yield to a new high since the Great Recession in 2008 at 4.2 percent.

Elevated by the bond yield, the Federal Home Loan Mortgage Corporation’s 30-year fixed-rate inched up to 7.1 percent, up 23 basis points. The inflated mortgage rate is expected to further raise the cost of homeownership and decrease mortgage applications. Under the pressure of high mortgage rates, mortgage loan applications have fallen in 2023 with the annual high in January. In the past eight months, the Mortgage Bankers Association reported a volume index drop of over 20 percent. 

Momentum for Housing Inventories Might Be Forthcoming

Texas’ single-family construction permits rose 5.3 percent MOM to 13,160 issuances. This rise highlights August as the second month this year with more than 13,000 houses approved for construction. All four major metros reported growing demand except for San Antonio (630 permits), falling 16.4 percent MOM. Of the other three metros, Houston led with close to 4,500 permits, accounting for a third of the state’s total permits for future homebuilding. Dallas followed with 3,980 permits. Austin (1,717 permits), which had drastic construction slowdown with last year’s price correction, finally jumped out of the lows, reporting impressive rebounds with a double-digit growth rate.

Construction starts grew alongside construction permits. After five consecutive months of growth, single-family construction starts in Texas inched up to 11,950 units. Both Dallas and Houston led with over 3,300 houses breaking ground, surpassing the combined total of other metros outside the “Big Four.” Home project starts in Austin (1,810 starts) and San Antonio (810 starts) surpassed the typical 2:1 ratio.

The state’s total single-family starts value reached $21.2 billion, up from $18.8 billion in July. While the current starts value fell short of the peak during the 2020-22 pandemic frenzy, it mirrored the construction activity levels observed in 2019. Notably, Houston and Dallas remain pivotal players, contributing to more than half of the state’s construction activity values. Dallas’ market share rose to 27.6 percent, closely trailing Houston’s 27.7 percent share.

Price Gains Pause for the First Time This Year

This year’s steady price gains took a pause in August as Texas‘ median home price dipped. Despite the 0.3 percent MOM decrease, the seasonally adjusted price at $336,600 was still at a higher standing than the June reading. The state’s housing market signaled no large volatility, as the Big Four metros reported monthly changes of less than 0.5 percent. At the metro level, Austin’s median price remained elevated at $454,000, while Dallas followed with $396,500 (Table 2).

After reaching record prices last year, the four major metros have split into two groups with their price directions. Dallas and Houston—the two largest housing markets—had been regaining some strength in their median prices, inching up 2.4 percent and 1.8 percent year to date (YTD), respectively. Meanwhile, Austin and San Antonio had not yet geared up for a new price momentum, falling behind 0.6 percent and 0.3 percent YTD, respectively.

The Texas Repeat Sales Home Price Index (Dec 2004=100) peaked in July and stayed relatively stable in August. After suffering major price corrections earlier in the year, home price growth has gradually grown back to rates comparable to the peaks from last year.

Source – Joshua Roberson, Weiling Yan, and Koby McMeans (October 13, 2023)

https://www.recenter.tamu.edu/articles/technical-report/Texas-Housing-Insight

mudsPIDS

MUDS, PIDS, and Other Special Districts

The DFW area is home to some of the largest master planned communities and subdivisions in the country.  As these areas are developed, Municipal Utility Districts (MUDs), Public Improvement Districts (PIDs) and other special districts are often set-up to finance the construction of vital public infrastructure that does not yet exist.  The cost of the installation of this infrastructure is passed on to the final homeowners in the form of additional taxes that are paid after the community is developed.  It is important for new home buyers in the area to understand these special districts and how they work to avoid surprises.

 MUD- Municipal Utility Districts

What is it: A Municipal Utility Districts (MUD) is a governmental entity created to fund improvements, or infrastructure, or utility services to a designated area.  Typically, a MUD is created in an area outside city limits or outside where a city was previously providing utility services.

Notification Requirements:  Sellers of real property located in a MUD must provide a notice to buyers prior to the execution of the sales contract. The notice may be given separately or as an addendum to the contract.

How do I find out if a property is in a MUD? A MUD is created under the authority of the  Texas Commission of Environmental Quality (TCEQ). To find out if an address is in a MUD, you may search the address online: https://www.tceq.texas.gov/gis/iwudview.html.   As of June 18, 2023, a MUD is required to make the completed notice available online, as well as file them with the county Real Property Records.

PID- Public Improvement Districts

What is it: A Public Improvement Districts (PID) is a special district created by a city or county to pay for improvements such as landscaping, parks, lakes and fountains and other recreational and pedestrian improvements. With a PID, a specific area receives funds for the improvements, and owners of the benefited land pay back the amount.  This amount may be paid upfront or over a course of time, until the full amount is paid off.  Unlike HOA dues, a PID may be tax deductible.

Notification Requirements: Sellers of real property located in a PID must provide a notice to buyers prior to the execution

of the sales contract. The notice may be given separately or as an addendum to the contract. A separate copy of the notice must be signed notarized and recorded at closing.  

How do I find out if a property is in a PID? PIDs may appear on the County Appraisal District’s website, on Seller’s tax bills, or on the PIDs website.  The PID is also required to file a copy of the notice in the county Real Property Records.

TIF-Tax Increment Financing

What is it: Tax Increment Financing (TIF) is a tool that incentivizes economic development of a specific area called a Tax Increment Reinvestment Zones (TRIZ) or TIF Districts.  Cities, alone or in partnership with other taxing units, can use a TIF to pay for improvements to a zone in an effort to attract new development.

Notification Requirements: Seller is not required to notify a buyer if a property is in a TRIZ.

How do I find out if a Property is in TRIZ? The governing body of the city or county that created the Tax Increment Reinvestment Zones TIRZ must send an annual report detailing the TIF project’s progress to the chief executive officer of each taxing unit participating in the TIRZ and to the Texas Comptroller of Public Accounts.  There are currently 19 active TIRZ Dallas and 11 in Fort Worth.

WCID- Water Control and Improvement District

What is it: A Water Control and Improvement District (WCID) is a special district that provides water, wastewater and drainage services to a specified area.  Both a WCID and a MUD are types of Water Districts controlled by TCEQ.

Notification Requirements:  Sellers of real property located in a WCID must provide a notice to buyers prior to the execution  of the sales contract. The notice may be given separately or as an addendum to the contract.

How do I find out if the property is in a WCID? Property address may be searched thru TCEQs website: https://www.tceq.texas.gov/gis/iwudview.html.

Realtor Tip:  All required notices given prior to the execution of the contract should be listed in the contract or are attached to contract at the time of signing. (See paragraph 6E(11) of the TREC One to Four Family Residential Contract.)

Texas-Housing-Insight-July-2023

Texas Housing Insight July 2023 Summary

The persistent rise in mortgage rates continued to exert a cooling effect on the housing market. Texas’ home sales experienced an 8.4 percent year-over-year decline in July. Despite this diminished home demand, the scarcity of existing home sales contributed to a 2.1 percent increase in the state’s median price in 2023, leaving the index for shelter the greatest driver behind the escalating living costs. While existing home sales declined, residential construction starts continued to climb. At the same time, permits have fallen for several consecutive months, signaling a possible decline in starts in the near future.

Housing Market for New Construction in High Demand

More prospective buyers are dissuaded from making a home purchase in today’s high-interest environment, leading to a drop in sales. Compared with last month’s reading at 28,000 and July 2020’s record high at 38,400 transactions, Texas’ total home sales fell below 26,000 transactions this month. Monthly sales volume contracted 8.4 percent month over month (MOM) and 32 percent in three years (Table 1).

Despite the reduced housing demand, the market share of new construction sales ballooned. Within a year, the share of new construction sales rose from 15.2 percent to more than 20 percent, indicating every five closed listings is now a new home. Both demand and supply factors contributed to the increasing trend for new homes. The shortage of existing homes is due to current owners’ reluctance to give up their current homes. For more information on Austin’s new construction, read “Austin Home Price Illusion” at https://www.recenter.tamu.edu/articles/tierra-grande/Austin-Home-Price-Illusion-2378.

Texas’ average days on market (DOM) stayed at 56 days for the second straight month, deviating from the steep rebounding trend that lasted for over a year. The current reading is merely three days short of the five-year average before 2020, which stood at 59 days. The consistent reading suggests that the housing market may have reached a state of equilibrium. Among the major metros, Austin and San Antonio reported a longer-than-average DOM of 69 days, while Dallas and Houston had DOM figures of 46 days and 49 days, respectively.

The number of active listings rose to 2.3 percent, reaching just above 85,000 listings. All four of the major metros posted positive monthly gains with Dallas accounting for the largest gain at 5.7 percent MOM while Houston remained at last month’s level with a 0.4 percent MOM game. Conversely, the state’s new listings dipped by 12.7 percent to 36,880 units, with Dallas contributing significantly to this double-digit decline by registering a decrease of 1,800 units in July. Amid the rise in active listings, months of inventory (MOI) had a marginal gain to 3.3 months.

Since the Fed hiked interest rates by another quarter point, both treasury rates and mortgage rates increased in July. The ten-year U.S. Treasury Bond yield grew 15 basis points, reaching 3.9 percent. Likewise, the Federal Home Loan Mortgage Corporation’s 30-year fixed-rate increased to 6.8 percent, up 13 basis points. The inflated mortgage rate is expected to further raise the cost of home ownership and decrease mortgage applications.

Single-Family Permit Levels Continue to Drop

Texas’ single-family construction permits shrank to 12,240 applications in July after seasonal adjustment, marking a 3 percent MOM decrease. Houston’s (4,070 permits) contribution to the monthly shrinkage was prominent, as permits plummeted 17.8 percent MOM. Although Austin (1,380 permits) reported the largest rebound of 34.3 percent MOM, the gain was not enough to cover half of Houston’s loss. Dallas (3,540 permits) and San Antonio (760 permits) maintained their activity levels like June.

Construction starts had not yet reflected the decline in construction permits. After three consecutive growths, single-family construction starts in Texas balanced at 11,450 units. Both Dallas and Houston led with over 3,200 houses breaking ground, surpassing the combined total of other metros outside the “Big Four.” The ratio between home projects in Austin (1,580 starts) and San Antonio (810 starts) remained at approximately 2:1.

The state’s total single-family starts value reached $18.8 billion, up from $15.9 billion in June. While the current starts value fell short of the peak during the pandemic frenzy in 2020-22, it aligned with construction activity levels observed in 2019. Notably, Houston and Dallas remain pivotal players, contributing to more than half of the state’s construction activity values. Dallas’ market share rose to 27.6 percent, closely trailing Houston’s 27.7 percent share.

Steady and Modest Price Gains Amid Sales Decline

The low supply of homes had supported price gains, and the steady uptick in Texas’ median home prices, including both new and existing homes, moderated from 0.4 percent in the first five months to 0.2 percent in June and July. Three of the Big Four metros reported monthly changes of less than 1 percent, indicating price stability for the state’s housing market. Austin’s median price remained more elevated than all other metros at $454,000 (Table 2). Dallas followed with $398,300.

Amid Austin’s recent price volatility, this metro was still approximately 10 percent below last year’s $507,400 median price. Meanwhile, the state along with the other major metros narrowed the gap to 1 percent, down from 5 percent in June. These changes indicate the real estate industry has nearly reached a full recovery from the price correction observed in the second half of 2022.

Since the dip from July to December 2022, the Texas Repeat Sales Home Price Index (Dec 2004=100) had reverted to the trend. Though the acceleration slowed to 0.7 percent YOY, the index balanced at 229.4, beating June 2022’s record-high reading when the annual increase was at an astonishing rate of 16.5 percent YOY. The elevated index corroborates a rebound in home price appreciation in 2023.

Despite the challenge of high mortgage rates and reduced housing demand, the market share of new construction sales surged. Within a year, the share of new construction sales rose from 16.3 percent to more than 20 percent, indicating every five closed listings is a new home. Both demand and supply factors contributed to the increasing trend for new homes. The shortage of existing homes is due to current owners’ reluctance to give up their current homes, while the state’s consistent home demand, fueled by a growing population, is spurring new construction orders.

Texas’ average days on market (DOM) stayed at 56 for the second straight month, deviating from the steep rebounding trend observed for over a year. The current reading is merely three days short of the five-year average before 2020, which stood at 59 days. The consistent reading suggests that the housing market may have reached a state of equilibrium. Among the major metros, Austin and San Antonio both reported a DOM of 71 days, while Dallas and Houston had DOM figures of 52 days and 49 days, respectively.

Steady and Modest Price Gains Amid Sales Volatility

Texas’ median home prices continued to show its strength by increasing 0.3 percent to $337,900 (Table 2). Austin recorded the largest monthly gain of 4.2 percent, reaching a price peak in the past nine months. The remaining three metros recorded changes of less than 1 percent.

Despite Austin’s price hike in June, this metro was still close to 10 percent below last year’s record high, facing the largest price gap. Meanwhile, Dallas, Houston, and San Antonio had less than 5 percent to bridge. These price drops indicate the real estate industry still has room to recover from the price correction observed in the second half of 2022.

The Texas Repeat Sales Home Price Index, which accounts for compositional price effects and provides a better measure of change in single-family home values, showed a slight advance of 0.3 percent MOM and 0.1 percent YOY. Houston had the highest annual appreciation with 1.6 percent YOY increase, while Austin remained balanced with no YOY changes.

Mortgage rates typically follow Treasury rates, and both increased in June. The ten-year U.S. Treasury Bond yield grew 18 basis points, reaching 3.8 percent. Likewise, the Federal Home Loan Mortgage Corporation’s 30-year fixed-rate increased moderately to 6.7 percent, up 28 basis points. With the Fed resuming their increasing of interest rates in July, both the bond and the mortgage rates also grew.

Source – Joshua Roberson, Weiling Yan, and Koby McMeans (September 7, 2023)

https://www.recenter.tamu.edu/articles/technical-report/Texas-Housing-Insight

TaxCut

Texas House and Senate Agree to Largest Property Tax Cut in Texas History

On August 9th, Governor Greg Abbott ceremonially signed legislation delivering the largest property tax cut in Texas history – $18 billion – passed during Special Session #2 of the 88th Legislature in New Caney. Under Senate Bill 2 and Senate Bill 3, $18 billion of Texas’ historic budget surplus will be allocated toward driving down school district property tax rates, increasing homestead exemptions for Texas homeowners, and increasing Franchise Tax exemptions and appraisal caps for small businesses.

Senate Bill 2 provides property tax relief through tax rate compression, an increase in the homestead exemption, and a pilot project limiting the growth in appraised values. For tax year 2023, this will save the average Texas homestead owner over $1,200. Texas homestead owners over 65 or with a disability will see over $1,400 in savings.

Senate Bill 3 law increases the Franchise Tax “no tax due” threshold to $2.47 million and removes burdensome filing requirements for those who do not owe tax. 

The constitutional amendment to provide the largest property tax cut in Texas history will be added to the Texas Constitution if approved by a simple majority of Texas voters on November 7, 2023.

For more information, visit Governor Abbott Signs Largest Property Tax Cut In Texas History | Office of the Texas Governor | Greg Abbott