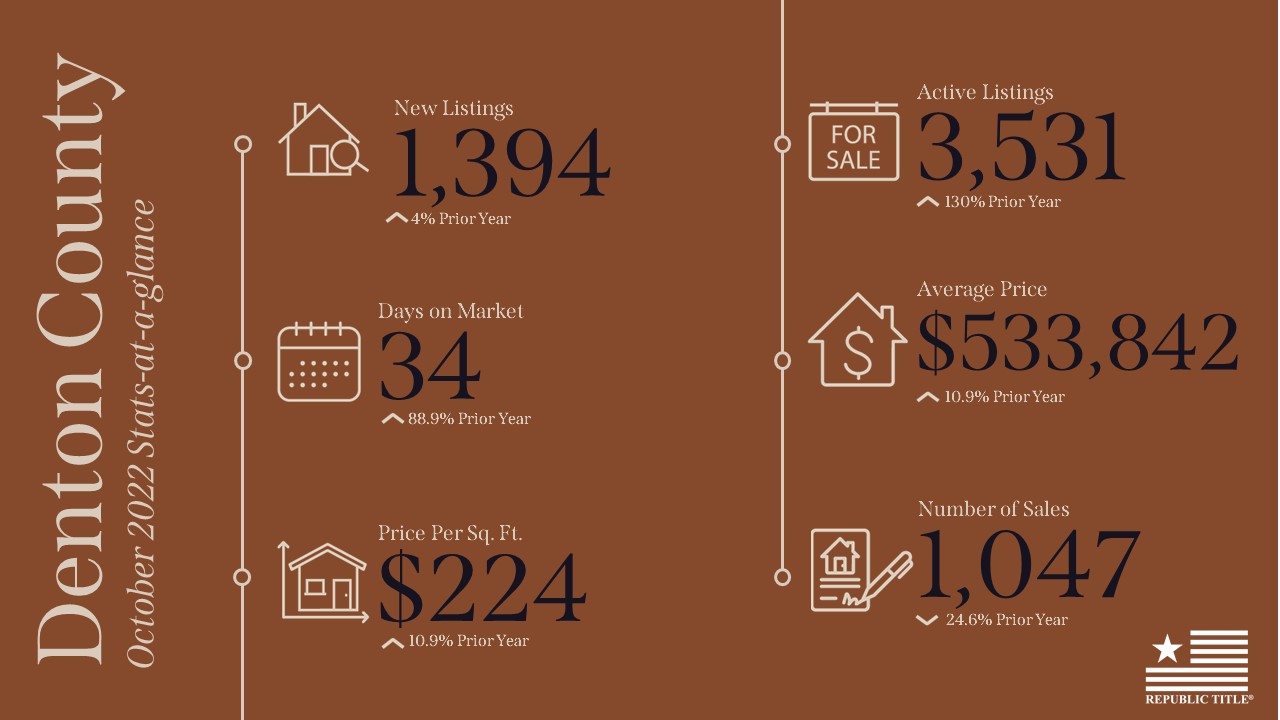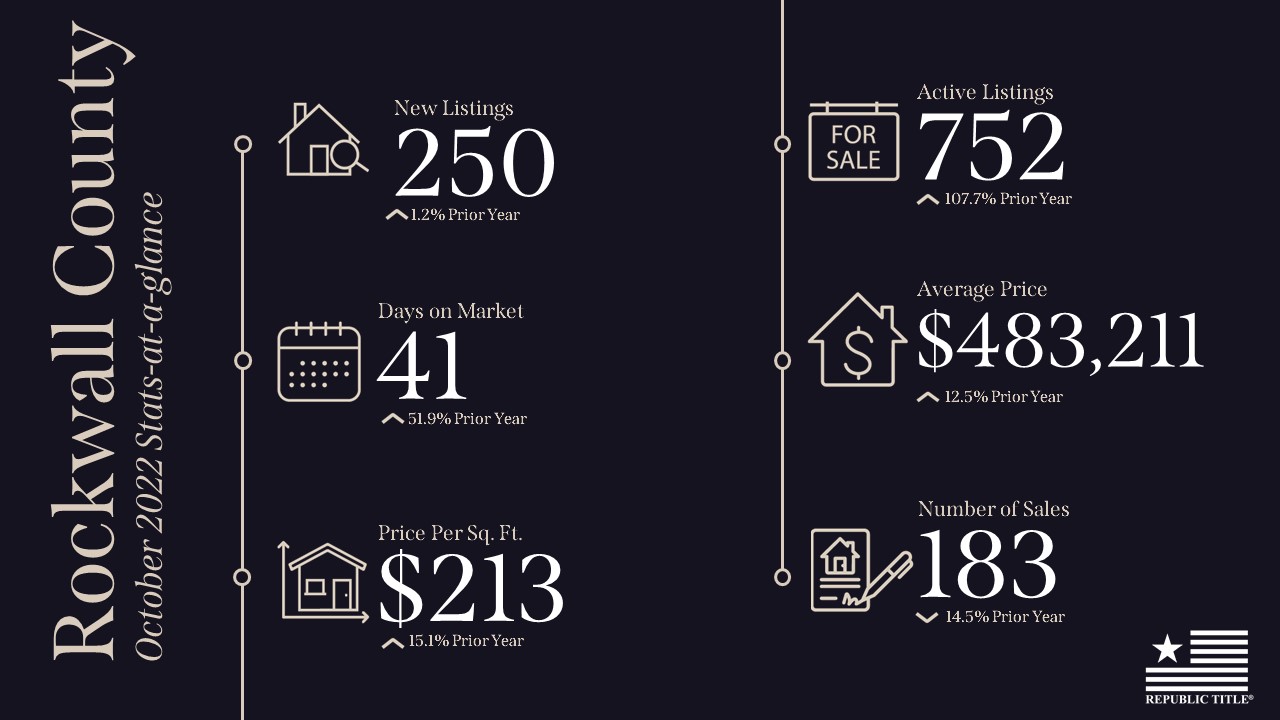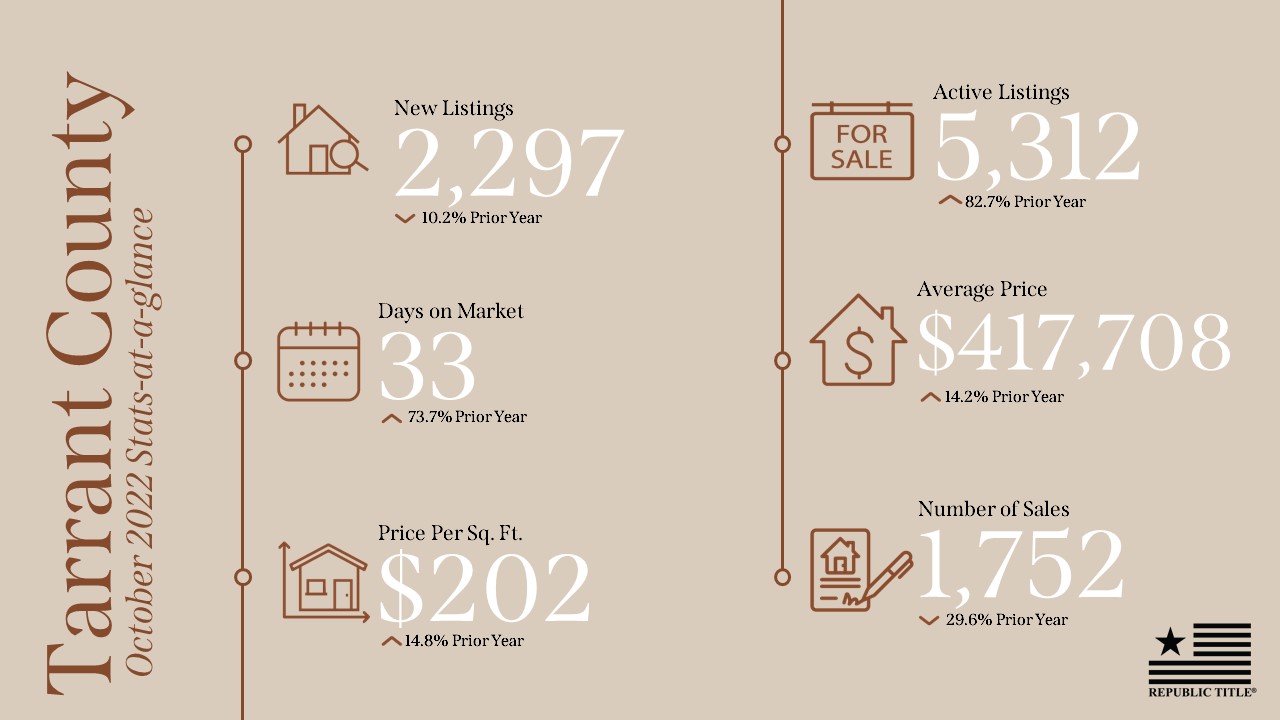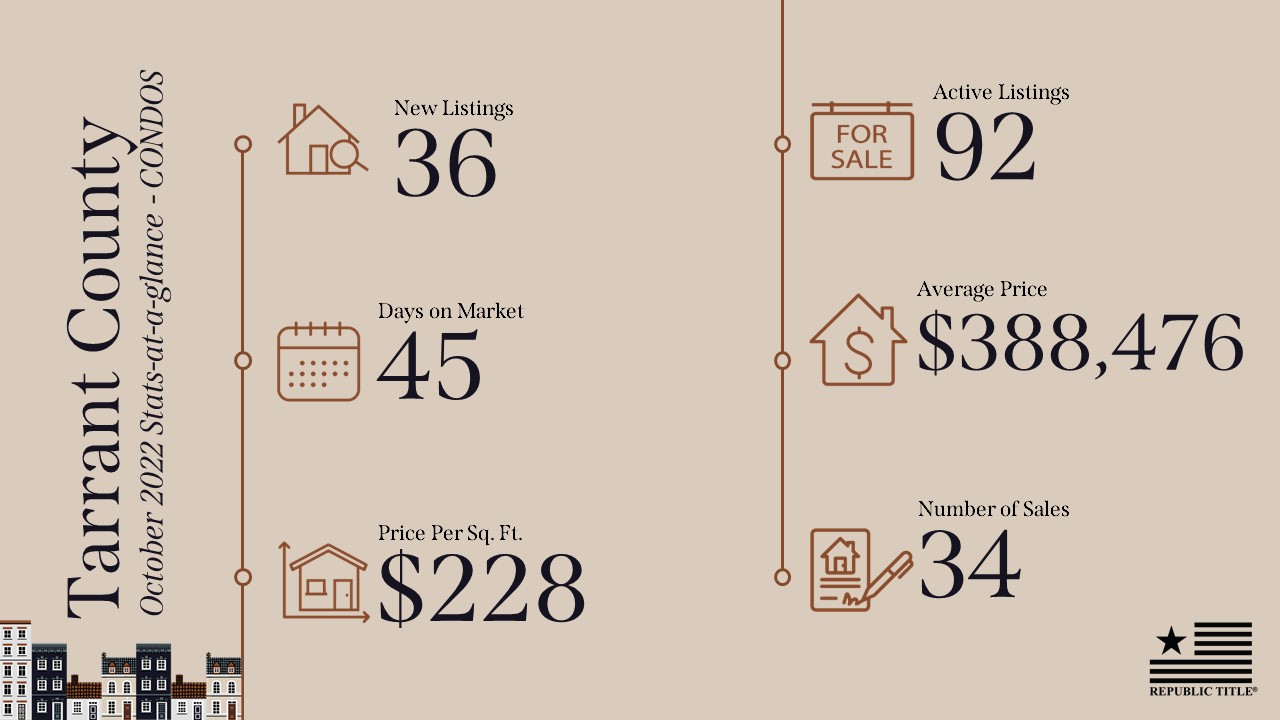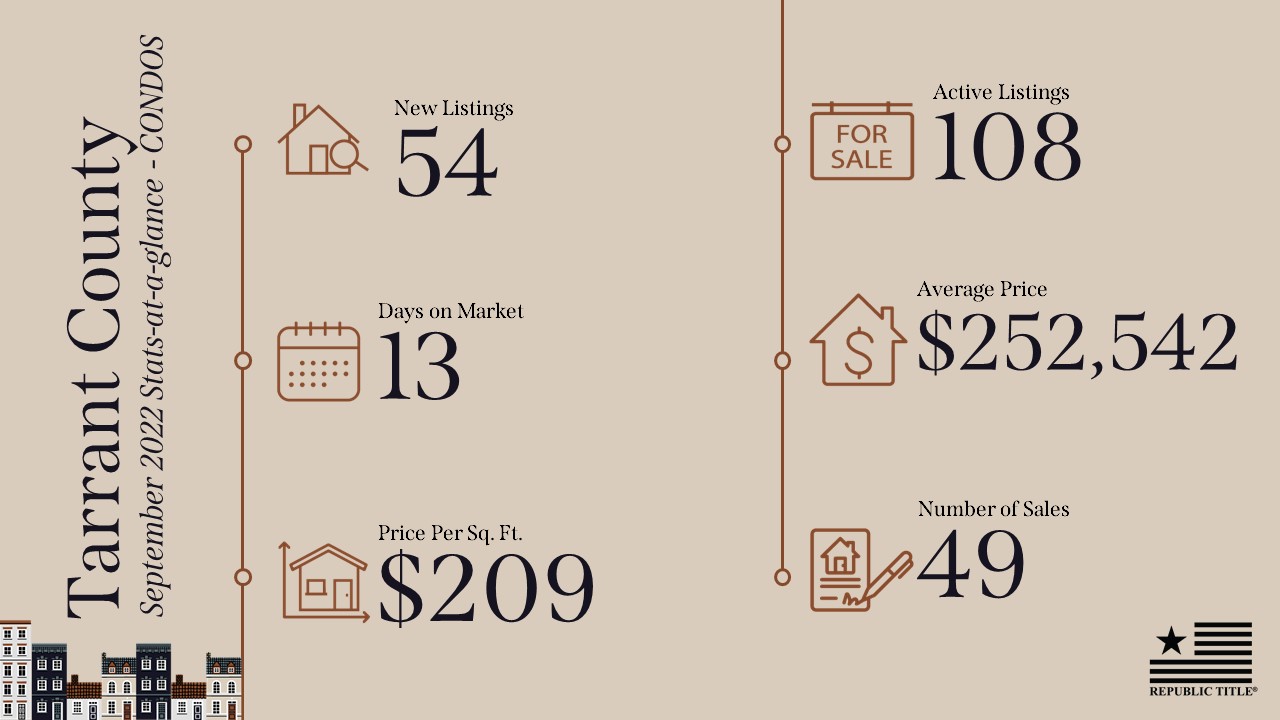

February’s housing market shows 2023 has returned to normal seasonal trends, something not experienced since 2019. Housing sales are back on trend with increases for the month, as are construction starts and permits. Rebounding to pre-pandemic levels means sales and construction activity are still decreased compared with the previous two years. This is likely due to inflated mortgage rates and high inflation. Days on market (DOM) increased across all major metros as inventory rose because of deflated demand. All of these factors point to a cooling housing market and a return to form.
Supply* Rises as Inventory Gains Ground
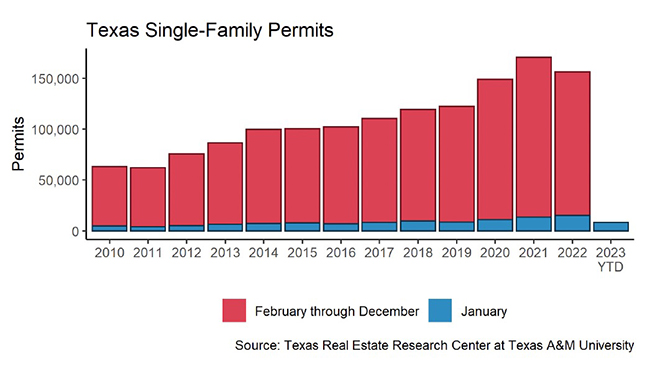
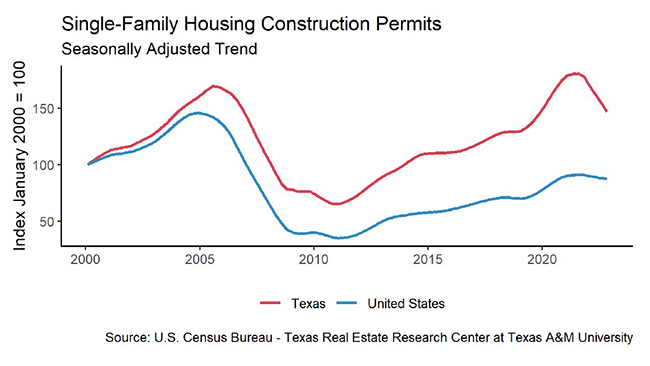
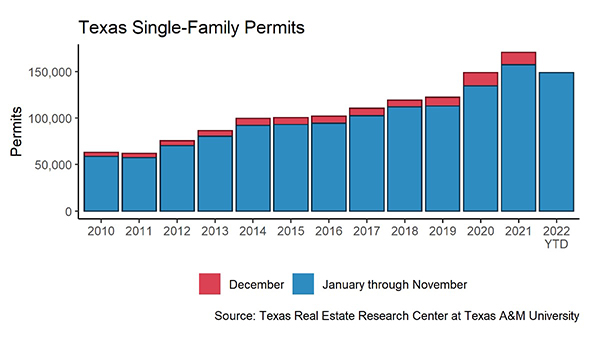
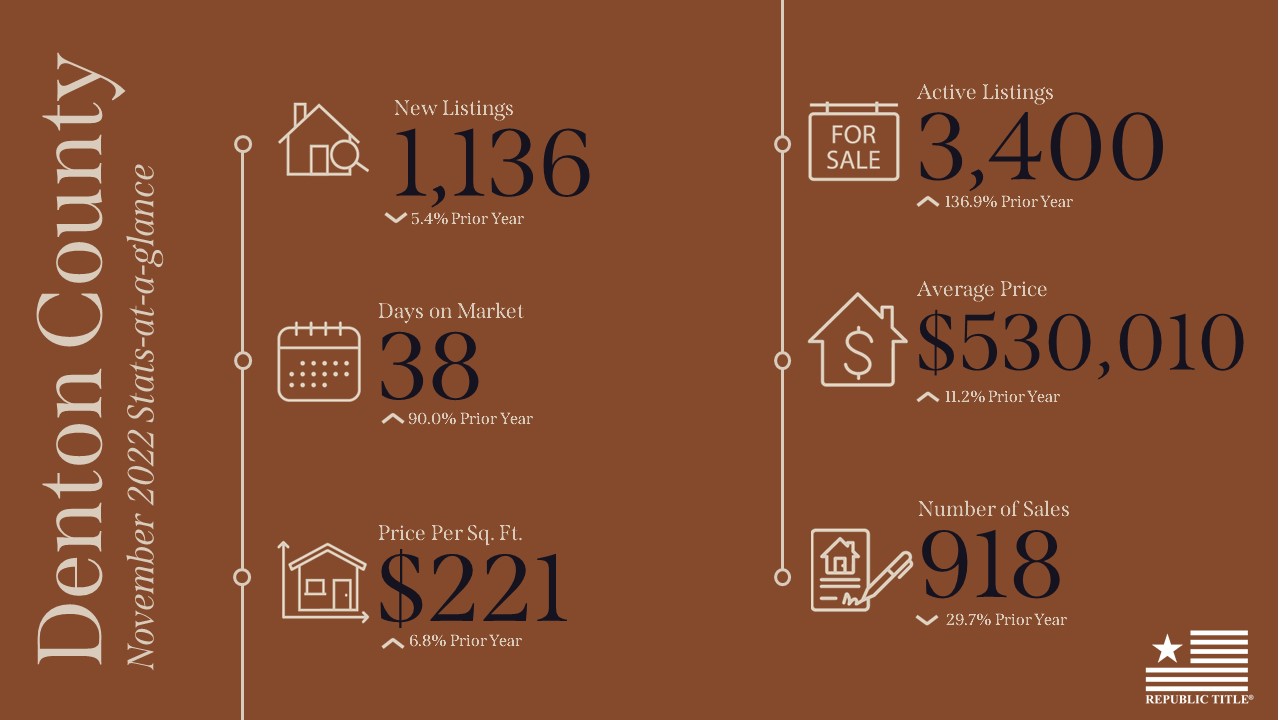
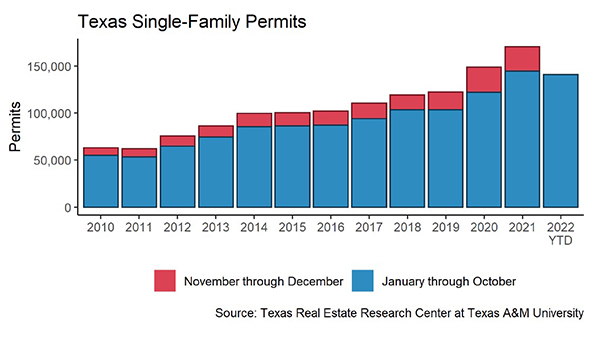
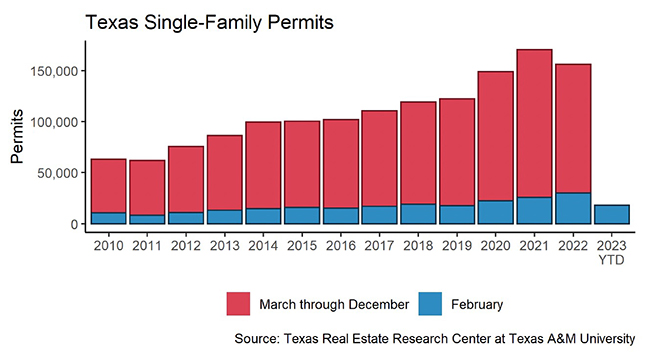
Single-family construction permits reversed their course for February, gaining significant ground with a 17 percent increase month over month (MOM). All four major metros contributed to the statewide rise, as they all had positive gains for February. Houston led the way with a 33 percent increase over last month (3,793 permits), while Austin lagged the rest with a 0.7 percent gain (1,160 permits).
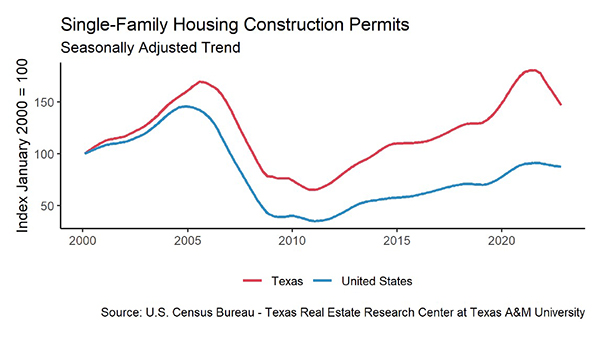
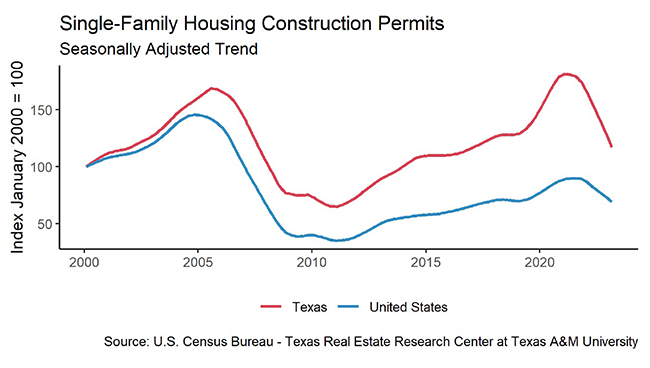
Construction generally hits a seasonal low in December, and peaks in March or June. Single-family construction starts are following this trend with a seasonally adjusted MOM increase of almost 2 percent. December’s low point reached levels not seen since 2015, due in large part to the drastic increase in mortgage rates. March starts, around 9,200 according to Dodge Data & Analytics, pale in comparison to the previous two March levels, which were record-breaking peaks at the time.
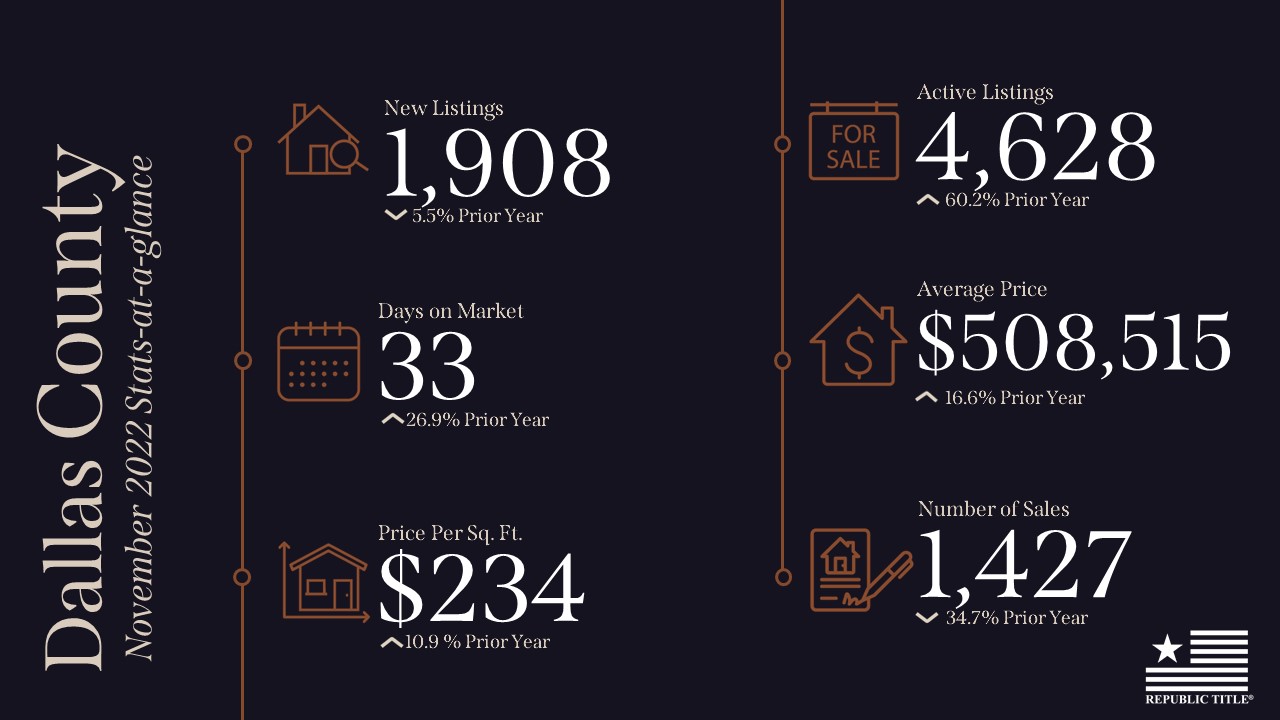
The state’s total single-family starts value reached $4.3 billion in February, down from $7.5 billion in February 2022. Houston and Dallas-Fort Worth (DFW) are responsible for more than half of that. Houston continues to account for the largest portion of Texas’ construction values with 29 percent of the market share. DFW accounts for 25 percent. Austin and San Antonio remained on par with previous years’ market percentage shares.
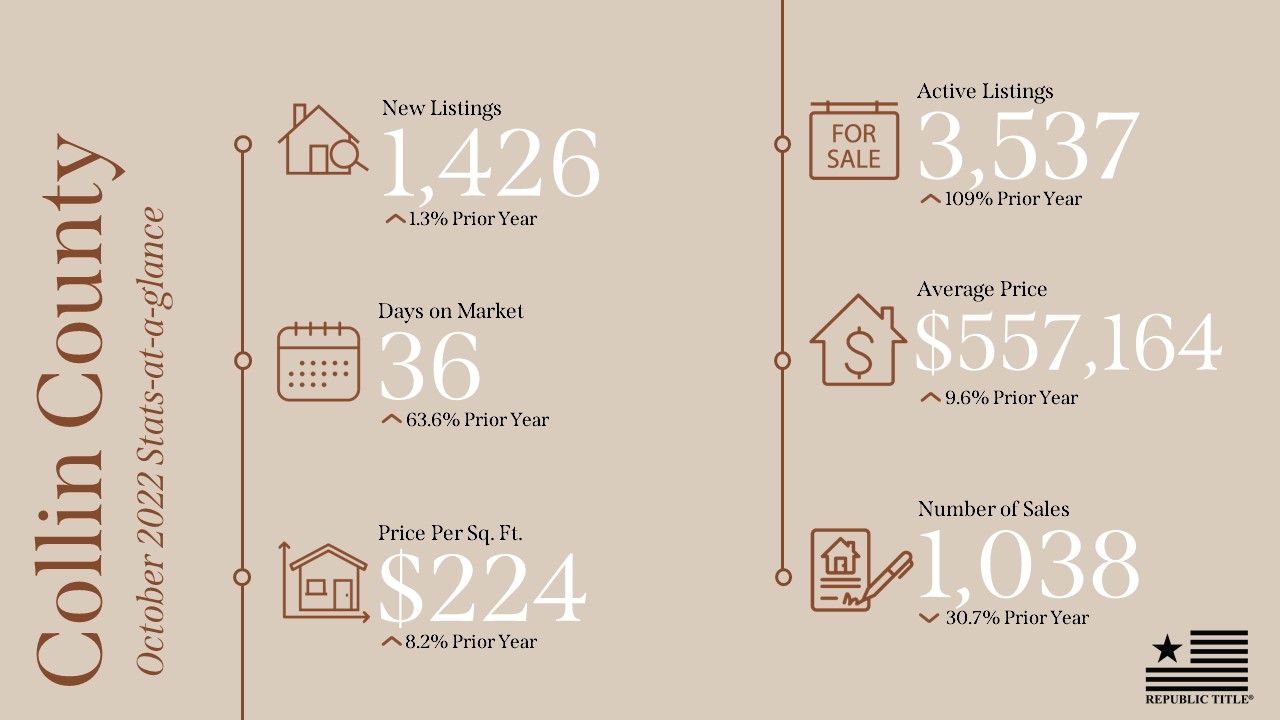
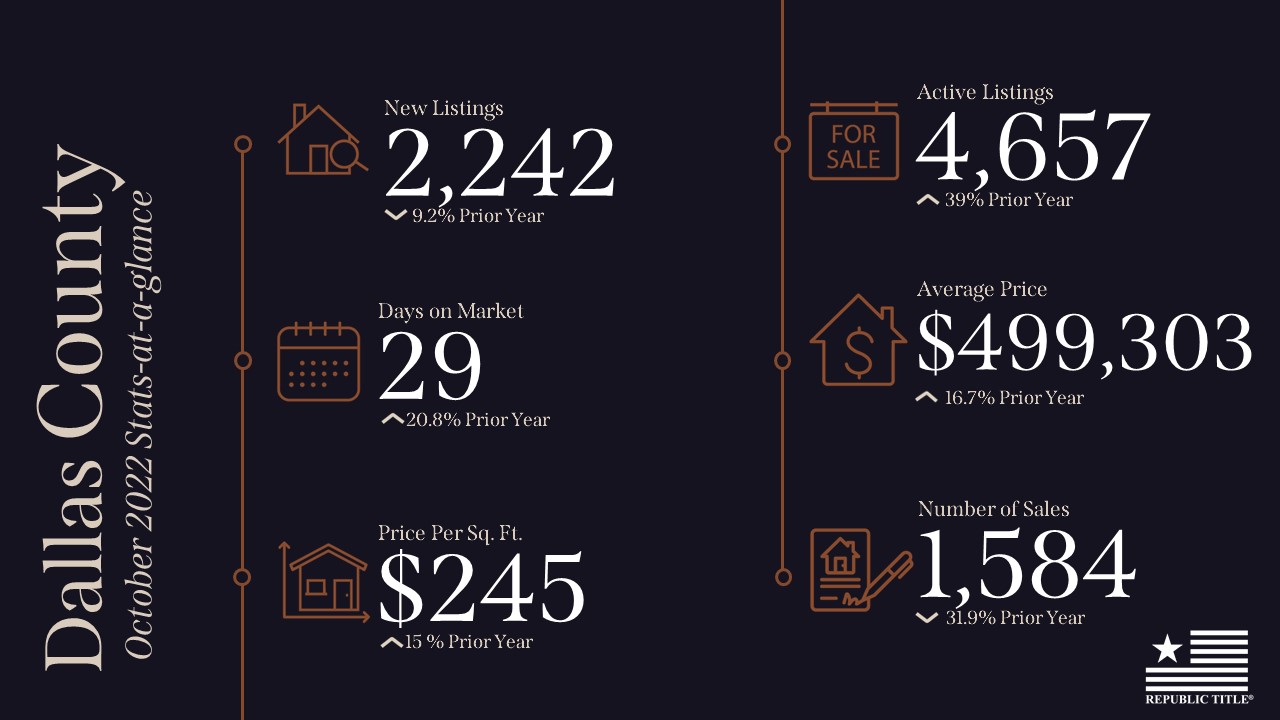
February’s active listings continued their upward trend since March 2022 after having slowed in the past two months, when the metric fell to 91,000 units after seasonal adjustment. Although, these levels are still lower than pre-pandemic listing levels. Additionally, despite the small dip last month, months of inventory (MOI) returned to an upward trend as inventory levels reached three months. Austin’s MOI fell to just below three months. Dallas followed a similar trend, with MOI dropping to 2.2 months. Meanwhile, Houston and San Antonio bolstered the state with increases, raising the overall months of inventory.
Demand Increases as Sales and Prices Jump
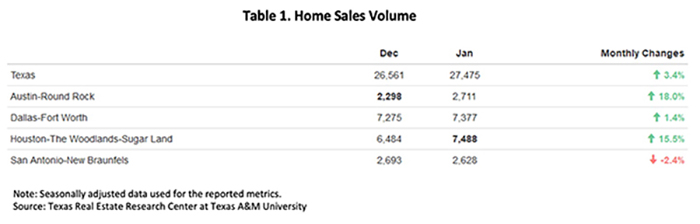
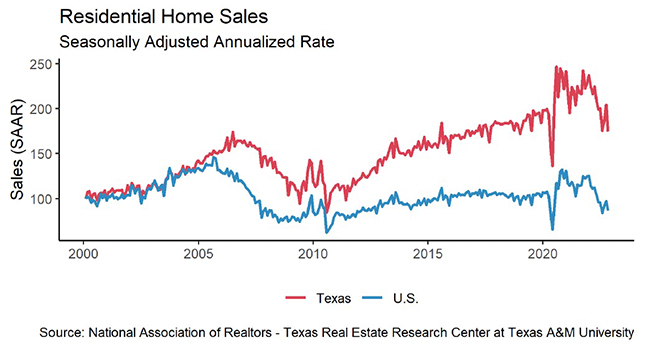
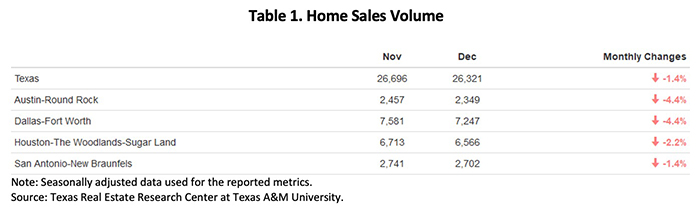
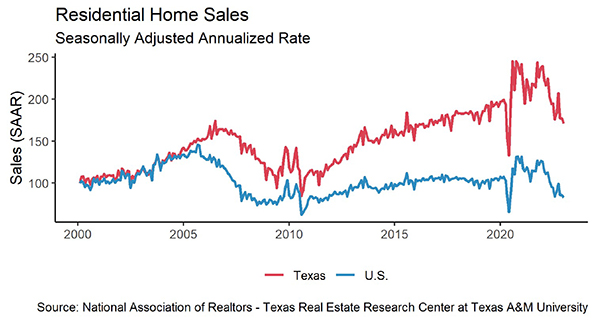
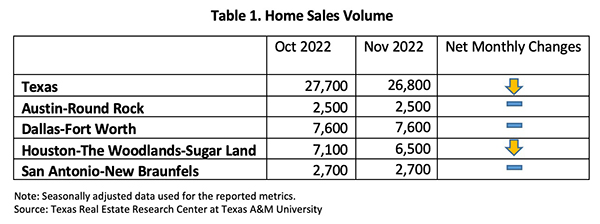
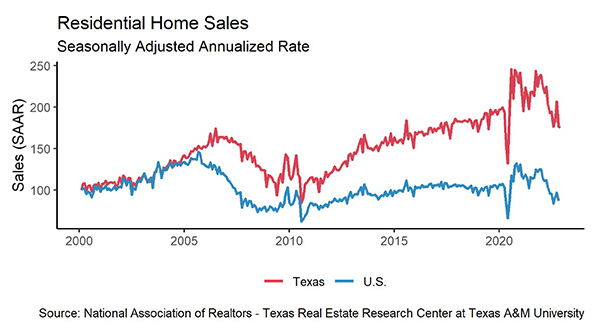
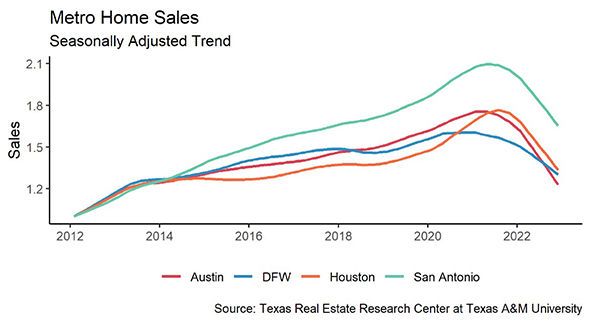
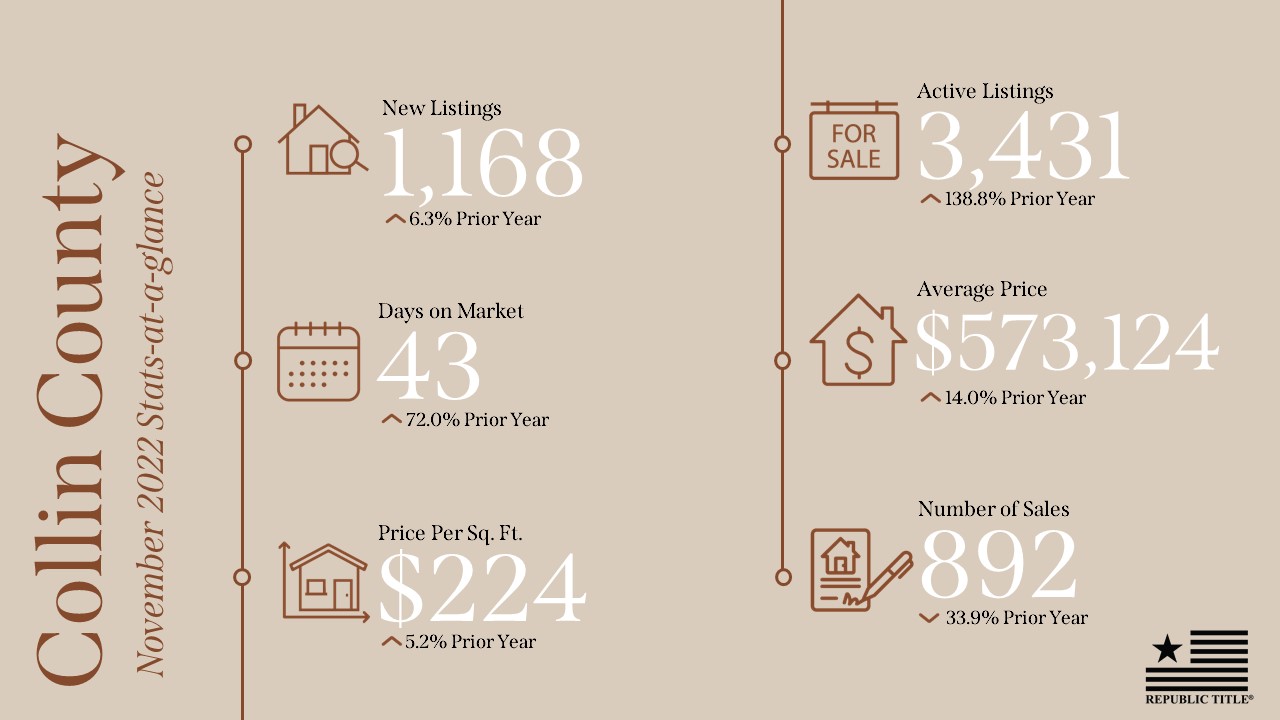
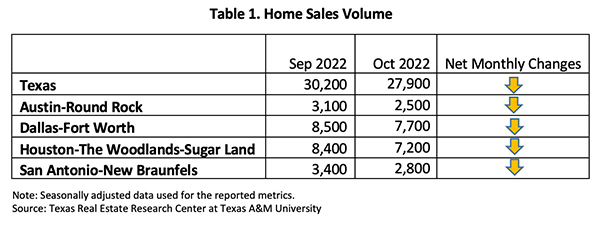
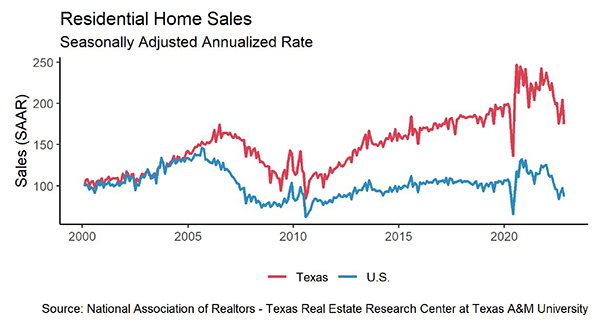
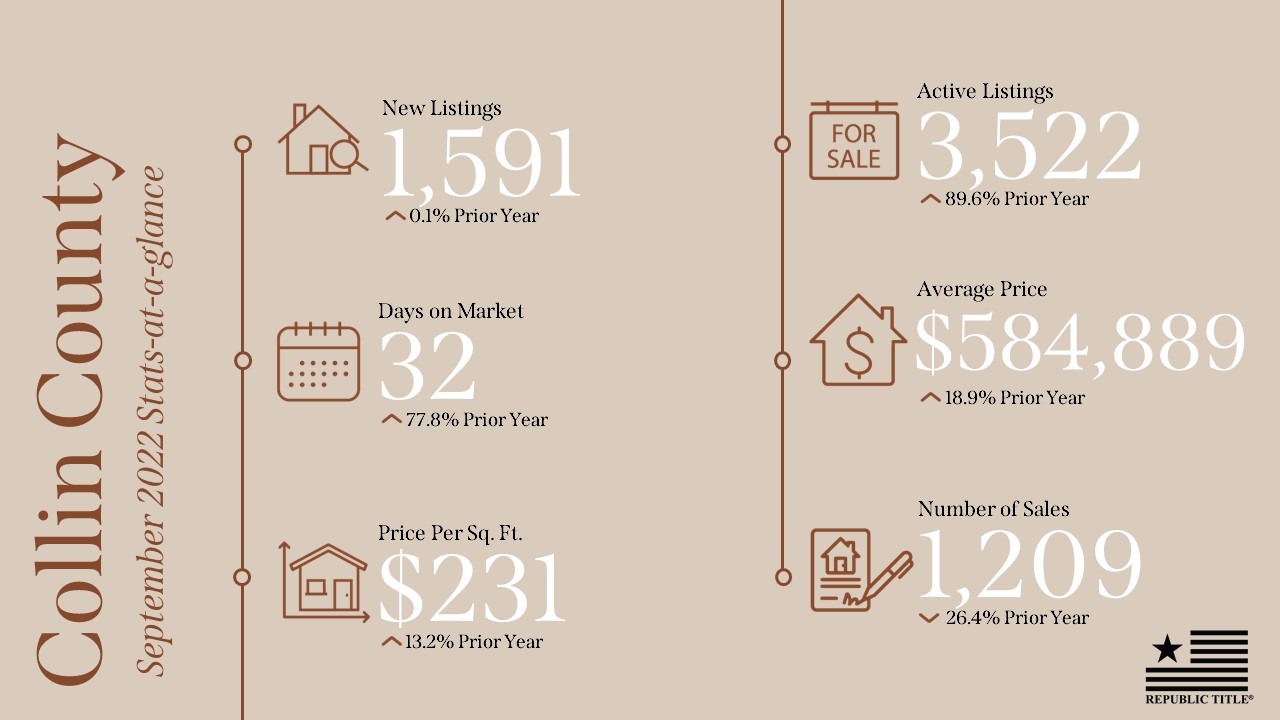
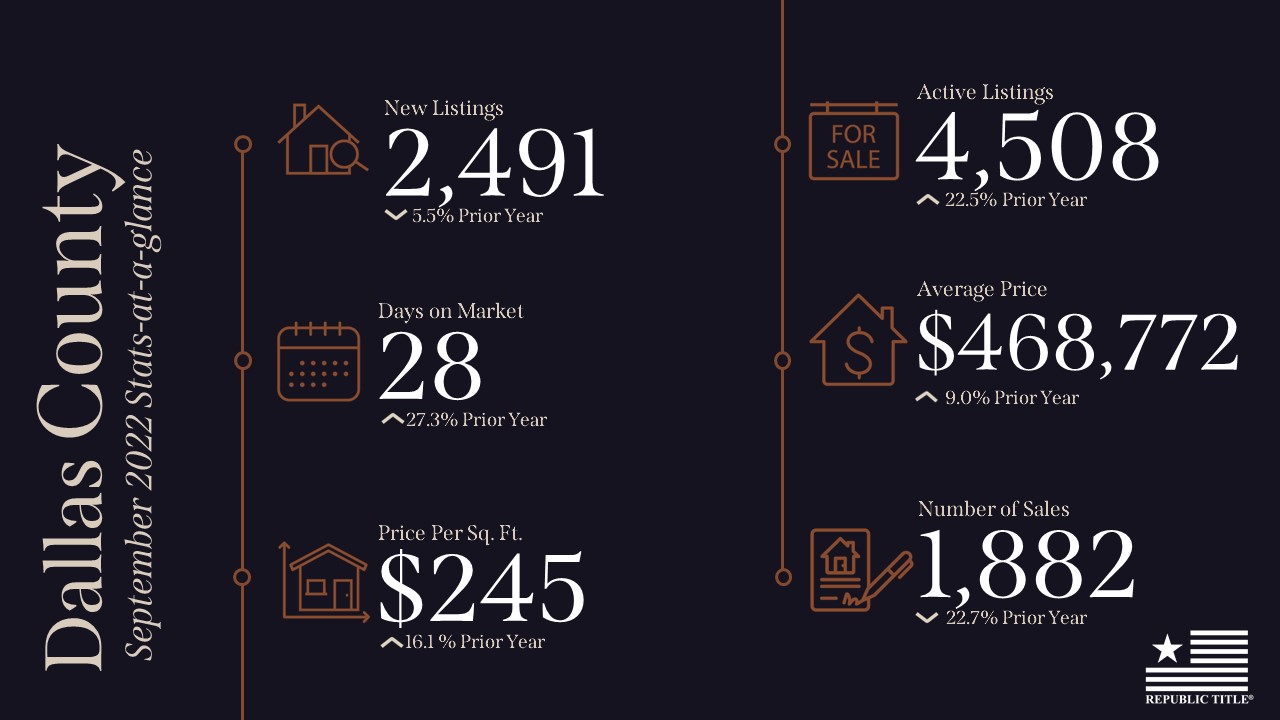
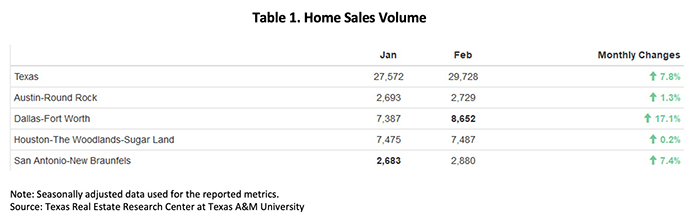
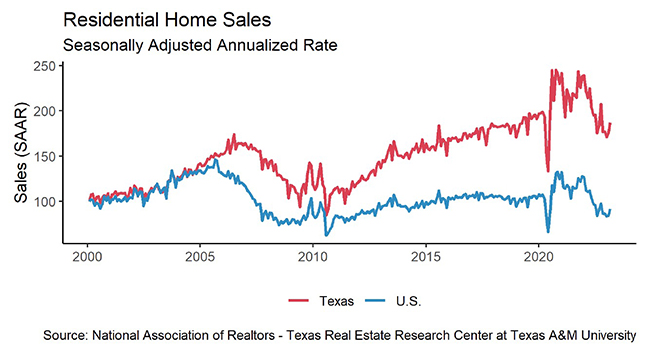
Housing demand started the new year with an upward trend, as sales volume expanded for two consecutive months. Total home sales had a strong boost of 7.8 percent MOM, doubling last month’s 3.7 percent growth. Sales gained more than 2,000 transactions in a month, marching upward to a seasonally adjusted rate of 29,728 closings. Austin and Houston, the two metros that had their great rebound in January, stayed flat this month (Table 1). Meanwhile, Dallas and San Antonio spiked up. Dallas’ 17.1 percent growth brought more than 1,200 additional homes under contract in February.
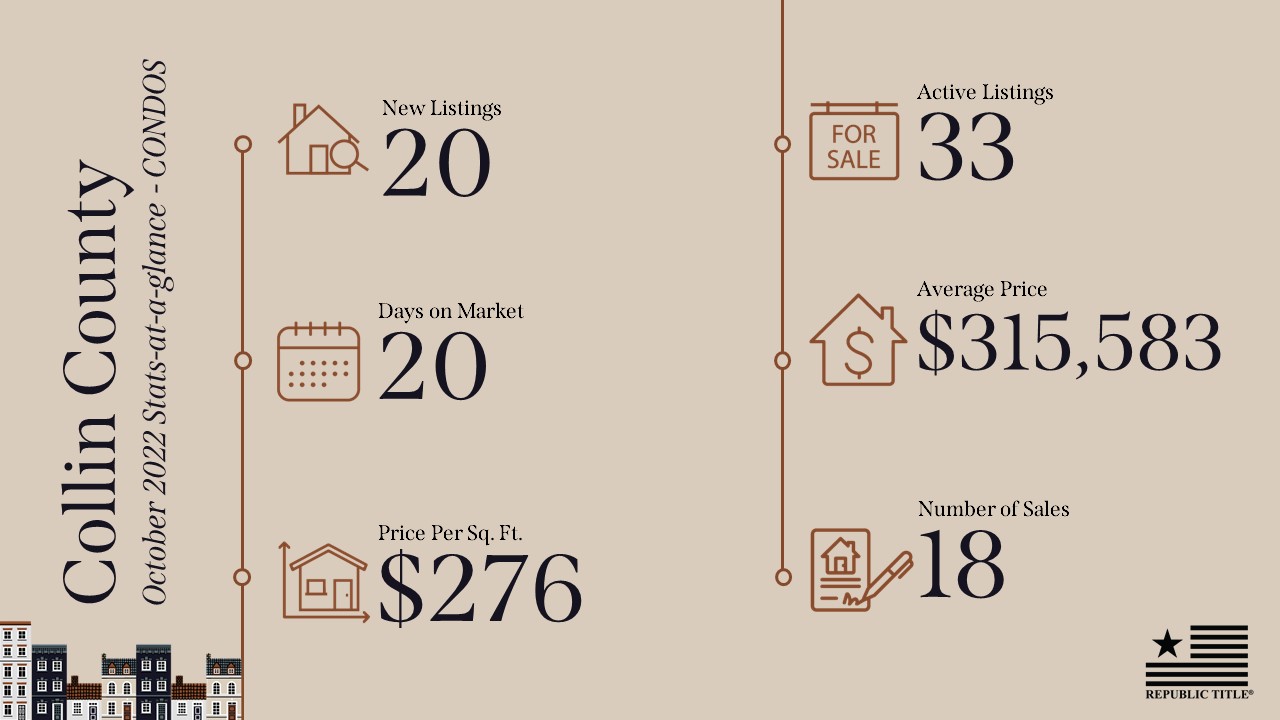
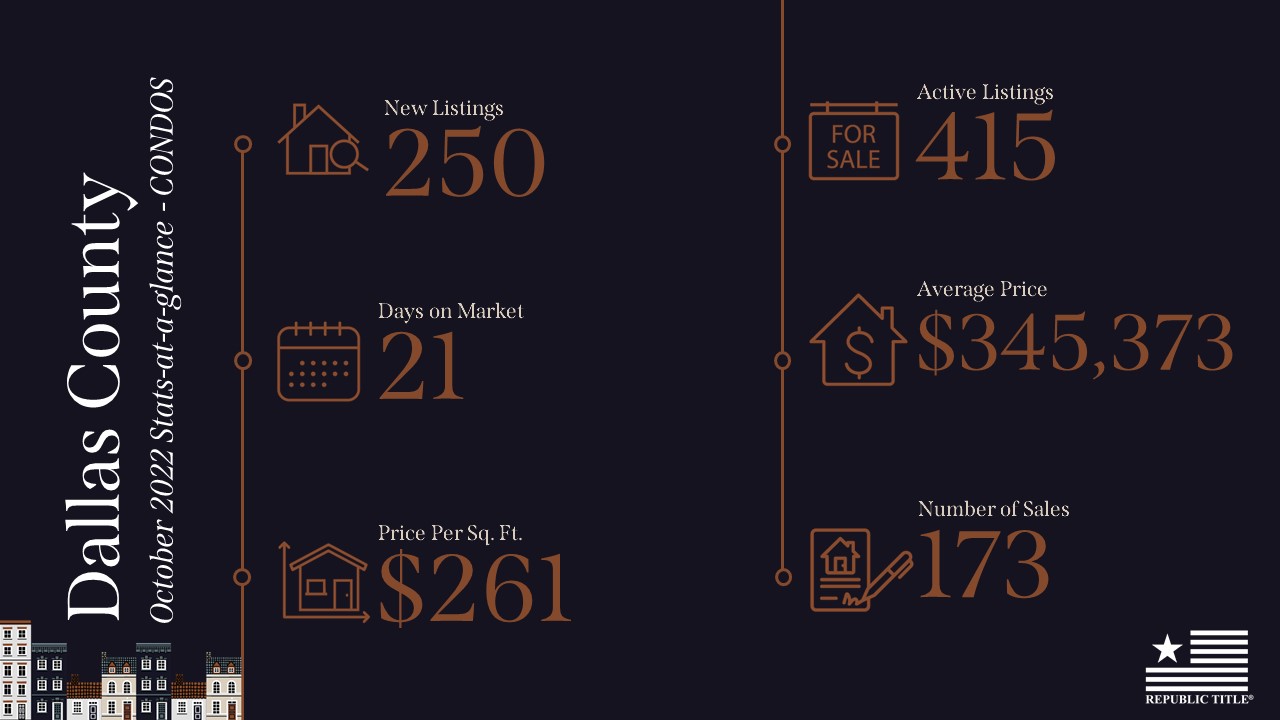
Sales across all price cohorts continued to follow their normal seasonal cycle with sales increasing through all price cohorts. Homes in the $300K-$400K range remain at the epicenter of the market, making up 28 percent of Texas sales. This constitutes a 2 percent increase in market share for this price cohort over February 2022. DFW increased its market share by a similar 2 percent this month in the same cohort, as the other metros stayed on course with YOY market shares. Despite sales activity picking up, Texas’ average DOM steadily advanced four days in 2023 to 56 days. Compared with the five-year average of 59 days before 2020, the housing market is fast approaching historic norms. Austin posted a ten-year record of 71 days this month, the longest market time since 2013. This is a major swing from the intense market conditions from just a year ago.
Austin homes’ time on market uniformly lengthened across all price cohorts, while other metros had mixed trends. Among the homes valued above $400K, Austin’s DOM ranged from 57 to 69 days, at least ten days longer than the corresponding cohort in the DFW market. Houston homes in the $750K and above price cohort were in a hot market, staying on market only one day longer than homes below $200K.
Prices Flatten as Rates Remain High
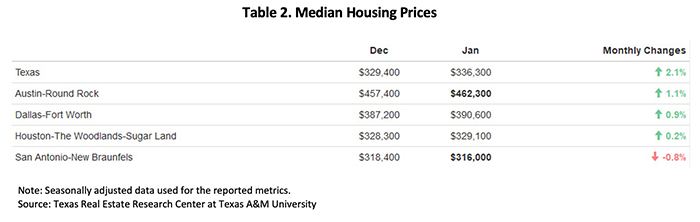
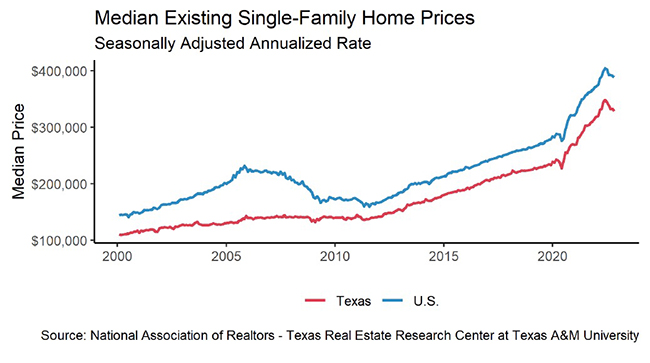
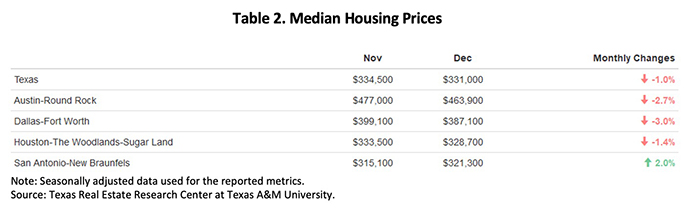
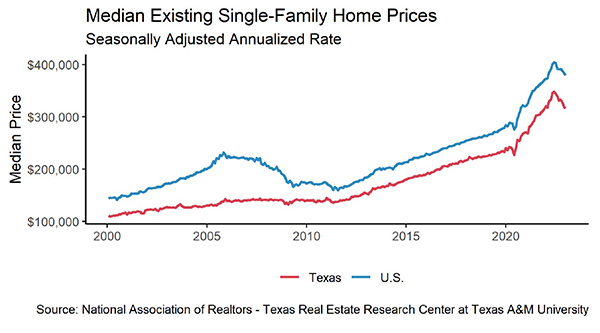
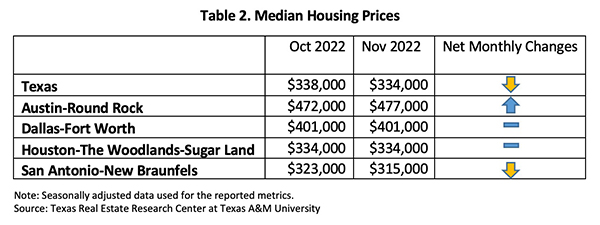
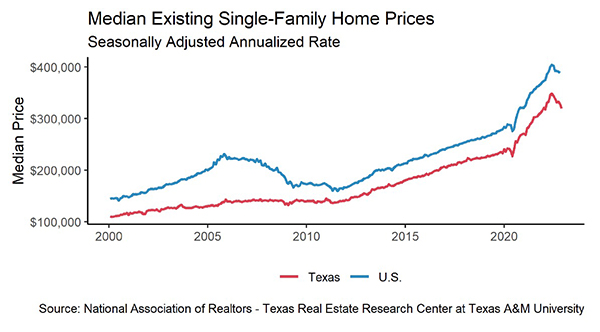
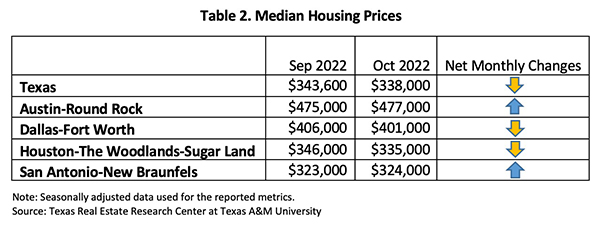
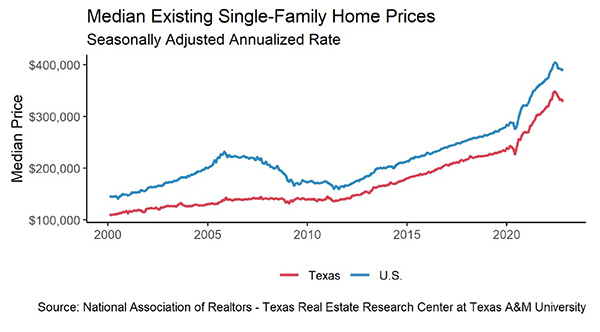
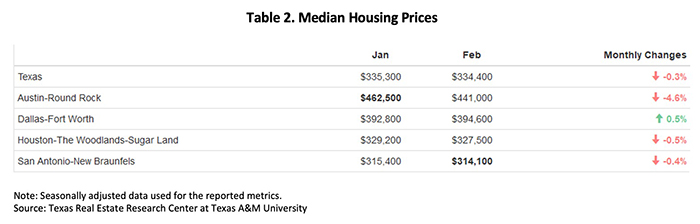
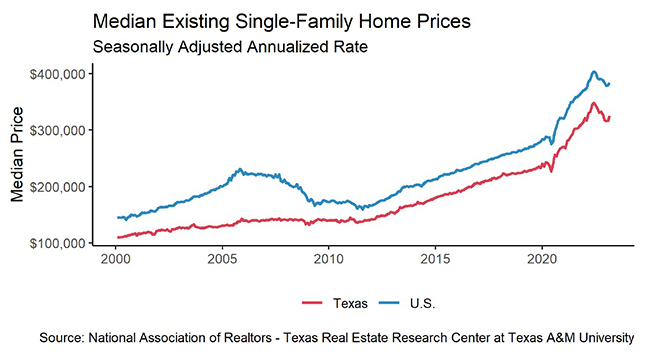
Texas’ median home price mostly stayed flat from the previous month, and only 0.6 percent higher than a year ago (Table 2). However, home prices did fall in Austin with 4.6 percent MOM and 12.2 percent YOY decreases. Dallas and San Antonio still saw low-single-digit price growth from a year ago.
The ten-year U.S. Treasury bond yield reversed the dwindling trend and marched upward 22 basis points to 3.8 percent. The Federal Home Loan Mortgage Corporation’s 30-year fixed-rate saw the fourth consecutive moderation since November, falling to 6.3 percent.
High mortgage rates have discouraged many homebuyers, driving demand down over the past year. The Texas Repeat Sales Home Price Index accounts for compositional price effects and provides a better measure of changes in single-family home values. Texas’ index gained 3.1 percent MOM. Austin stood out with an 8 percent YOY decrease. The other four metros had minor single-digit YOY increases, indicating possible price normalization.
_________________
* All measurements are calculated using seasonally adjusted data, and percentage changes are calculated month over month, unless stated otherwise.
Source – Joshua Roberson, Weiling Yan, and John Shaunfield (April 19, 2023)
https://www.recenter.tamu.edu/articles/technical-report/Texas-Housing-Insight