All measurements are calculated using seasonally adjusted data, and percentage changes are calculated month-over-month, unless stated otherwise.

The latest housing data show conditions have shifted in favor of homebuyers as the spring homebuying gets underway. In particular, the housing inventory has been building up for some time now and reached levels not seen in a long time. The supply of new listings coming to the market has accelerated in recent months, partly because new construction has ramped up at a record pace during 2024. Economic uncertainty, persistent inflation, and global trade tensions are prompting increased market-timing and profit-taking activity by buyers and sellers.
Home sales pace has slowed in recent months, as reflected in rising days on the market and declining inventory turnover ratio. Year-over-year (YoY) home sales were up in January, driven primarily by a more active market for higher-end homes. Market liquidity for lower-priced homes remains constrained by high mortgage rates.
In 2024, new housing starts registered the highest annual growth in a decade, even outpacing the peak of the pandemic housing boom in 2021. That momentum has carried over into 2025.
Home prices are rising steadily and slowly. The large inventory build-up and the record number of new constructions that are underway will continue to put downward pressure on home prices.
In the near term, mortgage rates will remain in the mid-6 percent range with some narrow fluctuations. In the absence of meaningful improvement in mortgage rates, housing affordability will continue to remain a challenge. The Federal Reserve has taken a wait-and-see approach to future interest rate decisions. A decline in the job market and broad economic conditions will likely be necessary for an interest rate reduction to take place.
Home Sales in January Pulled Back Under Rising Mortgage Rates
Before heading into 2025, particularly in the fourth quarter of 2024, home sales were rising quickly. But the strong upward momentum subsided as mortgage rates moved higher following the Federal Reserve’s December rate cut, amid concerns of inflation re-acceleration.
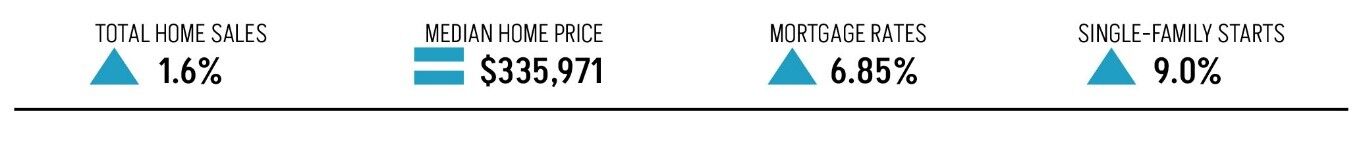
In January 2025, statewide home sales of new and existing homes were at a seasonally adjusted annual rate of 343,240, up by 1.2 percent from the same period a year ago. Nationally, the National Association of Realtors (NAR) reported a 2 percent YoY rise in existing home sales. Statewide median home price was $328,000, up slightly from a year ago at $325,000.

Sources: Texas Real Estate Research Center and National Association of Realtors
Sales of Low-to-Moderate Income Homes Lagged High-End Homes
The pullback in homes sales is more evident among lower-priced homes. In January, sales declined 2.8 percent YoY among homes priced between $250,000 and $350,000. Sales were relatively flat among homes priced below $250,000.
In contrast, sales in the high-end market (more than $750,000) rose 9.4 percent in January, followed by a modest 3.7 percent for homes priced between $500,000 and $750,000. The uneven pace of sales growth was also evident at the tail end of 2024. During 4Q2024, the high-end market was the most active and the bottom-tier the weakest. The mid- to upper-tier homes fell in between.

Source: Texas Real Estate Research Center
Inventory at Decade-High, Home Sales at Decade-Low Pace
The supply of new listings has accelerated in recent months, expanding active inventory to levels not seen in a decade. The end of January saw 120,100 active listings, up nearly 30 percent YoY. Months’ supply climbed to about 4.5 months, the highest in a decade and above pre-pandemic levels. Prior to the pandemic, months’ supply fluctuated near 3.5 months while active listings sat around 100,000.

Source: Texas Real Estate Research Center
A total of 46,410 new listings hit the market in January, a 17.3 percent YoY increase. In the preceding 12 months, the momentum has built up rapidly, where new listings surged at about 13 percent each month, something not seen for a long time.

Source: Texas Real Estate Research Center
Homes stayed on the market a median of 51 days in January, up eight days from the year before. Home sales pace, measured alternatively as the rate of inventory turnover, has dropped to levels not seen since 2016 and was below what normally fluctuated in a relatively balanced market. Before the pandemic, about one in five homes (20 percent) were typically sold during the month. In the last 13 months (including January 2025), the rate of inventory depletions averaged at about 15 percent.

Source: Texas Real Estate Research Center
New Housing Starts Continue to Post Strong Growth
Since the pandemic, Texas has experienced a surge in new-home construction as the state’s robust economy, friendly business environment, job opportunities, and affordable housing costs have attracted businesses and new residents. In January, single-family home starts were at a seasonally adjusted annual rate of 165,050, up 10.9 percent YoY. Housing starts were down seasonally by 5.6 percent from December 2024. Texas accounts for 16.6 percent of the nation’s total new home starts.

Sources: Texas Real Estate Research Center and U.S. Census Bureau
After a two-year setback triggered by the Fed’s monetary tightening and interest rate hikes, new home starts came roared back in 2024. Between 2023 and 2024, they jumped 24.7 percent, the largest rise seen in a decade and outpacing what was recorded at the peak of the pandemic housing boom. As the spring homebuying season gets underway, buyers can expect an influx of new homes entering the market.

Sources: Texas Real Estate Research Center and Dodge Construction Network
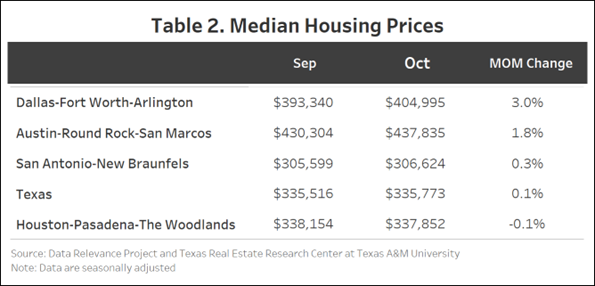
Home Prices Rising, Slowly and Steadily
Statewide, home prices are rising slowly and steadily. In January, the TRERC Home Price Index (HPI) recorded a 1.7 percent YoY increase, slightly smaller than in the previous two months. Nationally, the average home price appreciation captured by the S&P CoreLogic Case-Shiller HPI was at a faster rate of 3.9 percent. The Case-Shiller 20-City Composite HPI measures home price trends in the country’s largest and most densely populated cities (including Dallas, the only Texas city in the index), so it’s no surprise that the index’s annual home price appreciation rate typically outpaces Texas’ statewide rate. TRERC’s HPI is based on all geographic transactions, rural or urban, in the state of Texas.

Sources: Texas Real Estate Research Center and FRED Economic Data
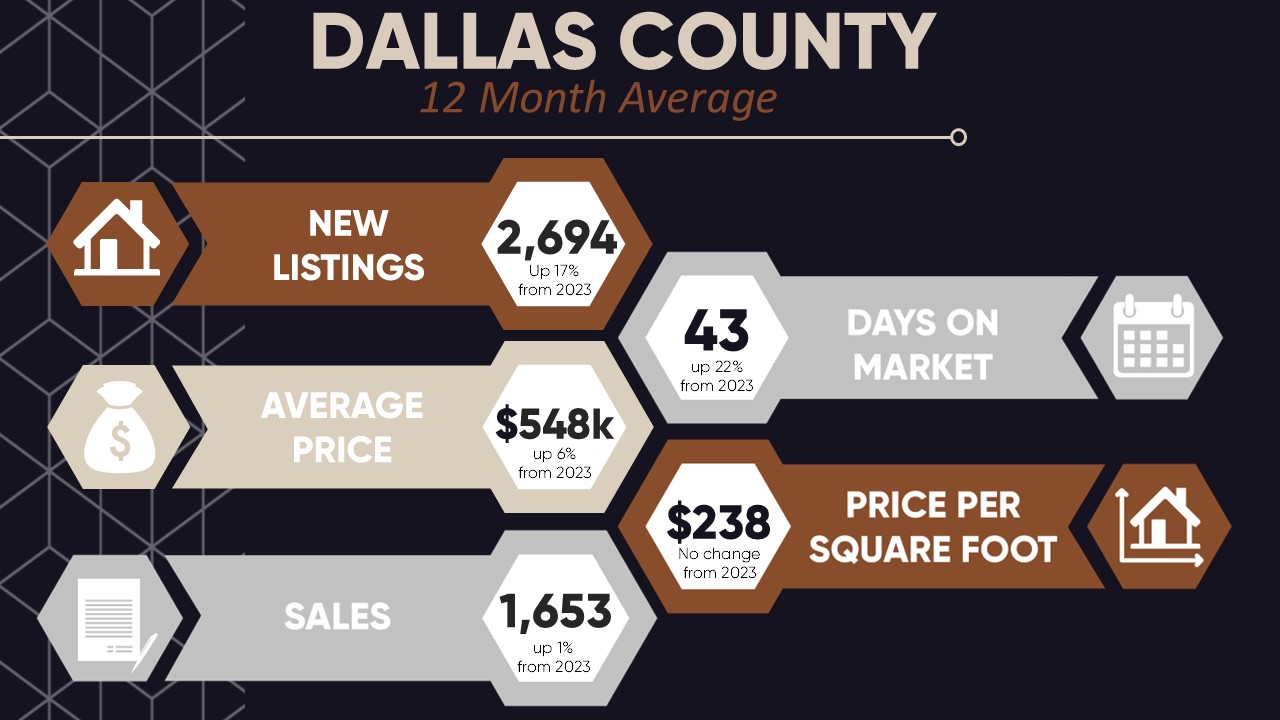
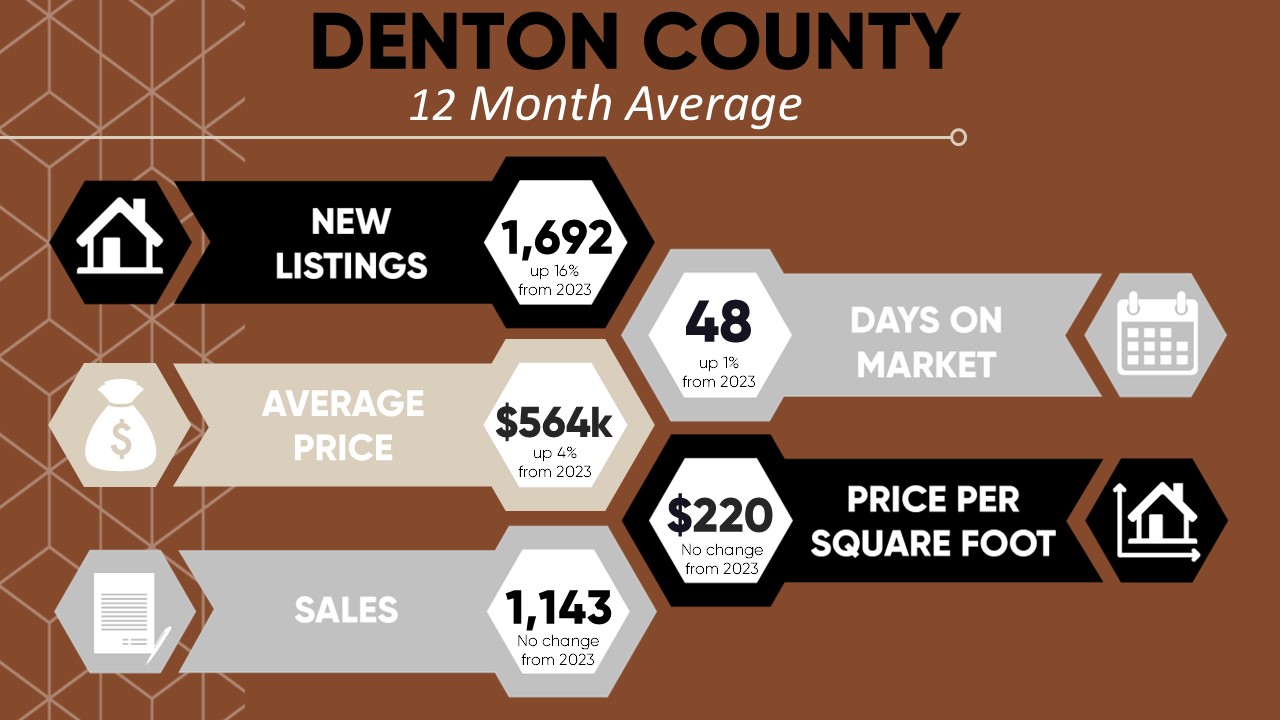
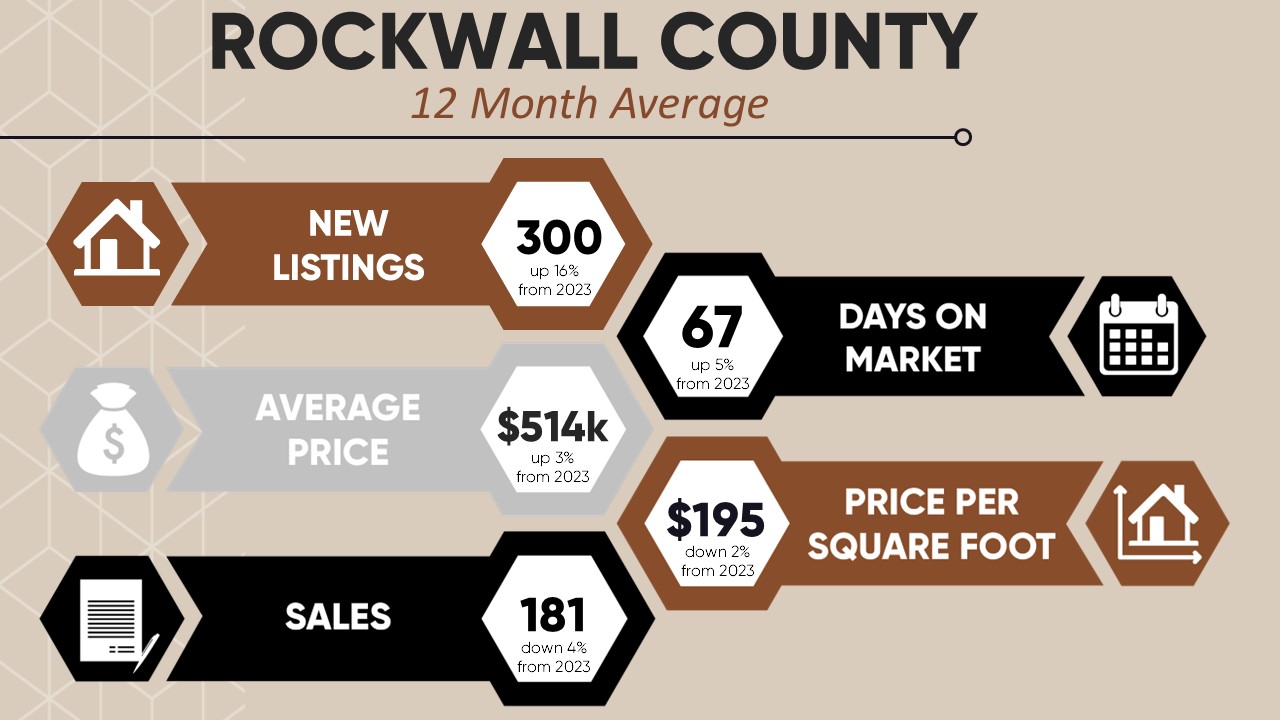
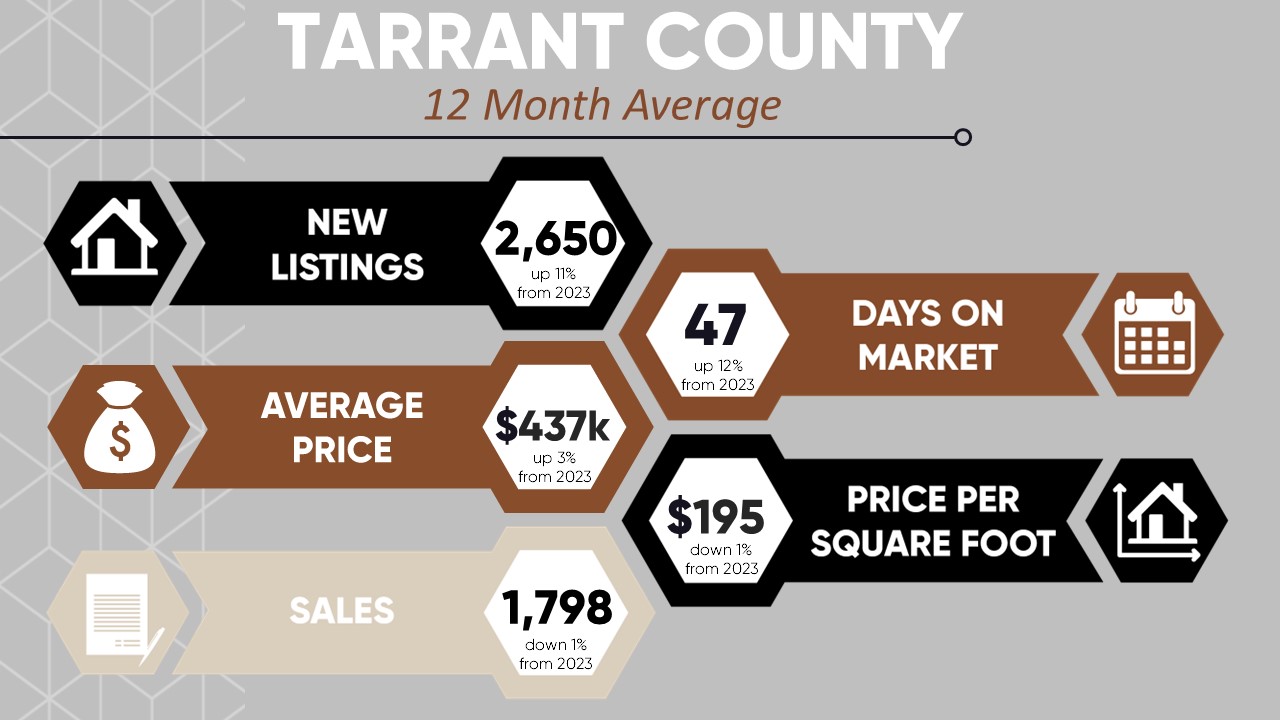
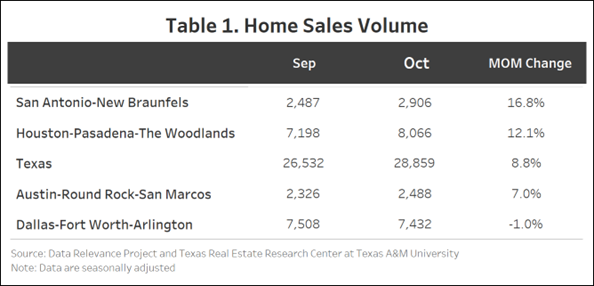
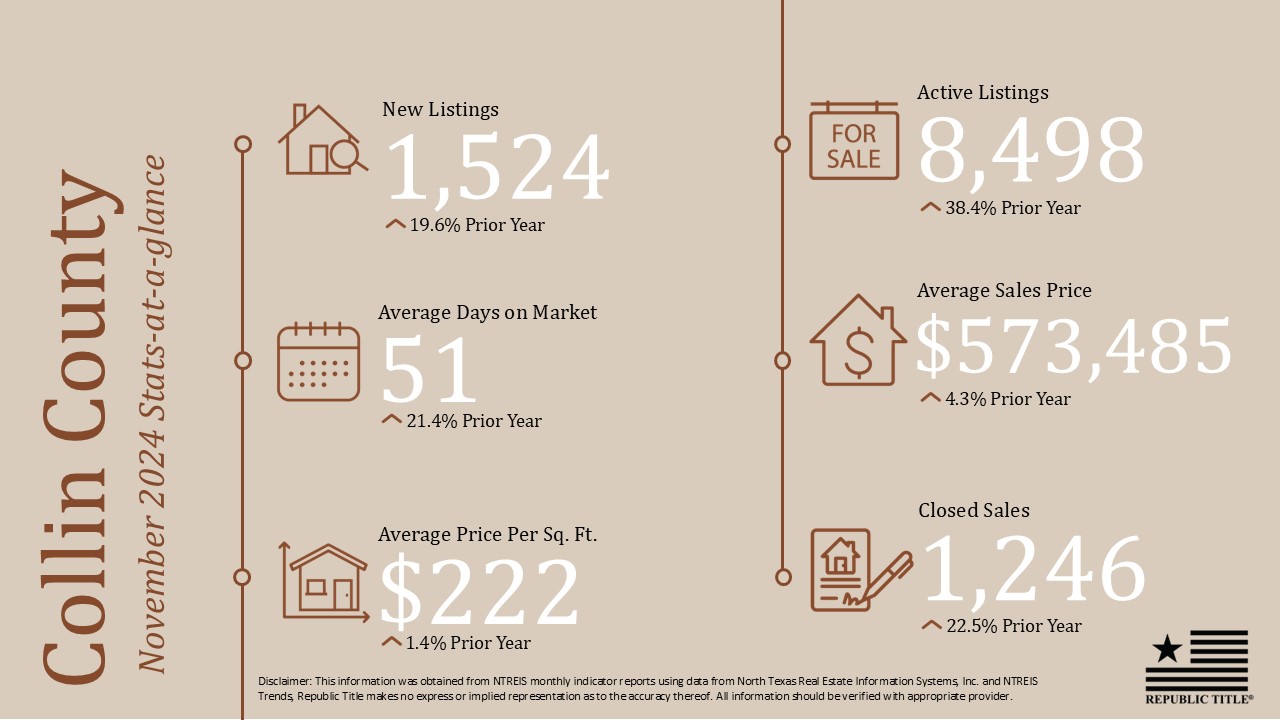
Metro Housing Benchmarks
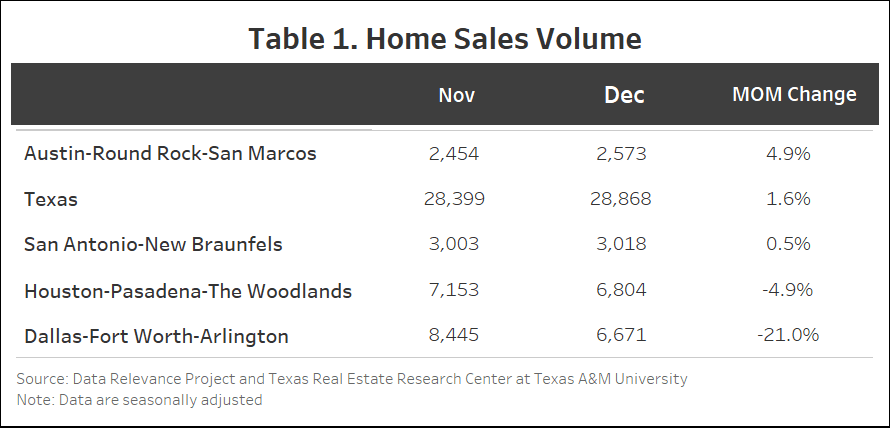
January 2025 Homes Sales, Ordered by Year-Over-Year Change

Source: Texas Real Estate Research Center
January 2025 Inventory Velocity, Ordered by Year-Over-Year Change

Source: Texas Real Estate Research Center
New Construction Growth 2015-24, Ordered by One-Year Growth

Source: Texas Real Estate Research Center
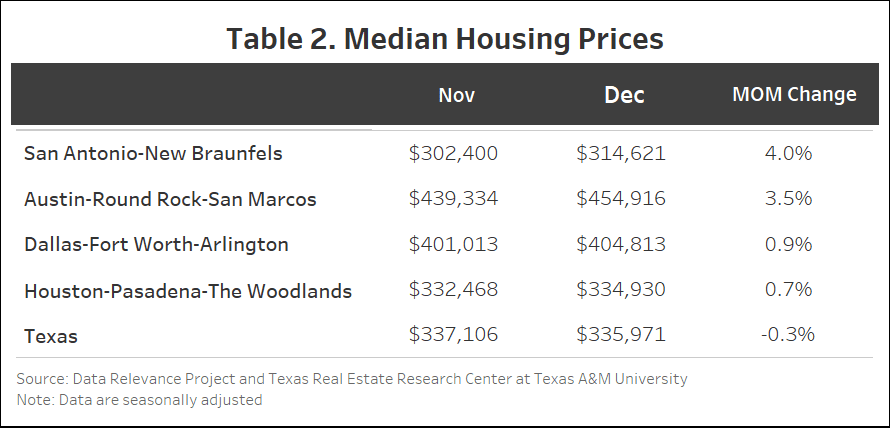
Home Price Appreciation for Select MSA and MSA Divisions

Source: Texas Real Estate Research Center
Source for article: Texas Housing Insight | January 2025 | Texas Real Estate Research Center By Yanling MayerJoshua RobersonJunqing Wu