
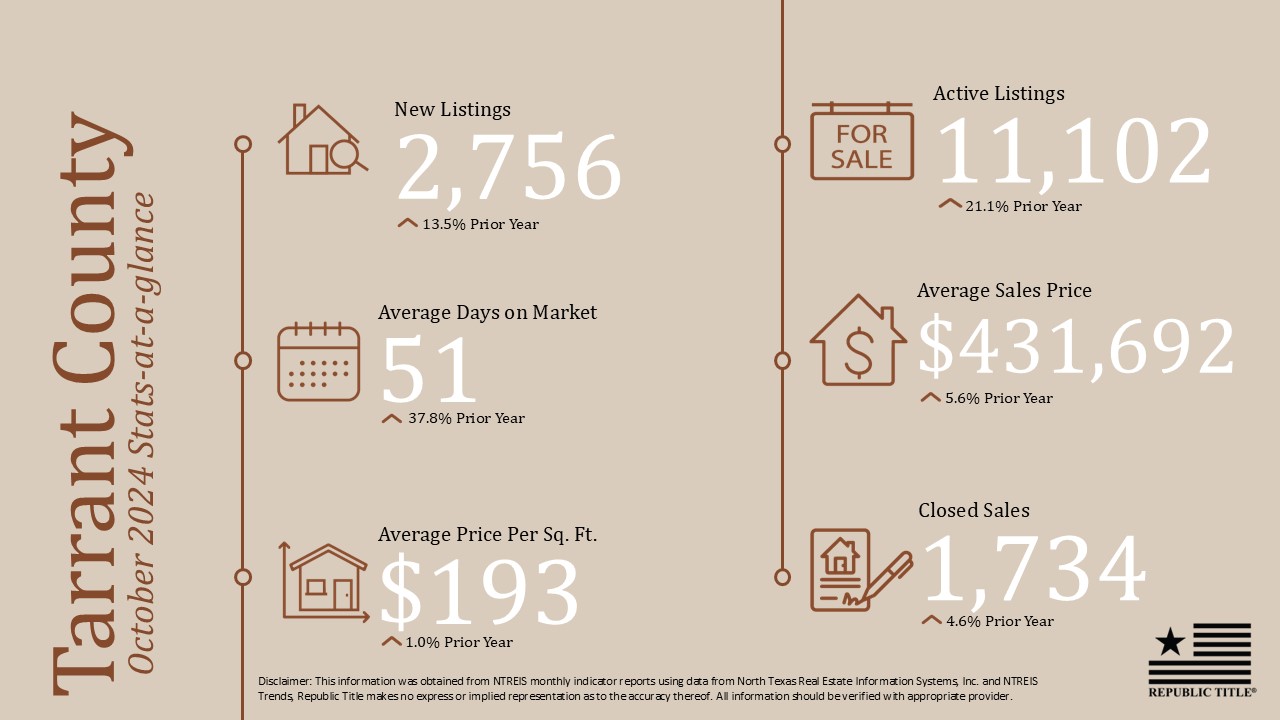
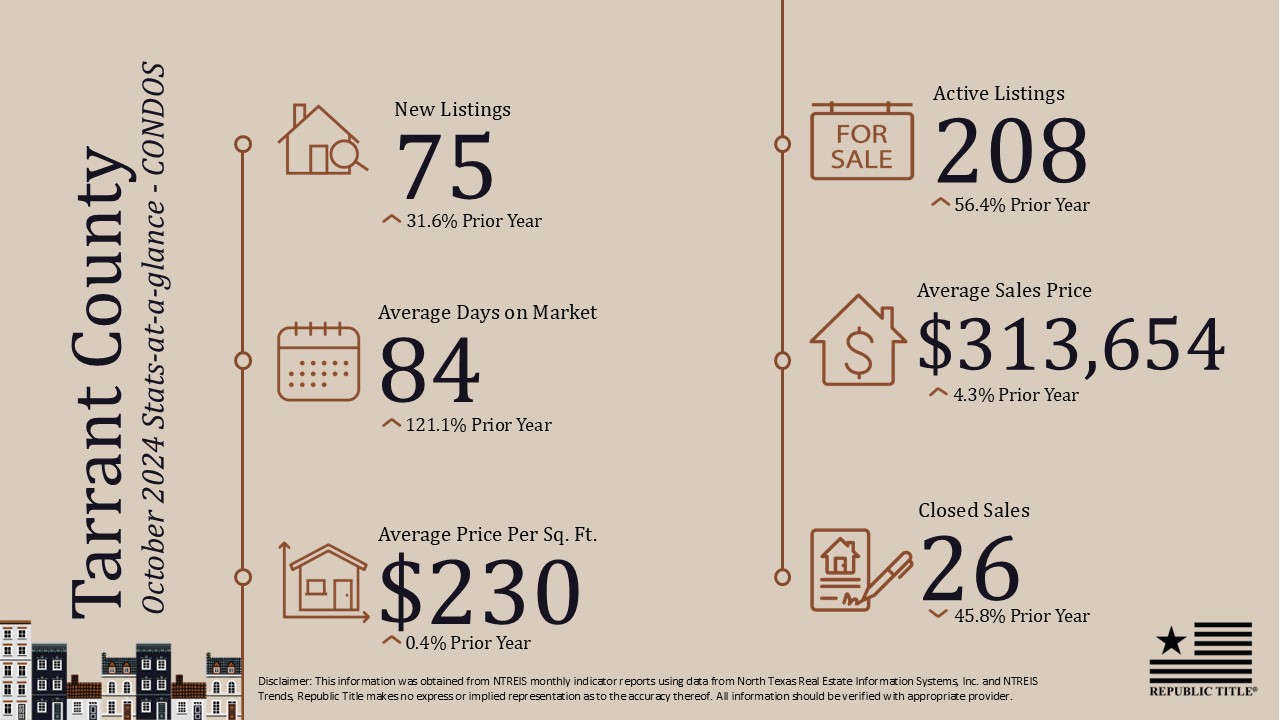


All measurements are calculated using seasonally adjusted data, and percentage changes are calculated month-over-month, unless stated otherwise.

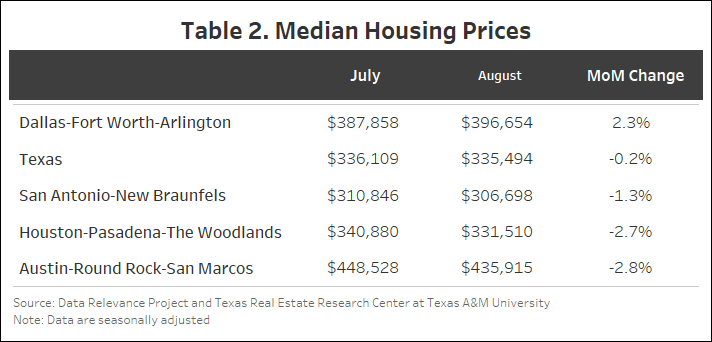
August saw a fall in home sales and a continued rise in building permits. New listings increased almost 14 percent, driven largely by the Houston metro recovering after Hurricane Beryl. The storm did not have the same degree of impact on sales. Home prices fell slightly to $335,494.
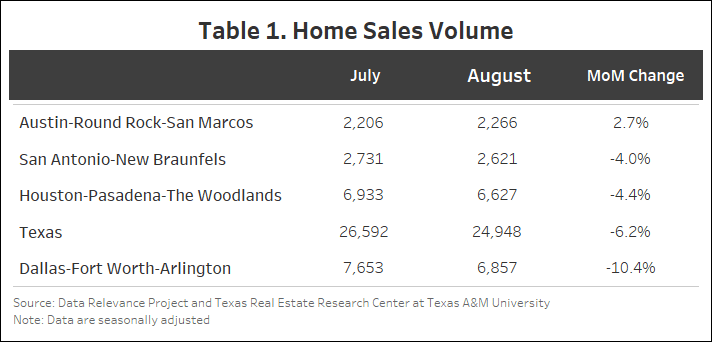
After bouncing back in July, statewide seasonally adjusted home sales dropped 6.2 percent month-over-month (MOM), resulting in 24,948 homes sold (Table 1). Dallas had the largest decrease among the Big Four at 10.4 percent (6,858), followed by Houston at 4.4 percent (6,628) and San Antonio at 4 percent (2,622). Austin was the only one among the Big Four to have an increase in August (2.7 percent), resulting in 2,267 homes sold.
The number of new listings increased by over 5,500, marking a 13.8 percent rise from July, in large part due to Hurricane Beryl. New listings plummeted the week of Hurricane Beryl with the following weeks making up for the decline. This increase spilled over into August, when new listings normally are in decline following the peak months of June and July. Houston saw a substantial increase of 44.9 percent (14,098), followed by Austin at 27 percent (3,543) and Dallas at 12.5 percent (11,349). San Antonio had the smallest addition among the Big Four, with a 5.8 percent increase (4,060).
The state’s average days on market (DOM) increased by one day to 61 days. Dallas had the largest increase—from 52 to 55 days, a 7 percent increase. Similarly, Austin increased from 68 to 70 days. Houston and San Antonio both rose by one day and are currently at 52 and 74 days on market, respectively.
Texas’ number of active listings increased from 116,294 to 120,129 (3.3 percent). Active listings across the Big Four rose in August with Dallas, San Antonio, and Houston increasing by 4.3 percent (26,835), 1.5 percent (14,093), and 3.5 percent (28,456), respectively, while Austin rose by 0.1 percent (11,519).
Statewide pending listings have begun increasing with 1,368 additional pending listings in August. The pending listings across the Big Four have been mixed with Houston (7,294) and Austin (2,616) increasing by 18.6 and 15 percent, respectively. Meanwhile, San Antonio (2,235) and Dallas (6,170) declined by 20 percent and 14.7 percent, respectively.
Treasury and mortgage rates both declined in August but at a much faster rate than the month before. The average ten-year U.S. Treasury Bond yield fell 38 basis points to 3.87 percent. The Federal Home Loan Mortgage Corporation’s 30-year fixed-rate fell by 35 basis points to 6.5 percent.
Statewide, building permits increased at a lower rate in August, up 1.59 percent MOM after a 29 percent increase in July. Houston grew by 7.3 percent and Dallas by 2.2 percent. Austin and San Antonio, on the other hand, fell by 8.1 and 7.3 percent, respectively.
Single-family construction starts grew after monthly declines since March 2024. Seasonally adjusted statewide single-family starts increased by 8 percent MOM to 13,564 units. Houston and Austin rose by 20 and 17 percent, respectively, while San Antonio increased by comparatively less (2.5 percent). Meanwhile, Dallas decreased by 0.6 percent.
The state’s total value of single-family starts climbed from $20.28 billion in August 2023 to $26.13 billion in August 2024. Houston accounted for 35.7 percent of the state’s total starts value followed by Dallas with 27.1 percent.
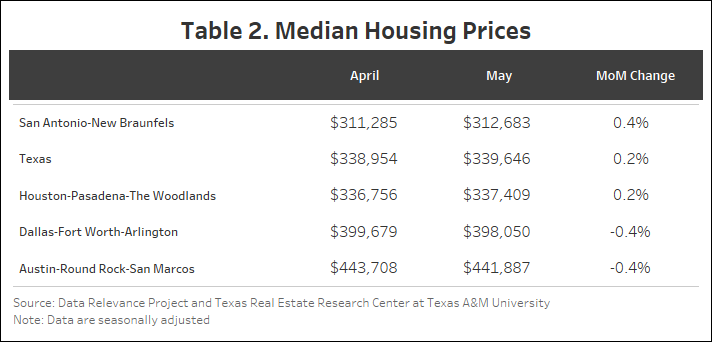
Texas’ median home price fell 0.2 percent MOM in August from $336,109 to $335,494 (Table 2). Houston fell by 2.7 percent to $331,510 while Dallas rose by 2.2 percent to $396,654. Austin fell the most among the Big Four, by 2.8 percent to $435,915. San Antonio fell by 1.3 percent to $306,698.
The Texas Repeat Sales Home Price Index (Jan 2005=100), which is a more accurate reflection of home price changes, fell 0.5 percent MOM in August but increased 1.1 percent year over year (YOY). Austin’s annual appreciation remains below the state’s average and fell by 3.9 percent YOY in August.
Source: Texas Housing Insight | Texas Real Estate Research Center (tamu.edu)
BY JOSHUA ROBERSON, RHUTU KALLURJunqing Wu (October 9, 2024)

July saw an increase in home sales and a sharp rise in building permits. The previous month’s decline was partly due to fewer business days, which led to a spillover of activity in July. New listings fell almost 10 percent, but active listings fell by less than 1 percent, possibly due to the counteracting increase in sales for the month.
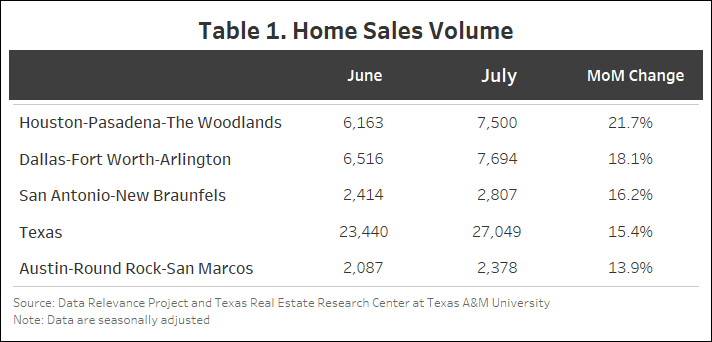
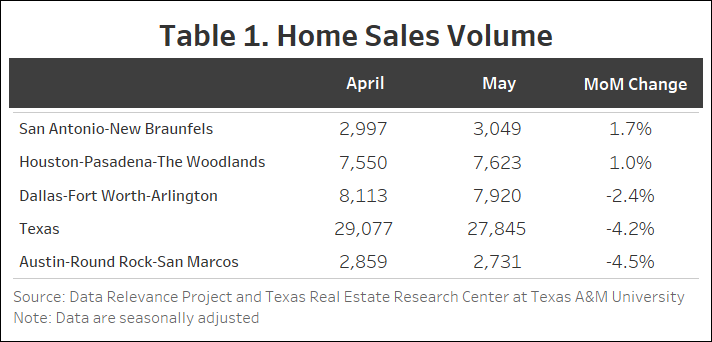
Texas bounced back over June’s low sales with a 15.4 percent month-over-month (MOM) increase in seasonally adjusted home sales in July, resulting in 27,049 homes sold (Table 1). Houston experienced the largest increase among the Big Four at 21.7 percent (7,500), followed by Dallas (7,595) and San Antonio (2,807), which increased by 18.1 and 16.2 percent, respectively. Austin had the lowest sales change of the Big Four with a 13.9 percent increase, resulting in 2,378 homes sold in July.
New listings fell by more than 4,000, a 9.8 percent drop from June. Houston, with 9,739 listings representing a 24.7 percent drop, was a major contributor to this decline, followed by Austin with 2,853 listings (18.8 percent drop). San Antonio (4,041) and Dallas (9,774) also experienced similar declines of 14 and 12 percent, respectively. Overall, the Big Four is seeing a downward shift in new listings that had been on the rise until April 2024, when they hit their high for the year so far.
The state’s average days on market (DOM) remained unchanged at 59 days in July. San Antonio had the largest decrease—73 to 71 days, a 2 percent decline. Similarly, Austin dropped from 68 to 67 days. Dallas and Houston, on the other hand, have not shown any major changes.
Texas’ number of active listings went down from 116,335 to 115,865 (0.4 percent). Active listings across the Big Four were mixed in July with Dallas, San Antonio, and Austin increasing by 4.7 percent (26,013), 2.4 percent (13,907), and 2 percent (11,426), respectively, while Houston fell 8.5 percent (27,503).
Statewide pending listings in Texas have been on the decline since earlier this year with 4,292 fewer pending listings in July than in February, when they peaked at 29,274. San Antonio and Houston had the highest declines—8.4 percent (to a current 2,515) and 7 percent (6,686), respectively. Dallas had a smaller decline of 2.9 percent (6,837) while Austin (2,355) hasn’t had any major changes.
Treasury and mortgage rates both declined in July but as a slower rate than the month before. The average ten-year U.S. Treasury Bond yield fell 6 basis points to 4.25 percent. The Federal Home Loan Mortgage Corporation’s 30-year fixed-rate fell by 7 basis points to 6.85 percent.
Texas’ monthly building permits bounced back in July, increasing 26.3 percent MOM after dropping 19 percent in June. All Big Four metros had growth except for San Antonio, which fell by 12.3 percent. Austin and Dallas grew the most at 28.3 percent and 71 percent, respectively. Both almost reached the April high point. Houston, however, failed to grow at the same rate as the others, rising only 6 percent.
Single-family construction starts have been on the decline since March 2024. Seasonally adjusted statewide single-family starts decreased by 4.3 percent MOM to 12,542 units. The Big Four have been in decline with Houston leading at 12 percent, San Antonio at 6 percent, and Dallas at 1.8 percent. Austin has been relatively steady with only a 1 percent fall.
The state’s total value of single-family starts climbed from $17.39 billion in July 2023 to $22.91 billion in July 2024. Houston accounted for 35.7 percent of the state’s total starts value followed by Dallas with 27.1 percent.
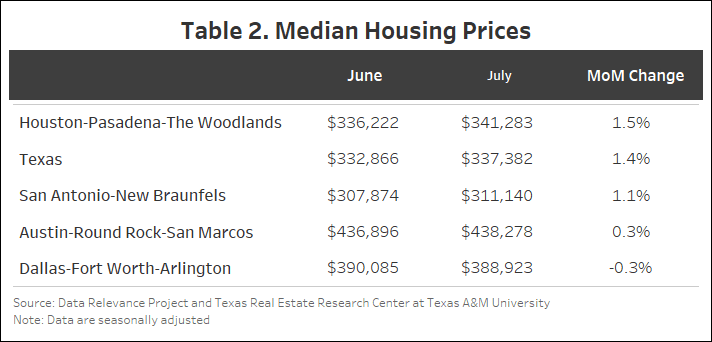
Texas’ median home price rose 1.4 percent MOM in July from $332,866 to $337,382. Houston rose by 1.5 percent at $341,283 while San Antonio rose by 1 percent at $311,140. Austin rose by 0.3 percent. Dallas was the only one among the Big Four that had a slight decline of 0.3 percent.
The Texas Repeat Sales Home Price Index (Jan 2005=100), which is a more accurate reflection of home price changes, fell 0.3 percent MOM in July but increased 1.4 percent year over year (YOY). Austin’s annual appreciation remains below the state’s average and fell by 3.2 percent YOY in July.
Source:
Source: Texas Housing Insight | Texas Real Estate Research Center (tamu.edu)
BY JOSHUA ROBERSON, RHUTU KALLURWESLEY MILLER (September 9, 2024)


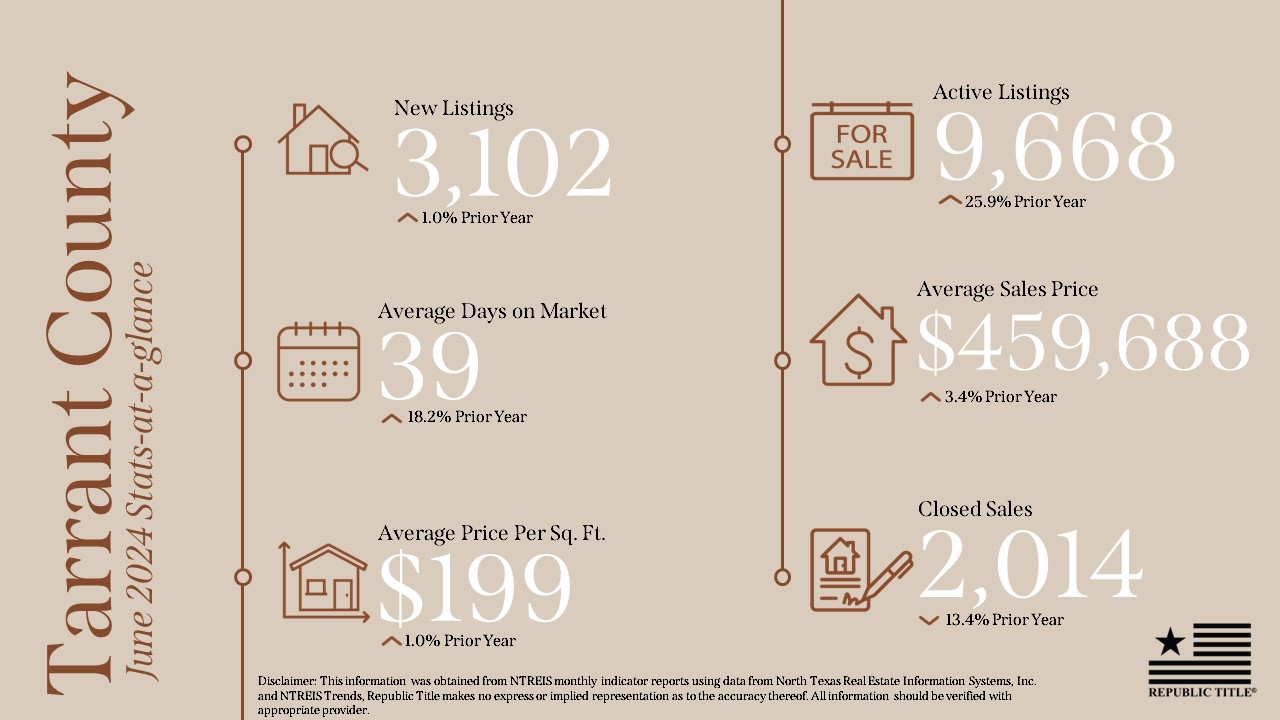
Housing activity for both new and existing homes decreased considerably in June. Growth in active listings resulted in downward pressure on home prices. Seasonally adjusted home prices dipped 1.5 percent, which is uncharacteristic for June when housing activity normally peaks for the year.
Texas witnessed a 14.2 percent month over month (MOM) decrease in seasonally adjusted home sales in June, resulting in 23,791 homes sold (Table 1). Dallas experienced the largest decrease among the Big Four at 16.8 percent (6,571) followed by Houston (6,474) and Austin (2,299), which each fell by 14.5 percent. The decline in San Antonio was relatively minimal, at 13 percent (2,587). As of June, year-to-date home sales are at the same levels as last year.


Recent data indicate a shift in new listings following a period of steady growth, notably led by Austin among the major metropolitan areas, which experienced a 13.6 percent decline to 3,513 listings. While all Big Four cities saw decreases, Austin’s decline was the most pronounced. Houston and San Antonio saw reductions of 3.8 percent (12,919 listings) and 2.4 percent (4,692 listings), respectively. Dallas exhibited the least variation, with a modest decrease of 1.2 percent (10,852 listings).
The state’s average days on market (DOM) increased from 57 to 59. Austin and Houston each increased by three days and are currently at 68 and 50 days, respectively. San Antonio and Dallas each increased by two days. San Antonio had the highest days on market among the Big Four with 74 days. Dallas had an average of 51 days. The number of Texas active listings went up from 113,714 to 116,797 (2.7 percent). The active listings across the Big Four were mixed in June with Houston increasing by 15.7 percent (30,179) while Dallas fell 9.7 percent (24,557). San Antonio and Austin had relatively smaller increases of 2.5 percent (13,576) and 0.3 percent (11,407), respectively.
Statewide pending listings in Texas have been on a decline since February with only a slight increase of 0.3 percent in June. San Antonio and Dallas both decreased by 10 percent and are currently at 2,459 and 6,493, respectively. Houston and Austin increased by 8 percent (7,592) and 4 percent (2,464), respectively. The slowdown in sales and pending listings in San Antonio and Dallas have contributed to their higher-than-normal active listing count.
Treasury and mortgage rates both declined in the month of June but was not enough to positively influence housing sales. The average ten-year U.S. Treasury Bond yield fell 17 basis points to 4.31 percent. The Federal Home Loan Mortgage Corporation’s 30-year fixed-rate fell by 14 basis points to 6.92 percent.
Texas state monthly building permits plummeted 18.9 percent MOM in June reaching 10,977. The Big Four faced a comprehensive decline to varying degrees. The decrease in Austin was the most significant, reaching 30.1 percent. Dallas also experienced a substantial drop, with a decrease of 20.1 percent. Houston and San Antonio had smaller declines of 7.1 and 7.7 percent, respectively.
Single-family construction starts also declined but to a much lesser degree according to data from Dodge Construction Network. Seasonally adjusted statewide single-family starts decreased by 0.3 percent MOM to 13,198 units. Austin had a slower month for permits with a decline of 3.2 percent. DFW actually increased 2.8 percent over May, reaching 3,566 starts. Houston and San Antonio had a slight increase of 0.4 and 0.1 percent, respectively.
The state’s total value of single-family starts climbed from $14.68 billion in June 2023 to $20.06 billion in June 2024. Houston accounted for 36.3 percent of the state’s total starts value followed by Dallas with 26.8 percent.
Texas’ median home price fell by 1.5 percent MOM in June with an overall decline in the Big Four areas (Table 2). Houston, San Antonio, and Austin each declined by less than one percent. Dallas experienced the largest decline, with a drop of 1.7 percent, surpassing the overall state decline. For a better understanding of repeat sales from the median approach, see Texas Home Price Index Explained – REC 101.

The Texas Repeat Sales Home Price Index (Jan 2005=100), which is a more accurate reflection of home price changes, fell 0.4 percent MOM in June but increased 1.4 percent year over year (YOY). Austin’s annual appreciation remains below the state’s average and fell by 1.5 percent YOY in June.
Source: Texas Housing Insight | Texas Real Estate Research Center (tamu.edu)
BY JOSHUA ROBERSON, RHUTU KALLURWESLEY MILLER (August 6, 2024)


All measurements are calculated using seasonally adjusted data, and percentage changes are calculated month-over-month, unless stated otherwise. Data are current as of June 22, 2024.

Housing activity for both new and existing homes decreased in May. Despite a rise in active listings, home prices remained the same at $340,000 for the second month in a row.
Texas witnessed a 4.2 percent decrease in total seasonally adjusted home sales month over month (MOM), resulting in 27,845 homes sold (Table 1). Austin and Dallas experienced decreases of 4.5 percent (2,731) and 2.4 percent (7,920), respectively. However, San Antonio and Houston experienced slight increases of 1.7 percent (3,049) and 1 percent (7,623). Overall, there has been a significant downward trend for sales compared with the past few years.
New listings have been steadily increasing, although there is a slight drop of 2.9 percent (45,878) in May. Among the Big Four, San Antonio experienced the only increase at 6.4 percent. Austin saw the largest decline at 13.3 percent while Dallas dropped 6.6 percent. Houston’s new listings were relatively unchanged.
The state’s average days on the market (DOM) remained unchanged at 57. Austin and San Antonio each fell by two days while Dallas has remained at 50 days for two months. San Antonio continues to have the highest days on market among the Big Four with 71 days followed by Austin at 65 and Houston and Dallas have continued to average 50.
The number of active listings went up from 111,053 to 116,404 (4.8 percent). The level of active listings increased across three of the Big four with Dallas (7.3 percent) and Austin (6.3 percent) leading the way with 26,758 and 11,604 listings, respectively.
Pending listings during May have been on a decline of 7.5 percent. All the Big Four except Houston experienced a substantial decline during this month. San Antonio pending listings fell the most dropping 10.6 percent followed by DFW and Austin dropping 8.4 and 7.8 percent, respectively. Houston was the only major city that experienced an increase in pending listings of less than 1 percent. The slowdown in sales and pending listings have contributed to the higher-than-normal active listing count.
Treasury and mortgage rates remain below their peak 2023 levels but have been increasing since the start of the year. The average ten-year U.S. Treasury Bondyield fell six basis points to 4.48 percent. The Federal Home Loan Mortgage Corporation’s 30-year fixed-rate fell by two basis points to 7.52 percent.
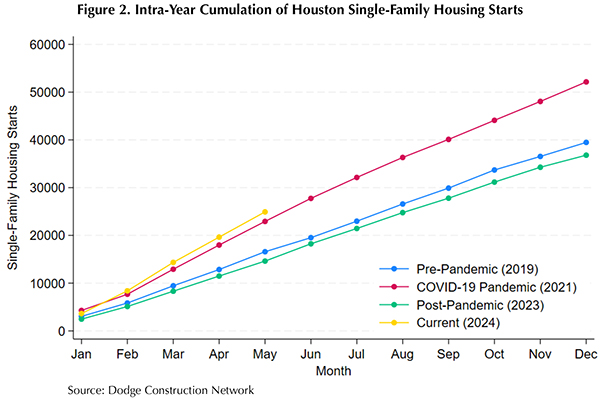
Outside of Hurricane Harvey (and a data anomaly in June 2019), Houston’s single-family housing starts were relatively stable month to month during the 2010s, exhibiting a slight downturn during the 2015 oil bust followed by a steady upward trend in the latter half of the decade. Figure 1 illustrates the trend breaks and increased volatility that characterized the COVID-19 pandemic and post-pandemic eras. Historically, low interest rates and a shift in preferences toward more living space (for both health concerns and work-from-home accommodations) fueled demand for single-family housing. Homebuilders, who also leveraged lower costs of financing, responded with a surge in single-family housing starts to levels not seen since the onset of the Great Recession.
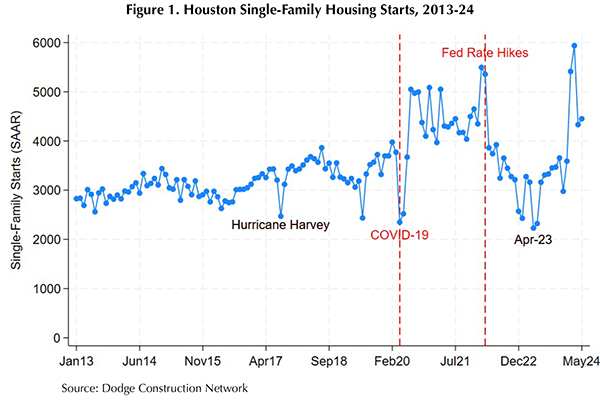
The Federal Reserve’s interest-rate hike in March 2022 marks a transition in the post-pandemic period, when housing starts descended and bottomed out at decade-level lows. In the second half of 2023, however, Houston housing starts trended near pre-pandemic levels, and activity surged to a record-high in March 2024. Despite correcting downward from the spring-time surge, the volume of starts remained above pre-pandemic levels. Figure 2 plots the intra-year progression of single-family start totals, highlighting the current trajectory in context of pre-pandemic, COVID-19 pandemic, and post-pandemic economic conditions. Houston is on a record-setting pace for single-family housing starts in 2024, but economic disruptions from Hurricane Beryl and projections of a hyper-active hurricane season present headwinds and short-run uncertainty.
Texas’ number of single-family construction permits decreased by 2 percent MOM, reaching 13,539 issuances. San Antonio had the biggest monthly increase adding 1,048 permits or 9.7 percent. Houston had a slower month for permits with a decline of 15 (4,098) percent, following a big increase in April. Dallas decreased by a negligible 0.4 percent (4,207). Austin experienced a modest increase of 1.7 percent (1,409).
Construction starts declined according to data from Dodge Construction Network. Seasonally adjusted single-family starts decreased by 3.09 percent MOM to 13,290 units. After a massive drop in April of 27 percent, there was a slight upward swing in single-family starts for Houston of 2.8 percent (4,452). Dallas dropped by 17.8 percent (3,451) while San Antonio and Austin reported modest increases of 3.2 percent (892) and 1.6 percent (1,420), respectively.
The state’s total value of single-family starts climbed from $11.8 billion in May 2023 to $16.65 billion in May 2024. Houston accounted for 36.4 percent of the state’s total starts value followed by Dallas with 26.4 percent.
Texas’ median home price has remained stable at approximately $340,000 for four months (Table 2). The prices have remained stable this month with San Antonio and Houston increasing by 0.4 percent and 0.2 percent, respectively. Austin and Dallas both have declined by 0.4 percent. Despite there being an increase in new listings and active listings, housing prices have remained resilient. The Texas Repeat Sales Home Price Index (Jan 2005=100) grew 0.4 percent MOM and 2.2 percent year over year (YOY). Austin’s annual appreciation remains below the state’s average, falling by 1.5 percent YOY.
Source: Texas Housing Insight | Texas Real Estate Research Center (tamu.edu)