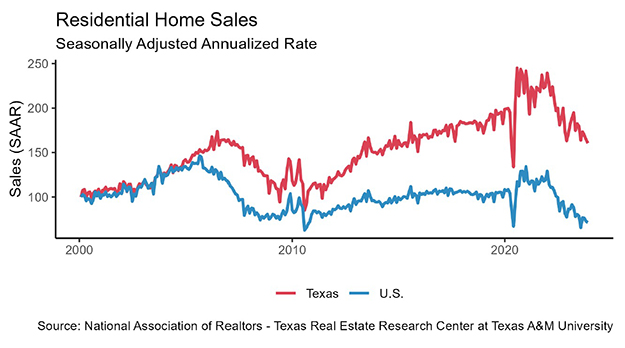


Seasonally adjusted housing sales bounced back in April following March’s decline. New listings
grew for the fourth month in a row resulting in the total active listings count growing to its highest level since July 2012. Home prices remained the same at $340,000 for the second month in a row.
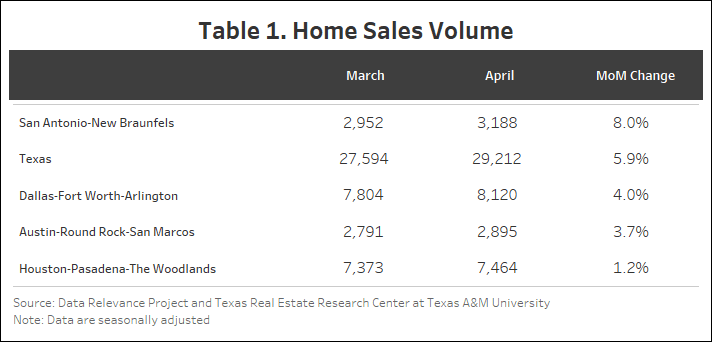
New Home Listings on the Rise
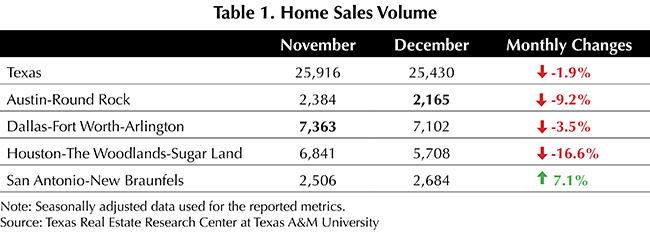
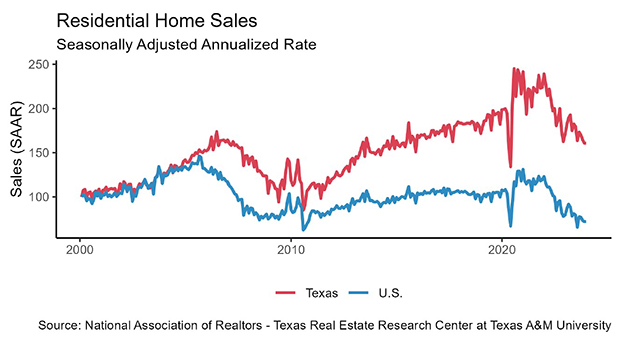
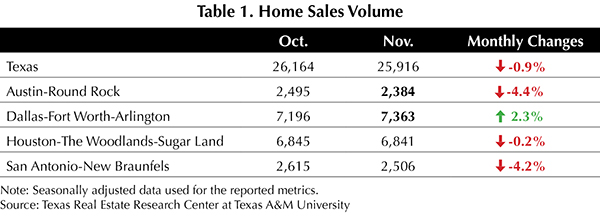
Texas witnessed a 5.9 percent increase in total seasonally adjusted home sales month over month (MOM), resulting in 29,212 homes sold (Table 1). All the major cities saw a slight increase in home sales. Previously, San Antonio had the highest decline at 9.2 percent, but looks to be recovering at an increasing rate of 8 percent—the highest among the Big Four, followed by Dallas at 4 percent.
New listings have been steadily increasing from December to April (2.8 percent) with only a slight decline of 0.5 percent in March. The April 2024 number stands at 47,000. Among the Big Four, Dallas has been declining for two months and is currently at 11,523 new listings. Austin, however, has increased by 25 percent between January and April.
The state’s average days on the market remained unchanged at 57. Austin fell by almost four days while Dallas rose by less than one. San Antonio is the only Big Four metro to experience an increase of a little over three days. As of April, San Antonio had the highest days on market of the Big Four, at 72 days. Austin followed at 66 days. Houston had the lowest at 46 days.
The number of active listings went up from 106,428 to 111,707 (4.9 percent) following the increase in new listings. Pending listings during April went up by only 0.6 percent. This growth was driven largely by Houston (10 percent) but offset by Dallas (5.6 percent) and San Antonio (3.3 percent). The Big Four experienced an upward trend in active listings with an addition of 1,555 for Austin (16.5 percent). Houston experienced a similar increased trend in active listings (10.7 percent) with an addition of 2,788 listings, almost five times that of the previous month. Dallas and San Antonio experienced relatively modest increases of 8.2 percent and 2 percent, respectively.
Interest Rates on the Rise
Treasury and mortgage rates remain below their peak 2023 levels but have been increasing since the start of the year. The average ten-year U.S. Treasury Bond yield jumped almost 33 basis points to 4.54 percent. The Federal Home Loan Mortgage Corporation’s 30-year fixed-rate rose by 17 basis points to 6.99 percent.
Housing Highlight
The housing market may be adjusting to a new normal that is characterized by an average 30-year fixed mortgage rate above 6 percent. Despite the persistence of higher mortgage interest rates, Texas’ residential mortgage activity is steadily improving as more pre-approved customers are searching for homes. Texas’ robust labor market and general economic strength are supporting housing demand despite scattered signals of financial distress across the nation. Financial vulnerability (e.g., rising credit card delinquencies) are currently concentrated on the lower end of the income distribution, where households are less likely to be prospective homebuyers. While that credit-health distinction somewhat shields the home-purchase market, it has broader implications for housing affordability and may carry consequences for the future economy.
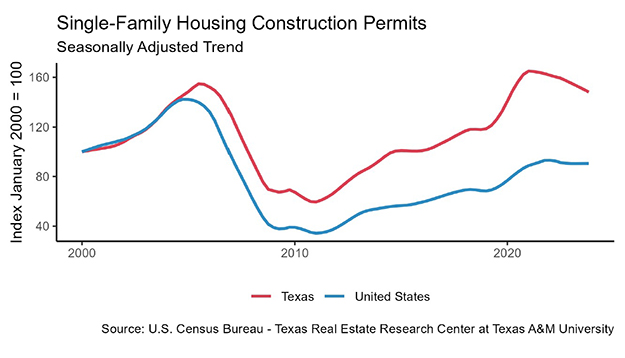
Single-Family Starts Declining
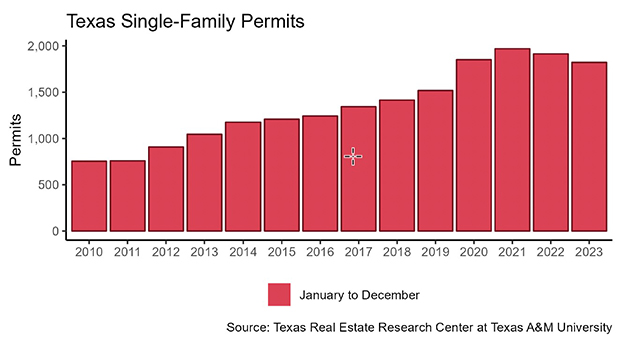
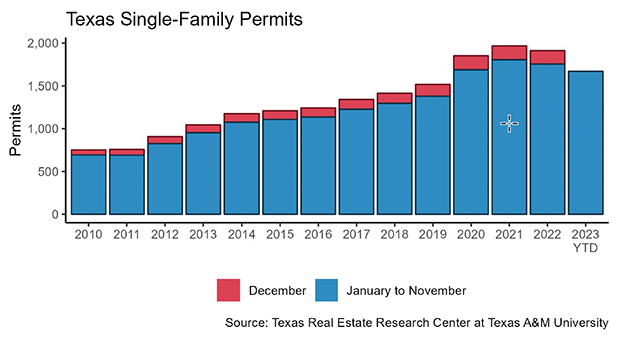
Texas’ number of single-family construction permits increased by 0.9 percent MOM, reaching 13,805 issuances. After a massive dip in March, Houston has increased by almost 30 percent while all other major cities experienced moderate changes. Austin was the only city that had a fall of 5.9 percent (1,411) while San Antonio and Dallas experienced slight increases of 3.5 percent (953) and 1.6 percent (4,063), respectively.
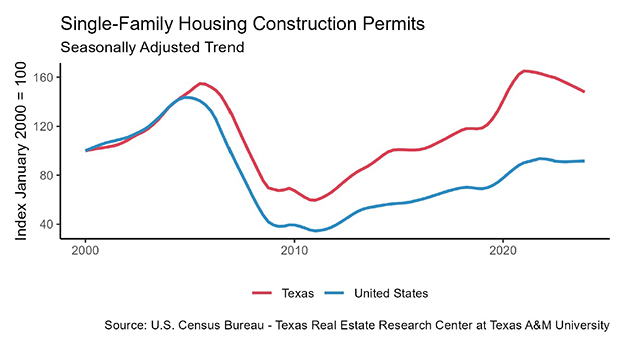
Construction starts reduced according to data from Dodge Construction Network. Seasonally adjusted single-family starts decreased by 15.1 percent MOM to 13,731 units. Part of the pullback could be because February was such a strong month for starts, signaling an earlier-than-normal start to the construction home season. Houston had been experiencing an almost vertical increase from 56.8 percent in February, which began to slow down and has declined by 25.2 percent, while Dallas increased slightly by 10.7 percent (4,052). In contrast, Austin and San Antonio saw declines of 17.5 percent and 4.6 percent, respectively.
The state’s total value of single-family starts climbed from $9.15 billion in April 2023 to $13.19 billion in April 2024. Houston accounted for 36.2 percent of the state’s total starts value. Starts value activity is up from last year as Austin and San Antonio also posted moderate increases.
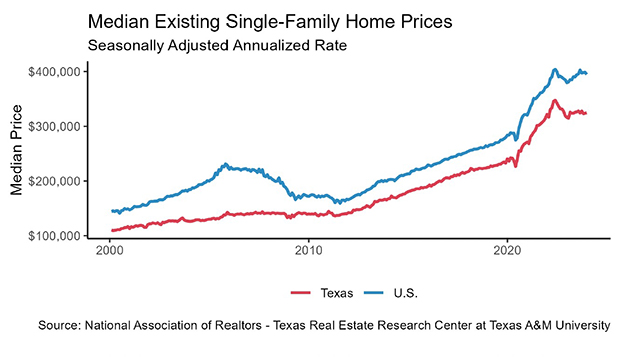
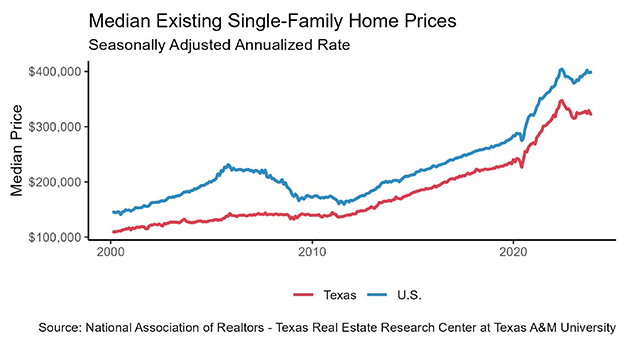
Home Prices Stabilizing
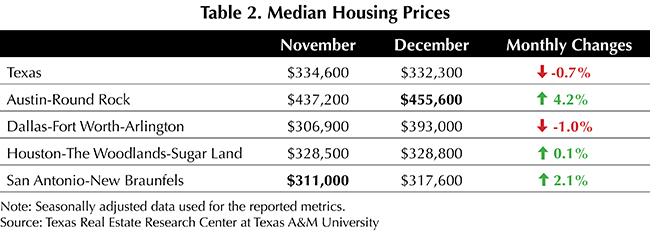
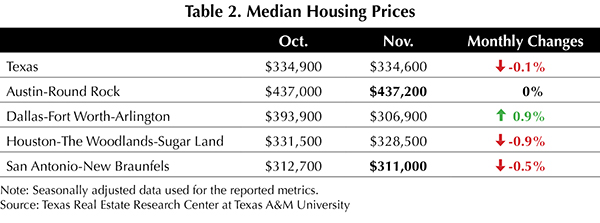
Texas’ median home price has remained stable at approximately $340,000 for two months (Table 2). However, across most major metropolitan areas, home prices saw a decline. Notably, Austin experienced an increase of 5.1 percent, moving the price from $421,572 to $443,247. Austin had the highest increase among the four major cities with a price change of $21,675. Prices increased by 2.1 percent in Houston and by a mere 0.7 percent in Dallas. San Antonio is the only city among the Big Four to experience a decline (0.9 percent).

The Texas Repeat Sales Home Price Index (Jan 2005=100) grew 0.9 percent MOM and 2.6 percent year over year (YOY). Austin’s annual appreciation remains below the state’s average, falling by 2 percent YOY.