
Housing was one of the primary contributors to inflation in 2022. The pandemic-induced housing frenzy officially ended when the Federal Reserve began raising interest rates in June in an attempt to curb inflation. Since then, mortgage rates and the possibility of a recession sidelined many potential buyers. Demand in Texas plummeted as annual housing sales fell more than 10 percent. Supplies started returning to pre-pandemic levels. Amid 2022’s drastic changes, many housing indicators improved as homebuilders and buyers quickly adapted.
Supply1
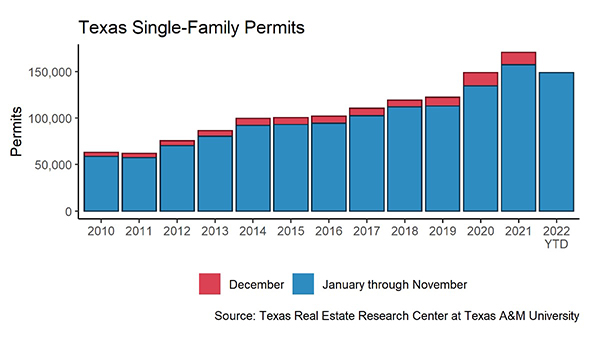
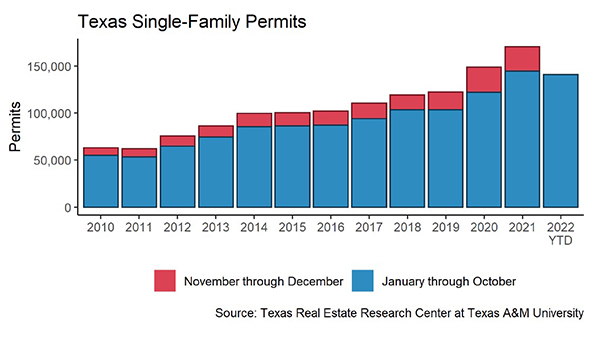
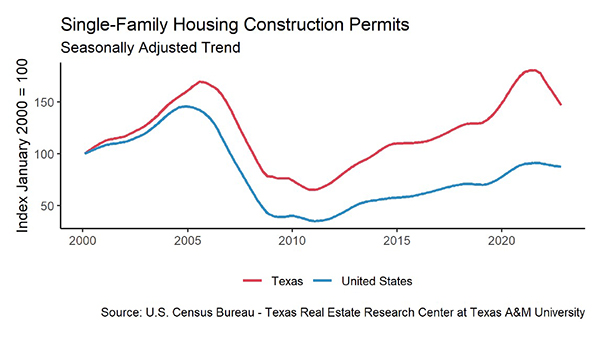
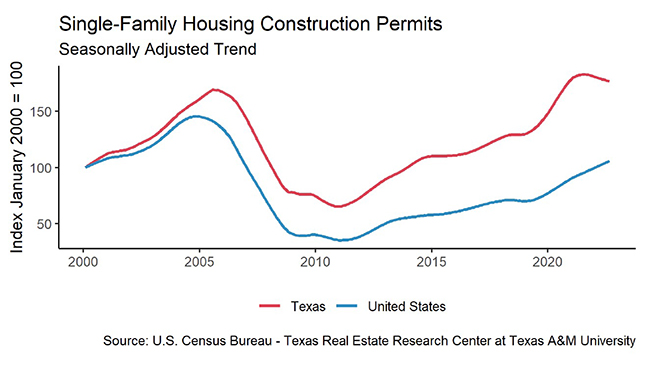
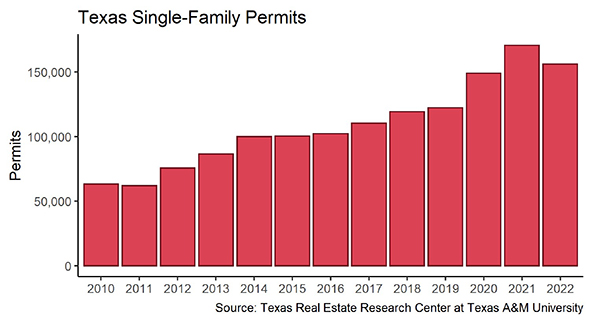
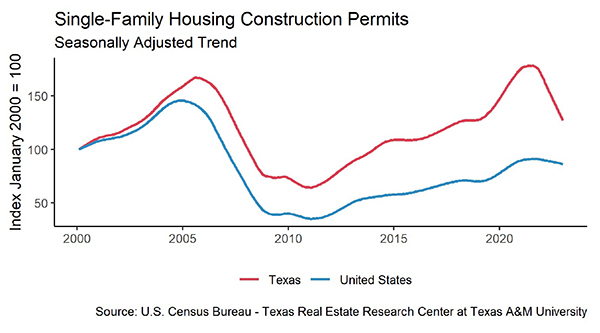
Homebuilders initiated fewer building projects than they did before the pandemic. Year-end single-family construction permits had a net loss of 8.4 percent year-over-year (YOY), shrinking from 170,557 permits to 156,189 permits in 2022. Monthly permits were flat in December, with fewer than 10,000 permits issued. Construction permits fell in all major metros. While housing demand in Dallas (2,786 permits) was mostly flat, Houston (2,886 permits)—the metro with the most construction permits in the nation—dipped 10 percent month-over-month (MOM). The gap between Austin’s (982 permits) and San Antonio’s (592 permits) housing expansion narrowed, as Austin’s monthly construction demand fell below 1,000 monthly permits for the first time since 2016.
Construction generally slows during the winter, and Texas’ single-family construction starts plummeted 33.5 percent from December 2021 to 10,203 units, corroborating a slowdown in the housing industry when accounting for the winter slump. According to Zonda, quarterly construction starts continued the fall from 3Q2022 in Texas’ four major metros except for Dallas-Fort Worth (DFW). While DFW’s construction starts rebounded 26.4 percent quarter-over-quarter (QOQ) and surpassed pre-pandemic levels, the remaining three metros fell short of 4Q2019 levels.
The state’s total single-family starts value diminished from $44.5 billion in 2021 to $38.4 billion. Houston and Dallas together contributed more than half of the state’s total at 29.6 percent and 26.6 percent, respectively. Austin’s market share was double that of San Antonio at 12.8 percent.
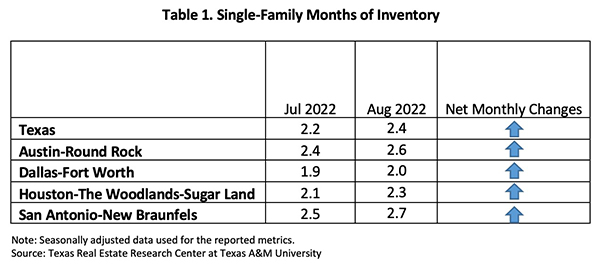
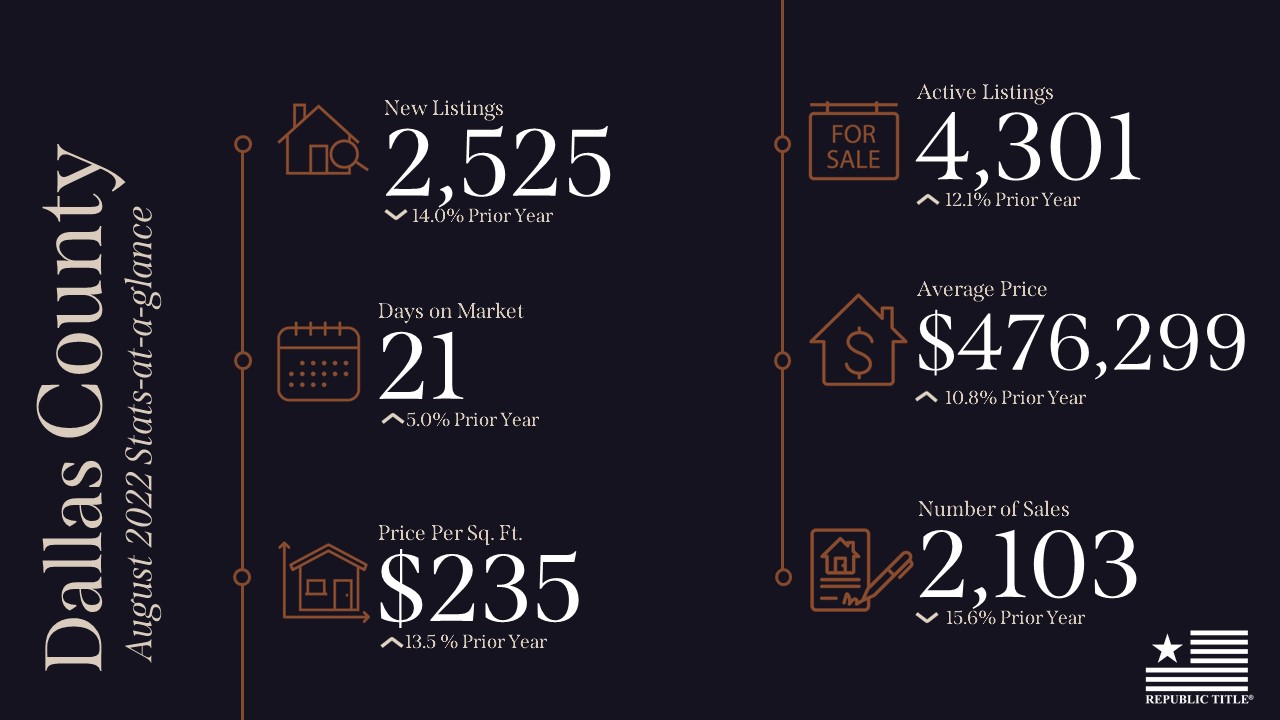
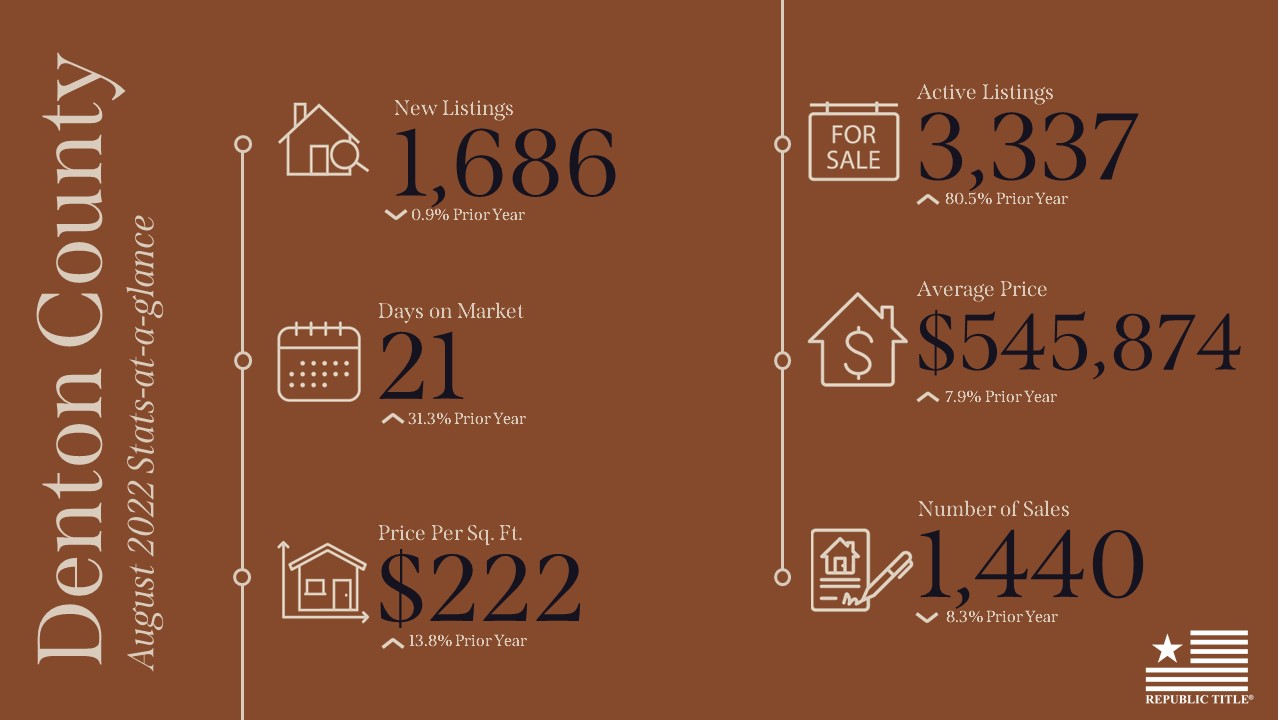
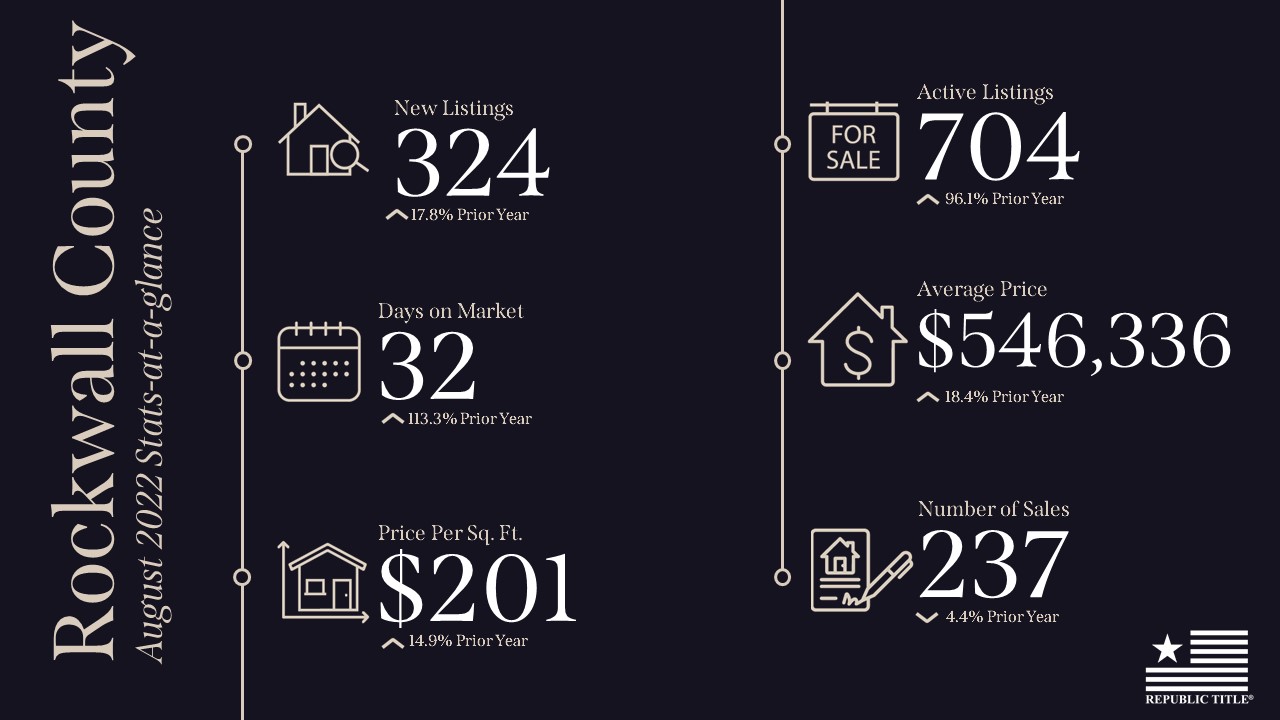
Active listings were flat at a seasonally adjusted rate of 91,600 units. Compared with the five-year average of 94,800 units before the pandemic, housing inventory was only 4.5 percent away from returning to the pre-pandemic volume. A year prior, inventory fell 50 percent short of pre-pandemic levels. Active listings in Austin fell 7 percent from November’s peak to 8,400 units, the first monthly dip since March 2022. This modest decline suggests Austin’s housing market may have returned to the traditional ebbs and flows seen before covid. Amid the recent slowdown, statewide months of inventory (MOI) ticked up to three months. The MOI for the four major metros ranged from 2.6 months to 3.4 months. While Dallas, Austin, and San Antonio inventories returned to pre-pandemic levels, Houston’s inventory was still below.
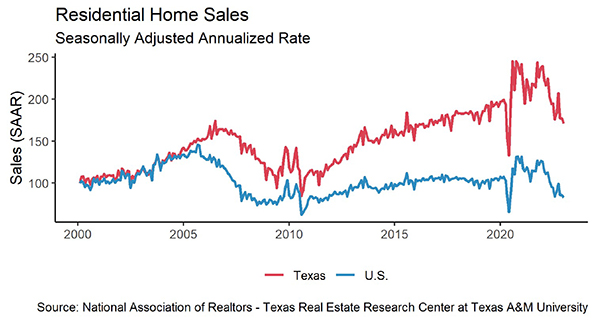
Demand
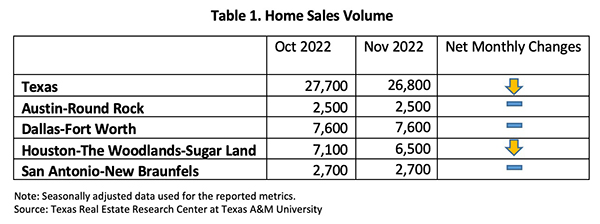
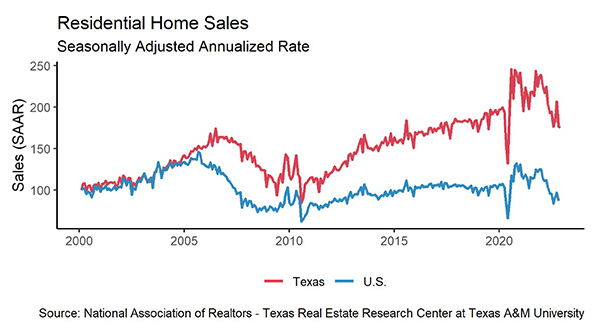
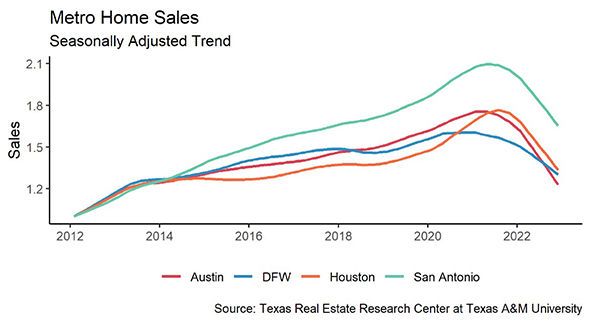
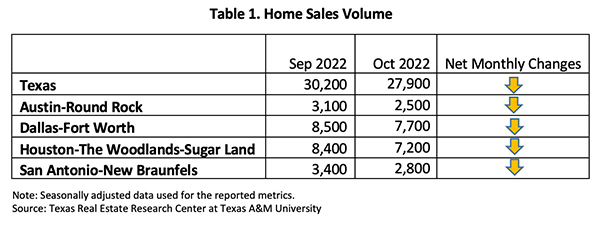
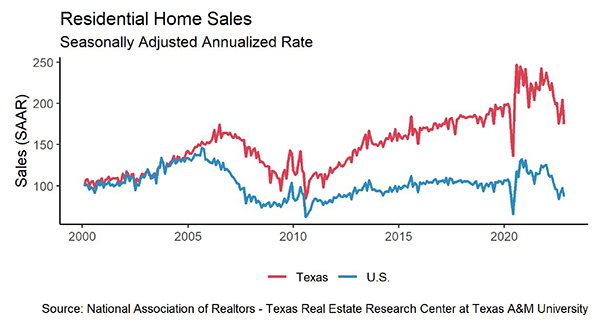
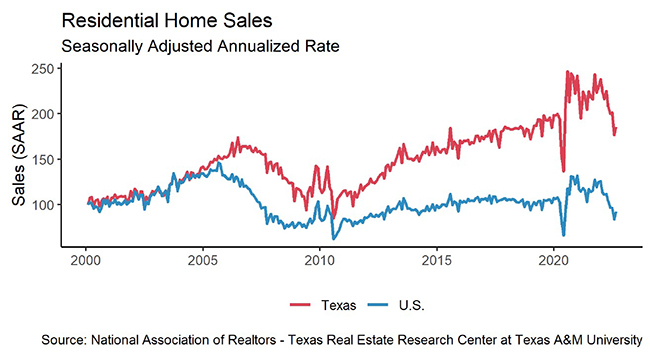
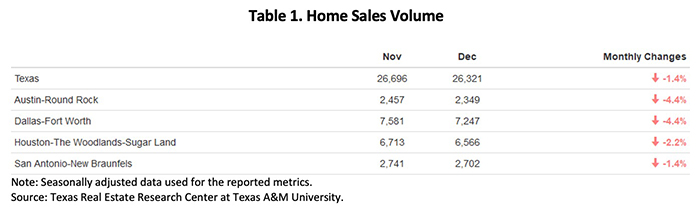
Nearly 30 percent of total home sales vanished from December 2021 to December 2022. In the past 12 months, sales volume sank from 37,200 to 26,300 closed listings. On a yearly basis, Houston lost the most in terms of both percentage and total volume, losing close to 35 percent and 3,500 units. On a monthly basis, Austin and Dallas lost the most in terms of YOY percent decline at 4.4 percent (Table 1).
Rising mortgage rates affect home sales disproportionately across price cohorts. For example, when the housing frenzy started to cool in the first half of the year, the affordable home market (homes below $300K) was hit first, beginning a streak of quarterly declines. Next, as the Fed’s interest rates became more aggressive in the second half of the year, the higher-end home market (homes above $750K) was hit worst, shrinking in a downward trend twice as fast as the affordable home market’s declining rate. Thus, affordable housing was hit first by rising mortgage rates with pricier homes following suit later in the year.
With sales activity slowing, homes are sitting on the market longer. Texas’ average days on market (DOM) rose to 52. Compared with the five-year average of 59 days before 2020, the latest DOM metric suggests the housing market is quickly approaching historic norms. Annually, Austin’s DOM rose most aggressively, jumping from 19 days to 67 days. Constrained by diminishing sales, Houston had the most moderate DOM rebound, rising from 32 to 51 days.
Before the pandemic, the state’s DOM ranged from 55 days to 83 days. Now, DOM ranged from 48 days to 59 days. The relatively truncated DOM interval implies the housing market still has room to improve. Another metric that signals the housing market can be more relaxed is DOM for pricier homes. Typically, the most expensive homes sit on the market the longest. However, DOM for homes priced over $750K was 50 days—shorter than homes in the $400K-$500K price cohort.
Prices
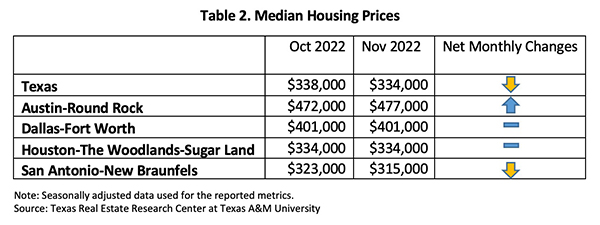
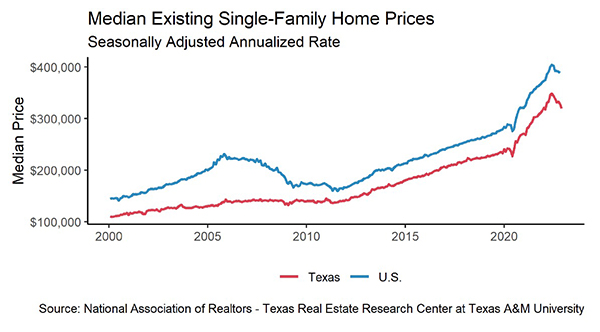
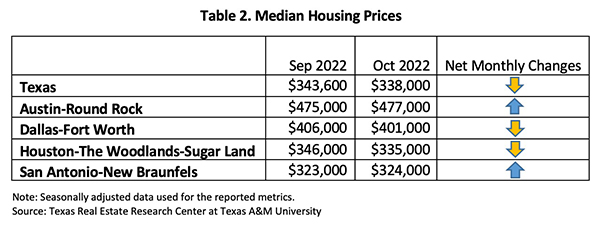
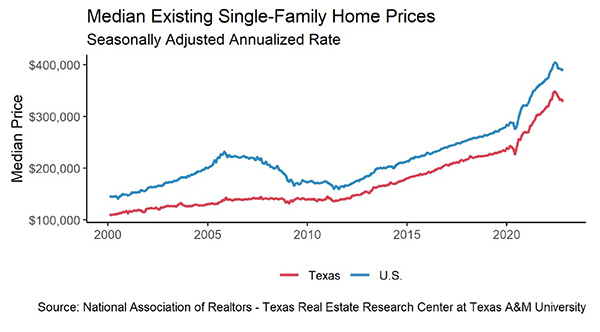
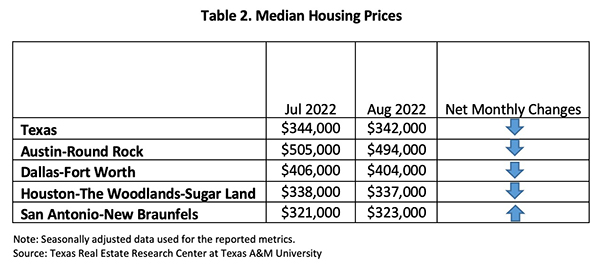
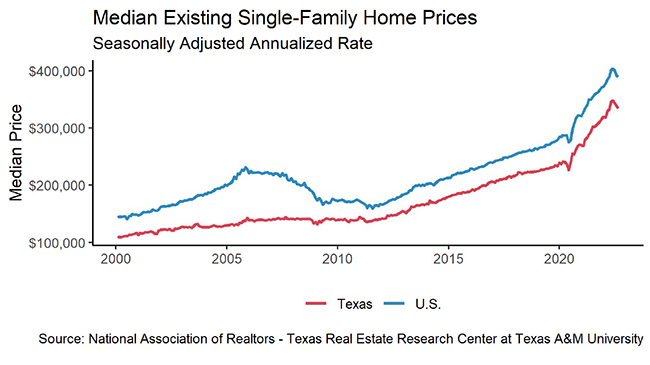
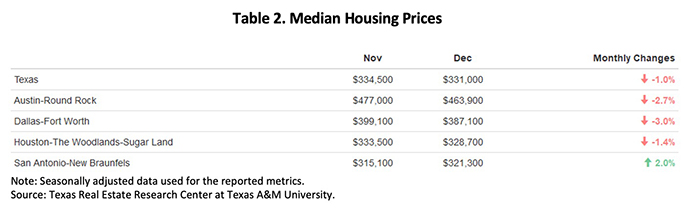
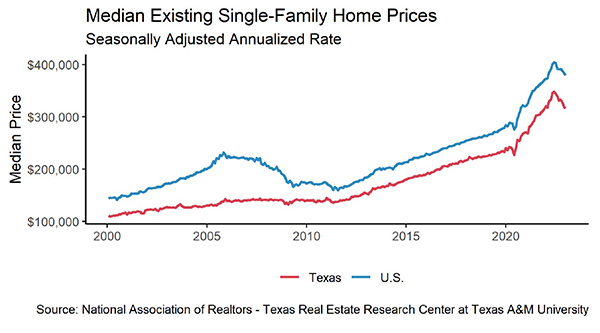
Texas’ median home price peaked in May at $349,900 and has since been falling. Despite the price correction in the second half of the year, the state’s median price still rose 3.7 percent compared with a year ago. Homes in the Austin metro were most volatile, as the median price fell more than $78,000 from its peak, settling at a seasonally adjusted rate at $463,900 (Table 2). Austin was also the only metro area that reported a net loss YOY, while Dallas, Houston, and San Antonio reported YOY growth between 4.4 and 6.1 percent.
Median home price for new construction was over 15 percent higher than existing homes.
The ten-year U.S. Treasury bond yield dropped 27 basis points to 3.6 percent2 in December, while the two-year counterpart was at 4.3 percent. The spread between the ten- and two-year bond yields continued to widen. The negative spread indicated persistent market uncertainties, and ten-year bond yield was still far below 2007’s peak of 5.1 percent. The Federal Home Loan Mortgage Corporation’s 30-year fixed-rate moderated slightly this month to 6.4 percent, dropping from an all-time high of 6.9 percent in October.
Rapidly rising mortgage rates hit home prices hard over the past 12 months. The Texas Repeat Sales Home Price Index accounts for compositional price effects and provides a better measure of changes in single-family home values. Compared with December 2021’s 20.1 percent YOY increase, Texas’ index accelerated 5.5 percent YOY in December 2022, indicating price normalization. The same trend also affected the major metros as growth rates shrank from double- to single-digits, except in Austin, which had a net loss in home values.
According to the Texas Housing Affordability Index (THAI), purchase affordability decreased to 1.1 in 4Q2022, indicating median family income was 10 percent more than the required income to buy the median-priced home. This metric was down 35 basis points from 1.45 in 4Q2021, and it suggested that despite slowing home price appreciation, households faced more financial burden to buy a home due to the higher mortgage rate. For more information on how higher interest rates affect homebuying, read “How Higher Interest Rates Affect Homebuying.”
_________________
1 All measurements are calculated using seasonally adjusted data, and percentage changes are calculated month over month, unless stated otherwise.
2 Bond and mortgage interest rates are nonseasonally adjusted.
Source – Joshua Roberson and Weiling Yan (February 14, 2023)
https://www.recenter.tamu.edu/articles/technical-report/Texas-Housing-Insight