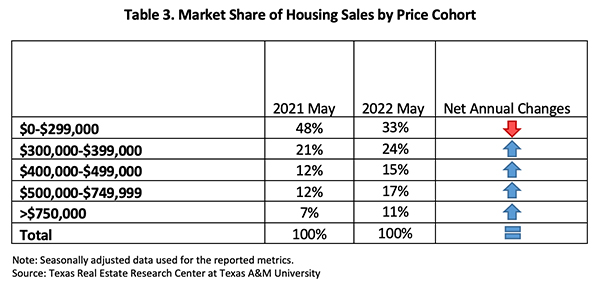

Texas’ housing market continues to cool as sales volume declines and housing inventories rise. While the pace of new listings begins to overcome housing sales, home prices are still elevated due to the tremendous housing pressures realized after the start of the COVID-19 pandemic. Even though home prices are still high, price growth is now retreating, providing a respite for potential buyers.
Supply*
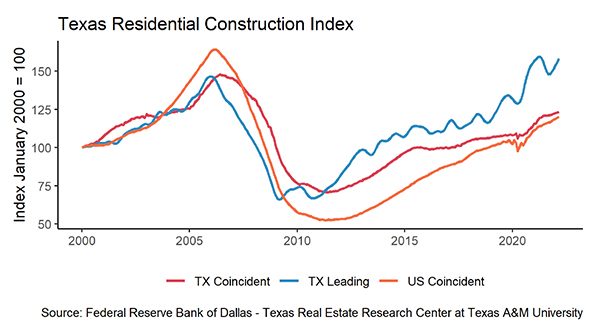
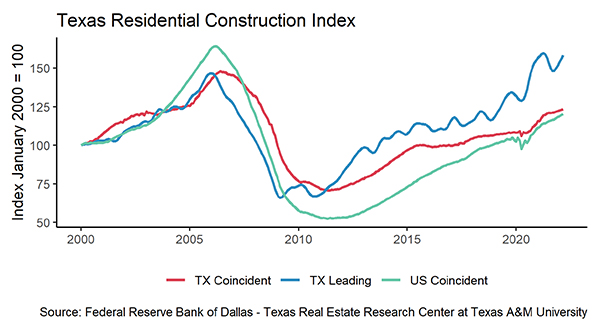
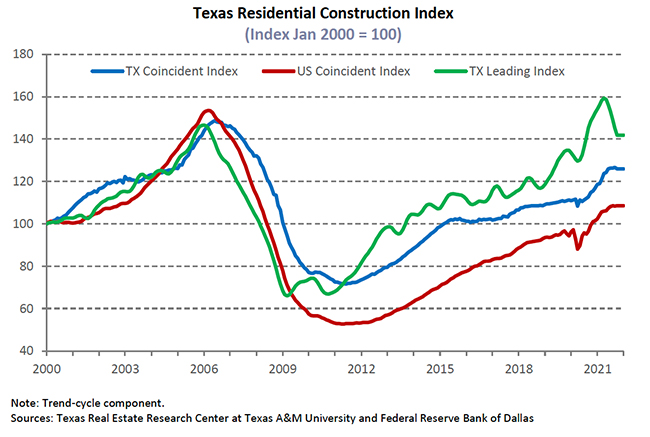
According to Zonda, supply-side activities at the earliest stage of the construction cycle flattened at first quarter levels as inventory losses in Austin’s vacant developed lots (VDLs) offset gains in Dallas, Houston, and San Antonio. The number of new VDLs in Austin shrank 24 percent from last year’s quarterly average. Lot development in the $300k-$500k price cohort composed half of Austin’s total VDL investment, but it saw a double-digit reduction quarter over quarter (QOQ) while the same investment cohorts in other metros advanced.
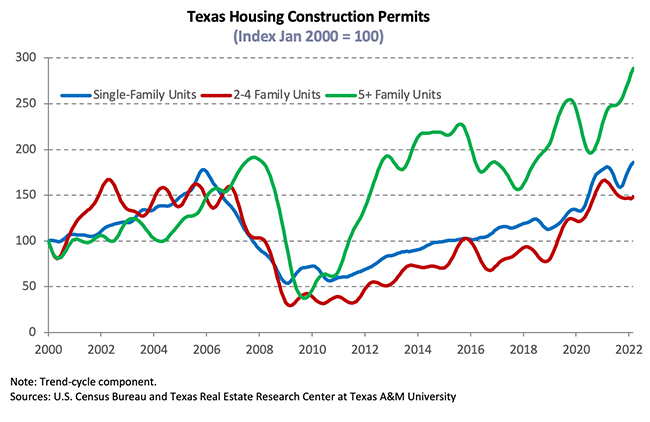
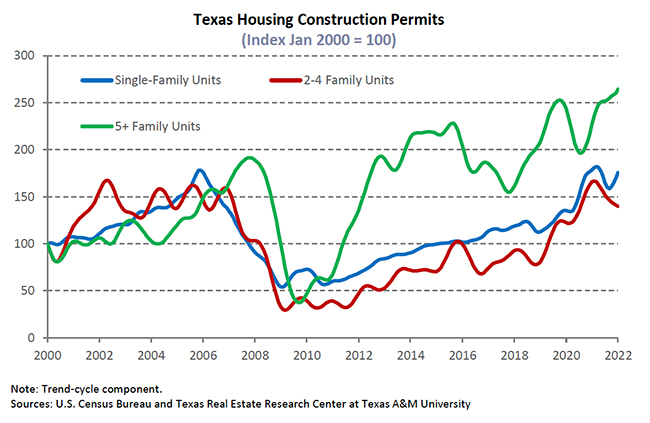
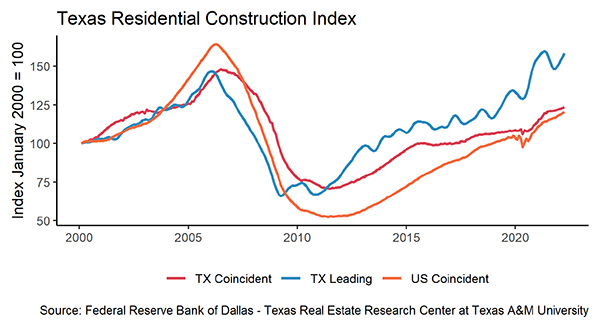
Starting in May, Texas’ single-family construction permits retreated below 15,000 per month, declining 5.2 percent QOQ. Building permits fell significantly in Austin and Houston. Despite the drop, Houston and DFW remained the top two metropolitan areas on the national permit list. Each had a seasonally adjusted rate of over 4,000 permits for new-structure building or existing-structure renovation. In Central Texas, Austin issued 1,800 permits, while San Antonio issued 900. Meanwhile, Texas’ multifamily sector surged to 9,900 construction permits in June, the highest level since 2015. Permits for two-to-four units and five-or-more units expanded at 39.8 percent and 26.3 percent QOQ, respectively.
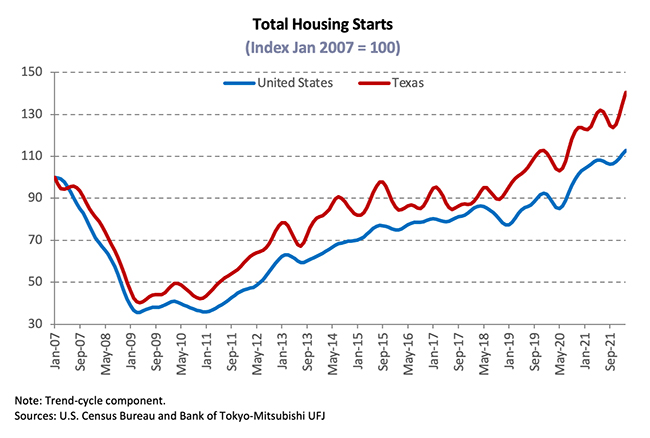
Lumber price trended downward, declining 19.6 percent in a month. As the lumber price reduction lowered the framing cost by nearly one fifth, total Texas housing starts increased 6.2 percent QOQ. Zonda data revealed roughly 38,800 homes broke ground in the major metros over 2Q2022. Amid the construction expansion, all metros saw an uptick except Houston, where housing starts contracted 1.5 percent. Dallas had the most housing starts and luxury home construction projects. For every six houses built in the median price cohort of $400k-$499k, one house priced over $1 million was built. While housing starts inched up, single-family private construction values tumbled to a six-month low, corroborating the lowered construction costs. All major metros except San Antonio reported negative quarterly growths.
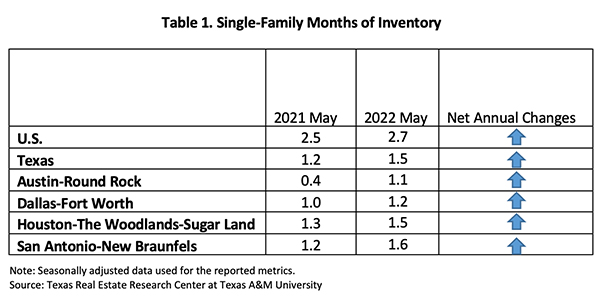
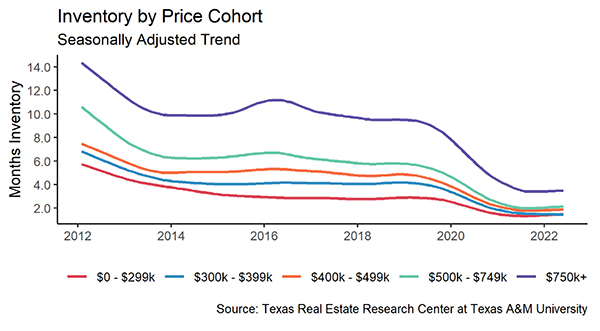
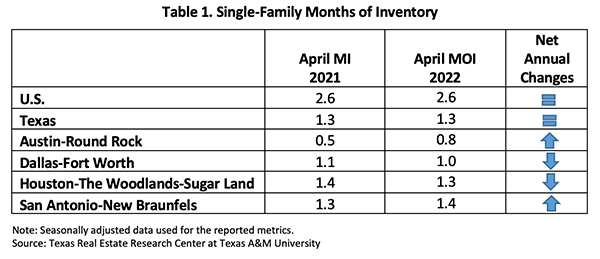
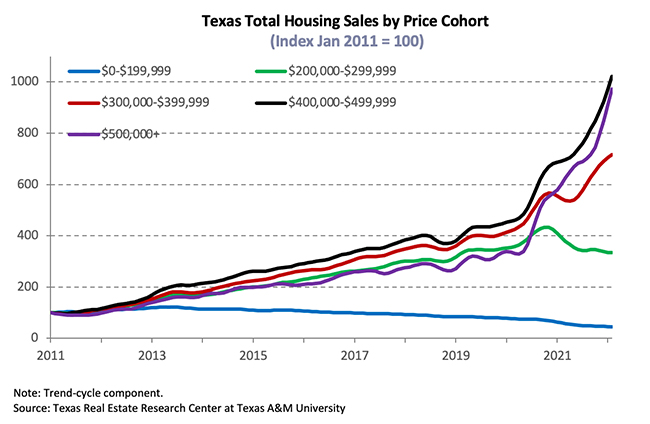
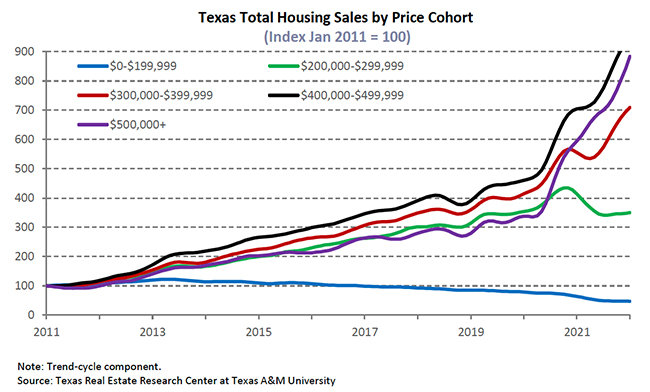
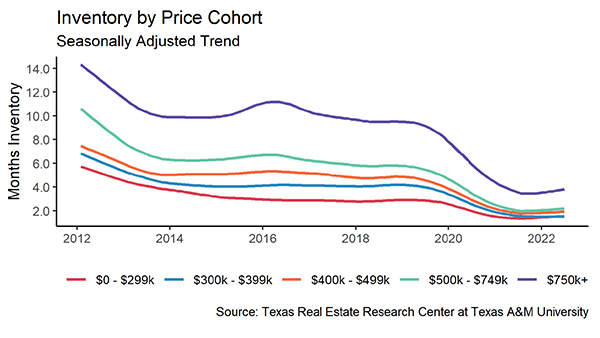
While Texas’ overall housing supply remains historically low, inventory throughout the state is currently on the rise. Texas’ months of inventory (MOI) has gradually increased over the past few months, doubling from one month in February to two months in June. At the metropolitan level, inventories grew most robustly in Austin. Austin’s MOI surpassed DFW’s and Houston’s for the first time since 2019. By price cohort, inventories jumped for homes priced between $300,000 and $500,000.
Prices
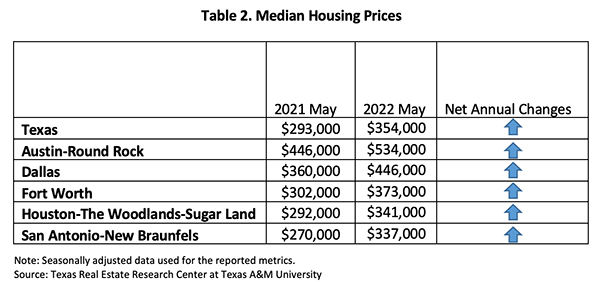
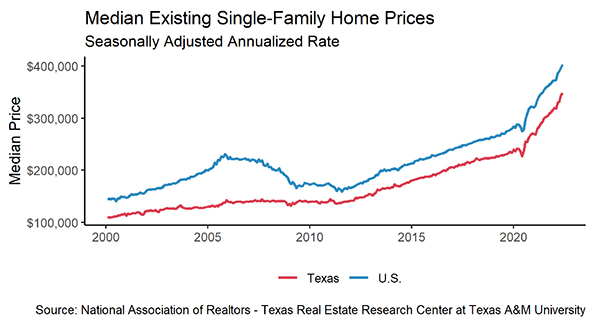
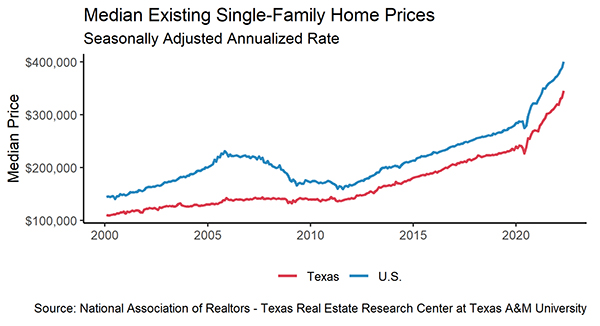
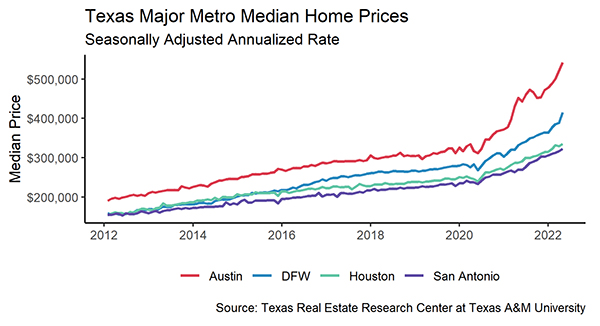
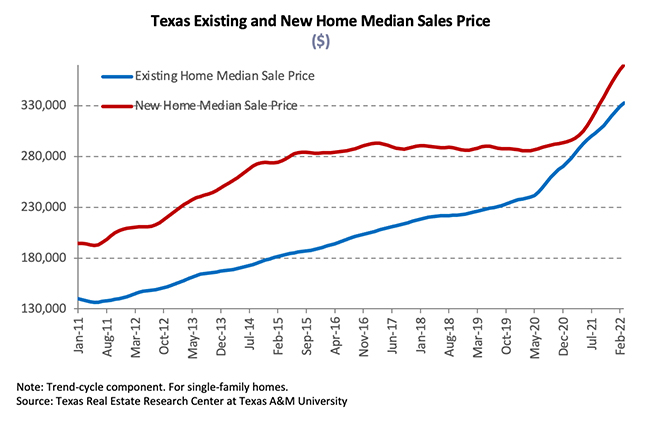
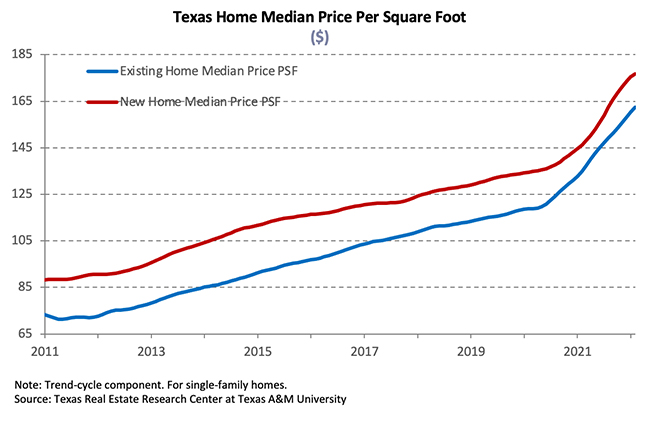
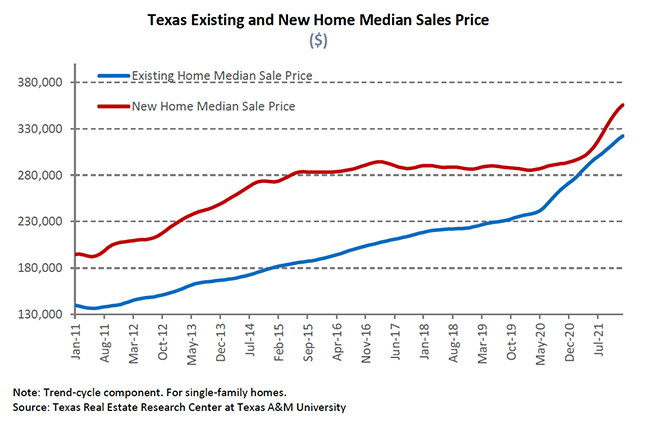
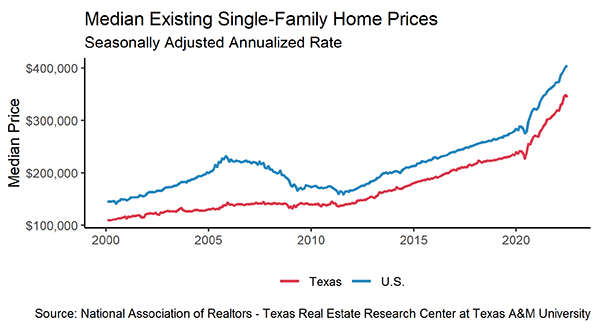
The Texas median home price may have reached a peak as the June value leveled out at a seasonally adjusted rate of $349,000, which is $3,000 below May and the first drop in home prices since December 2020. While home price growth may be slowing, current prices remain significantly higher than before the pandemic. Except for San Antonio, each of the big four metros had a slight dip in median home prices for June. Austin had the largest seasonally adjusted single-month dip in June at 3.7 percent, while DFW fell 0.8 percent.
The Texas Repeat Sales Home Price Index, which accounts for compositional price effects, corroborated substantial home-price appreciation as the index inched up 17.1 percent year over year (YOY). The falling prices pulled down YOY statewide growth by 3 percent in the last six months. Austin fell from the fastest appreciating metro to third place behind Dallas and Fort Worth.
The Texas Housing Affordability Index (THAI) reflects the relationship between the median family income in a locale and the computed amount required to purchase a median-priced home. A higher THAI indicates relatively greater affordability. Measured by the THAI metric for first-time homebuyers, Houston was the most affordable metro, followed by San Antonio, Fort Worth, Dallas, and Austin, respectively. Despite the marginal median price decline, Austin remained the most unaffordable metro in the state.
Demand
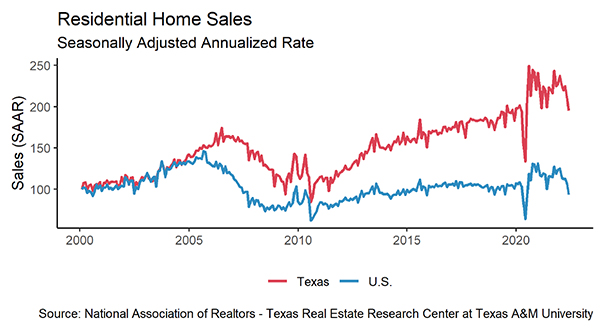
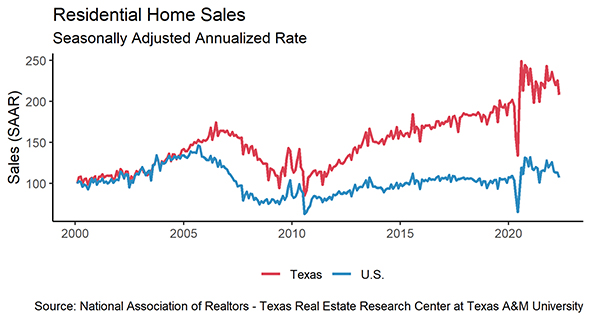
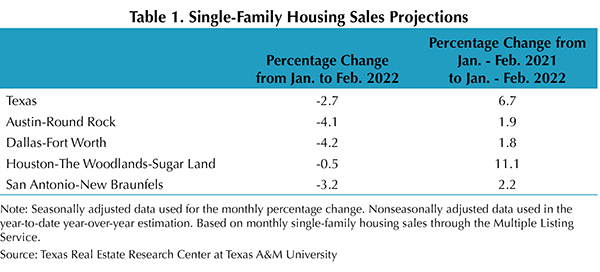
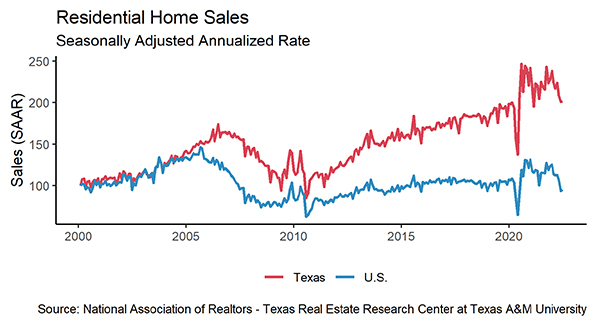
Record home prices and rapidly rising mortgage rates continued to discourage buyers and cool the market. In June, over 37,000 homes were sold throughout the state, 9.4 percent below June 2021 sales. According to seasonally adjusted sale estimates, the slowdown actually began in January of this year, but June had the biggest single-month dip. Even though June sales were down from last year, they’re almost identical to June 2019 sales, which was the last record-setting year before COVID. The drop in home sales coincides with the rapid increase in mortgage rates that began in January but picked up steam in recent months.
Because of softening housing demand, Texas’ average days on market (DOM) has begun to creep up. Seasonally adjusted DOM increased to 34 days, up from 28 days in March. Normally, home sales accelerate in the summer and DOM decreases. That has not happened this summer. Homes sold the fastest in Austin and Dallas, leaving the market in 21 days. Houston’s and San Antonio’s DOMs remained around a month. The DOM for new homes was notably higher than the DOM for existing homes, especially in the Houston area, where new homes on average lasted 60 days on the market while existing homes lasted 23 days.
Homes priced in the $300k and the $400k cohorts were fastest at getting sold, typically leaving the market in 27 days. On the other hand, homes under $300k had a conspicuously longer market duration.
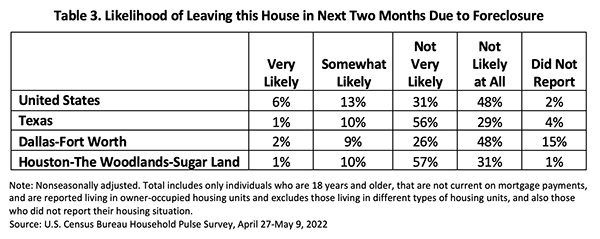
Household Pulse Survey
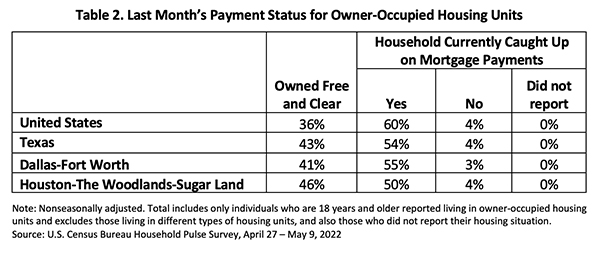
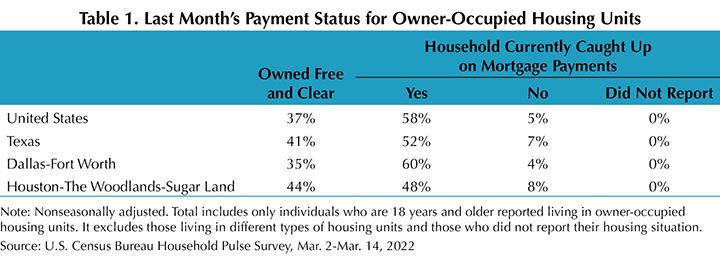
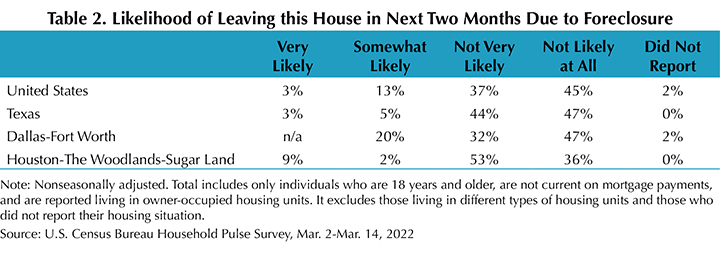
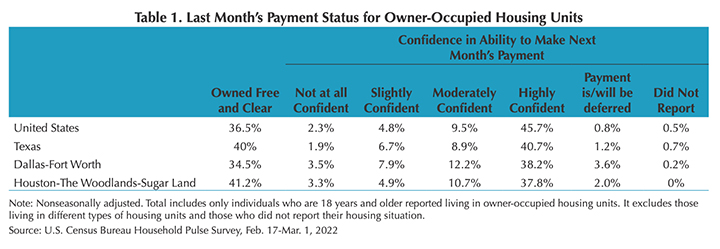
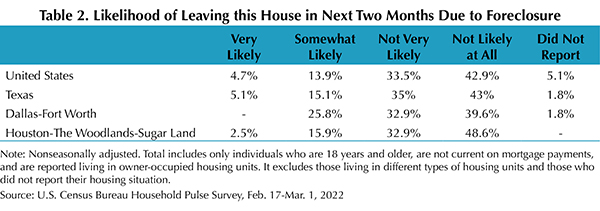
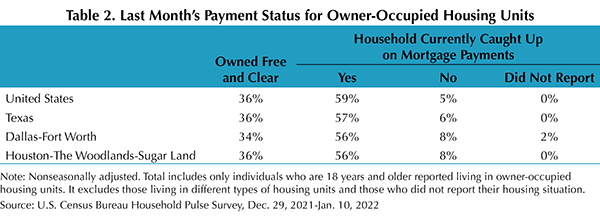
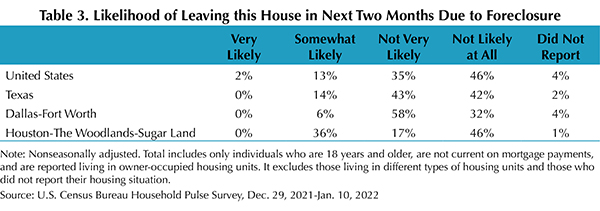
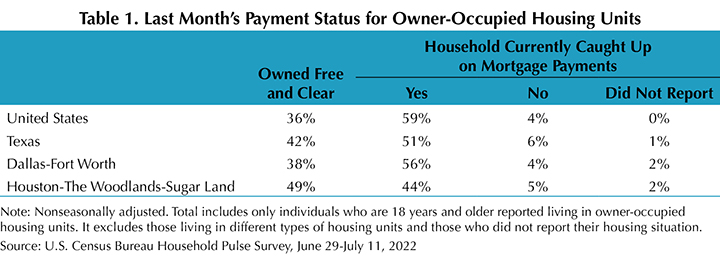
According to the U.S. Census Bureau’s Household Pulse Survey, homeowners are benefiting from last year’s low-interest loans and rising wages. The share of homeowners behind on mortgage payments shrank 1 percent YOY at both the national and state levels (Table 1). Owners’ improved ability to pay their mortgage was notable in Dallas and Houston, as owned free/clear homes in each metro had a 4 percent increase YOY. Furthermore, fewer Texas homeowners who struggled to keep up with mortgage payments faced the possibility of foreclosure. The proportion of delinquent individuals at risk of foreclosure plummeted 70 basis points to 2 percent (Table 2). The share who were “not very likely” to leave their homes in the next two months rose 17 percentage points to 61 percent in Dallas.

________________
* All measurements are calculated using seasonally adjusted data, and percentage changes are calculated month over month, unless stated otherwise.
Source – Joshua Roberson, Weiling Yan, and Rajendra Patidar (August 17, 2022)
https://www.recenter.tamu.edu/articles/technical-report/Texas-Housing-Insight