The Texas housing market was strong for most of 2021 as mortgage interest rates remained low throughout the year. Sales accelerated, and the average home price increased. Demand remained robust as households desired additional space and better neighborhoods. On the other hand, while new listings increased in 2021, the pace wasn’t enough to keep up with demand, particularly for listings in the lower price cohorts. Housing starts increased drastically in the first half of the year but slowed during the second half due to stubborn supply chain issues and mounting backlogs. In a strenuous and uncertain economy, the housing market was defined by shrinking supply and strong demand, putting upward pressure on the housing market, increasing home prices across the state.
Many of the same factors that defined the 2021 housing market will carry over into the new year, namely constrained inventory, which should maintain elevated price levels despite a slowdown in price growth. Nevertheless, Texas Real Estate Research Center economists expect single-family sales to increase 6.2 percent in January 2022. New variants of the virus present ongoing challenges and uncertainty, but the economic and housing outlook has remained positive. Rising mortgage rates will likely slow sales, but an increasing population and limited inventories should sustain home prices for the foreseeable future.
Supply*
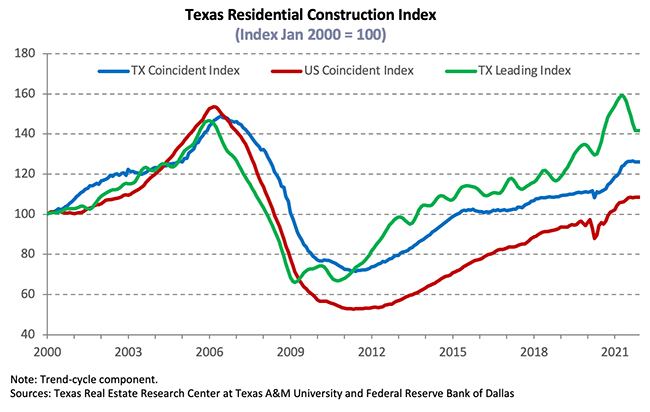
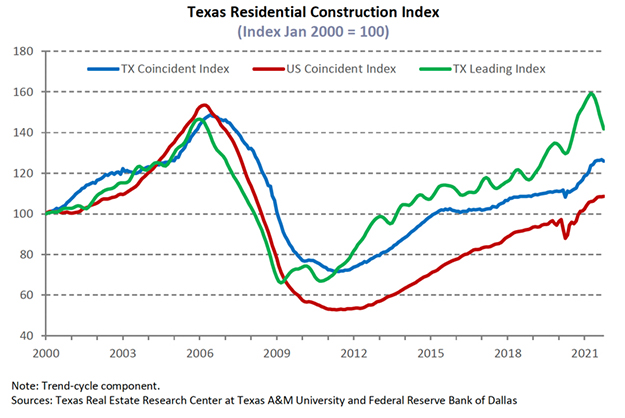
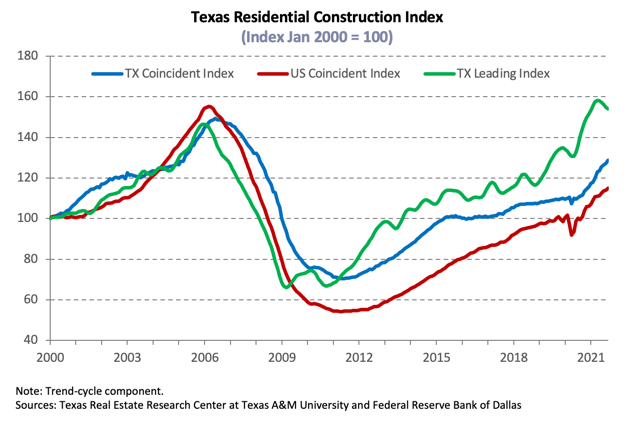
The Texas Residential Construction Cycle (Coincident) Index, which measures current construction activity, increased nationally and within Texas due to strong demand for housing. The Texas Residential Construction Leading Index (RCLI) reached a peak in April with an increase in weighted building permits and residential construction value starts combined with declines in the ten-year real Treasury bill. The trend, however, reverted downward at both the state and major-metropolitan levels, indicating slower activity in the beginning of 2022. Supply-chain issues weighed on construction activity and remain a significant challenge in coming months.
In response to supply shortages and despite the challenges of COVID-19, developers accelerated activity at the earliest stage of the construction cycle. According to Zonda, the number of new vacant developed lots (VDLs) in the Texas Urban Triangle, which encompasses the state’s major Metropolitan Statistical Areas (MSAs), elevated 8.2 percent annually in 2021 to 126,000. Austin led the state with an 18.2 percent increase over the previous year, and Dallas-Fort Worth (DFW) followed with a rise of 13.1 percent. San Antonio VDLs rose 7.9 percent, while the Houston metric increased incrementally by 1.9 percent. While these efforts should ease pressure on the overall housing market, it will take a much larger response to raise supply to meet the demand.
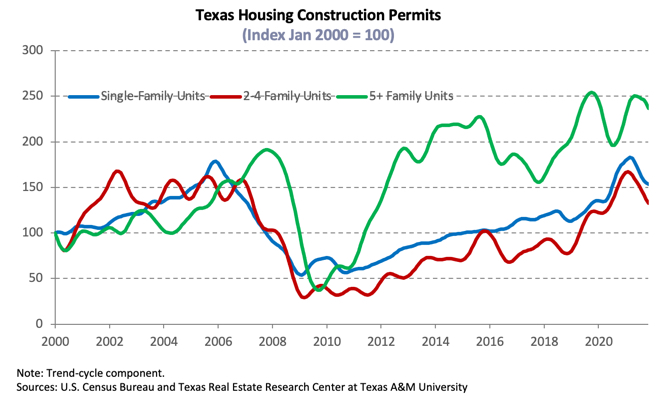
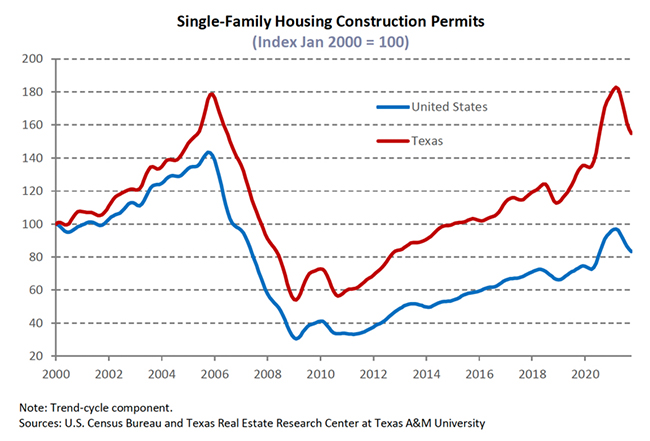
Strong lot development was matched by a record 173,000 single-family housing construction permits issued in Texas. The statewide metric rose 11.2 percent over the previous year despite soaring lumber and input costs resulting from global supply constraints. Houston and Dallas topped the charts for the year, issuing over 52,100 and 48,400 permits, respectively. Austin and San Antonio both saw strong gains, issuing 24,356 and 13,862 permits, respectively.
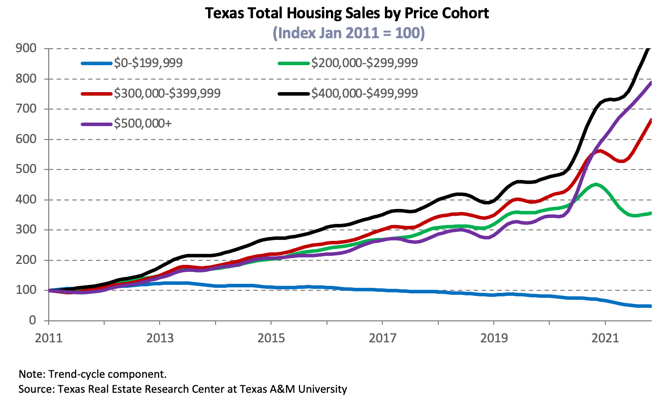
Total Texas housing starts began the year with strong growth; however, the pandemic disrupted typical seasonal trends with permit issuance. Lumber prices were elevated in early 2021 and skyrocketed in May. Though prices dropped off somewhat by August, they ended the year 18.6 percent higher than 2020. Regardless, per Zonda, single-family starts in the urban triangle rose 21.2 percent over 2020 due to huge increases for homes slated to sell for $300,000 or more. Starts of homes priced at more than $500,000 surged 94.7 percent over the year. Starts at the low end of the price spectrum ($200,000 and less) decreased 71.9 percent. Limited supply in the lower price cohorts shifted the contribution of sales more toward the higher-priced categories. Construction focused more on high-end homes due to elevated material costs leaving less room for profit in lower-priced categories. All major metros saw double-digit increases in housing starts. San Antonio and DFW sustained strong growth with 29.6 and 28.3 percent increases, respectively, while Austin saw a 22.9 percent surge. Meanwhile, Houston posted a 12.6 percent increase, much lower than the other major metros.
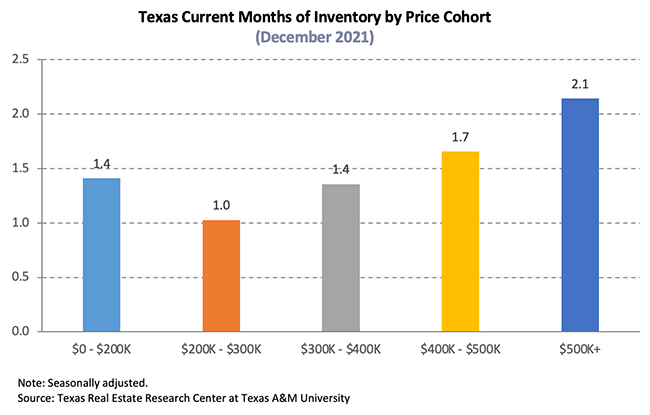
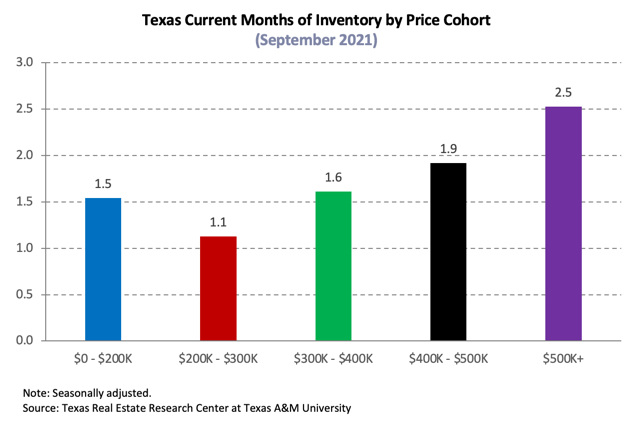
Steady sales and depressed new Multiple Listing Service (MLS) listings pulled Texas’ total months of inventory (MOI) to an average of 1.6 across all price cohorts. A total MOI of around six months is considered a balanced housing market. Houses in the $200,000-$299,999 price cohort fell to one MOI throughout the year, dipping at its lowest to 0.8 MOI. Even homes priced above $500,000 dropped to 2.4 months compared with 2.9 months the previous year as constrained supply at the lower end of the price spectrum pushed buyers toward higher-priced homes.
Demand
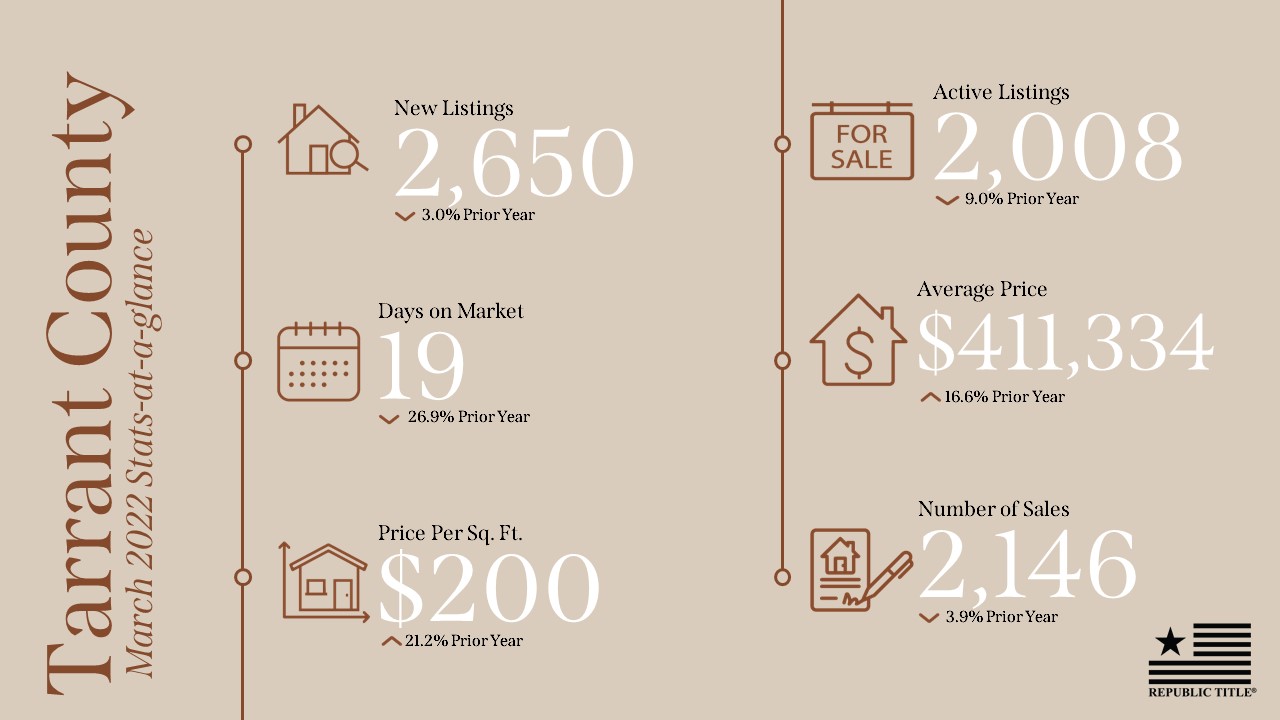
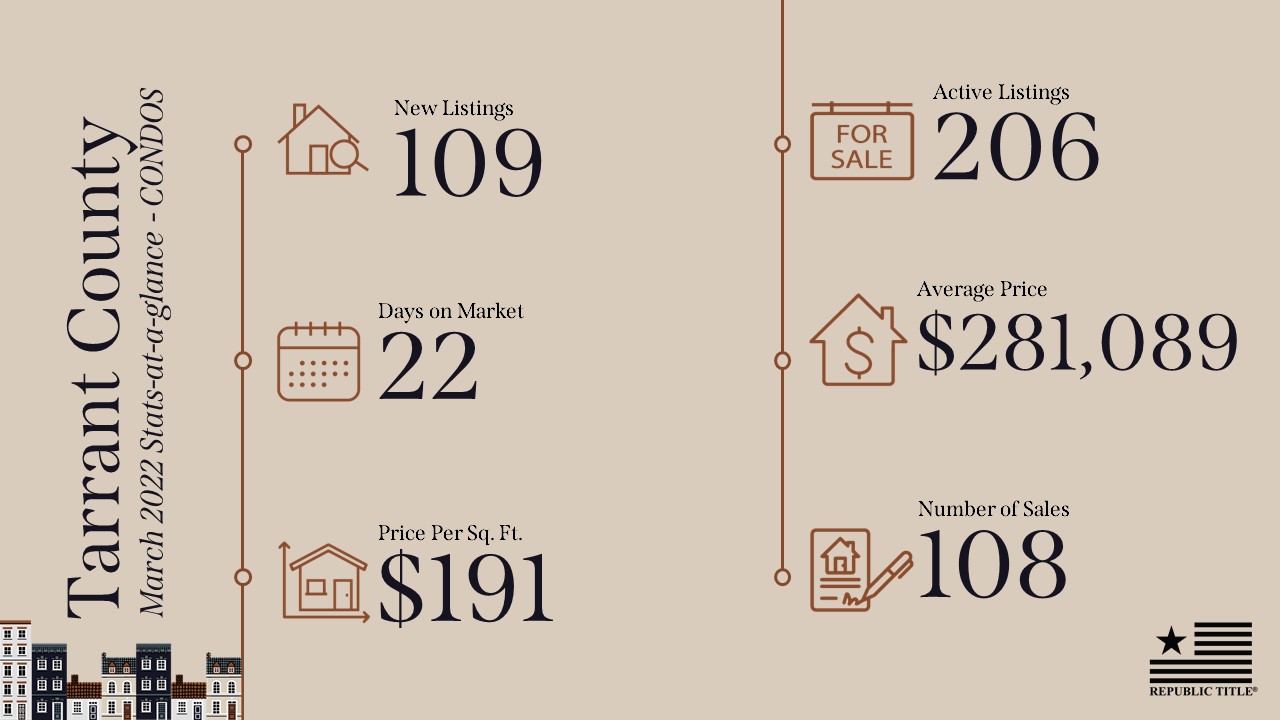
Texas reported 417,050 total housing sales through MLS in 2021, increasing over 6 percent annually. With the robust demand and constrained inventory in the lower price cohorts, more consumers competed for houses priced between $300,000 and $399,000. Sales in this price cohort reached an all-time high, jumping 40.02 percent annually, with the bulk of the increase a result of the second quarter. On the other hand, sales for luxury homes (priced more than $500,000) also broke the record, ascending at double-digits in percentage terms amid the expanded supply.
Houston led the urban triangle in home-sale growth at 11.8 percent. San Antonio and Austin followed with 4.6 percent and 2.5 percent sales growth, respectively. Contrary to the other metros, Dallas and Fort Worth sales balanced after reaching historical highs in 2021 as low inventories limited market activity.
The market share for metros in the Texas Urban Triangle shifted year to year. This percentage split shows how sales in one metro are growing or shrinking compared with other major state metros. In 2021, Houston had the biggest market change with a 2 percent YOY increase, up to 27 percent. The market loss was distributed to Dallas and Fort Worth, which decreased to 18 and 9 percent, respectively. Meanwhile, Austin and San Antonio remained stable at 10 percent market share.
According to the U.S. Census Bureau’s Current Population Survey/Housing Vacancy Survey, homeownership in Texas normalized to 64.2 percent over the year compared with the national rate of 65.5 percent. Homeownership rates decreased annually at the metropolitan level, but were still higher than 2019 values. The rates in Austin and DFW rolled back 3 percent, falling to 62.4 percent and 61.8 percent, respectively. Houston’s metric ticked down to 64.1 percent, while 62.7 percent of San Antonio’s total housing units were owner-occupied. The decreased rate may be because of rising cost of homes across the board coupled with scarce housing options in the lower price categories typically associated with starter homes, leading potential buyers to rent instead.
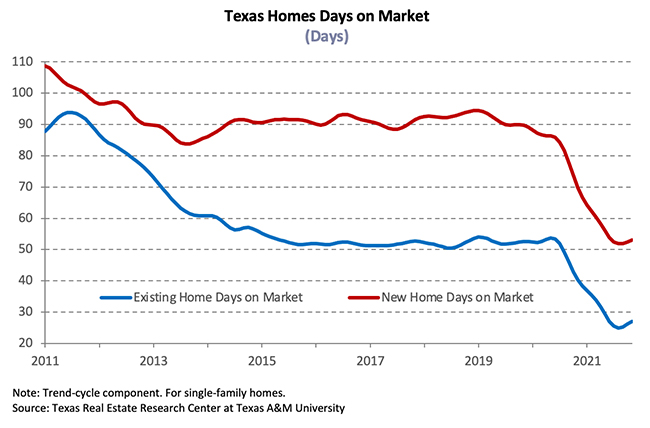
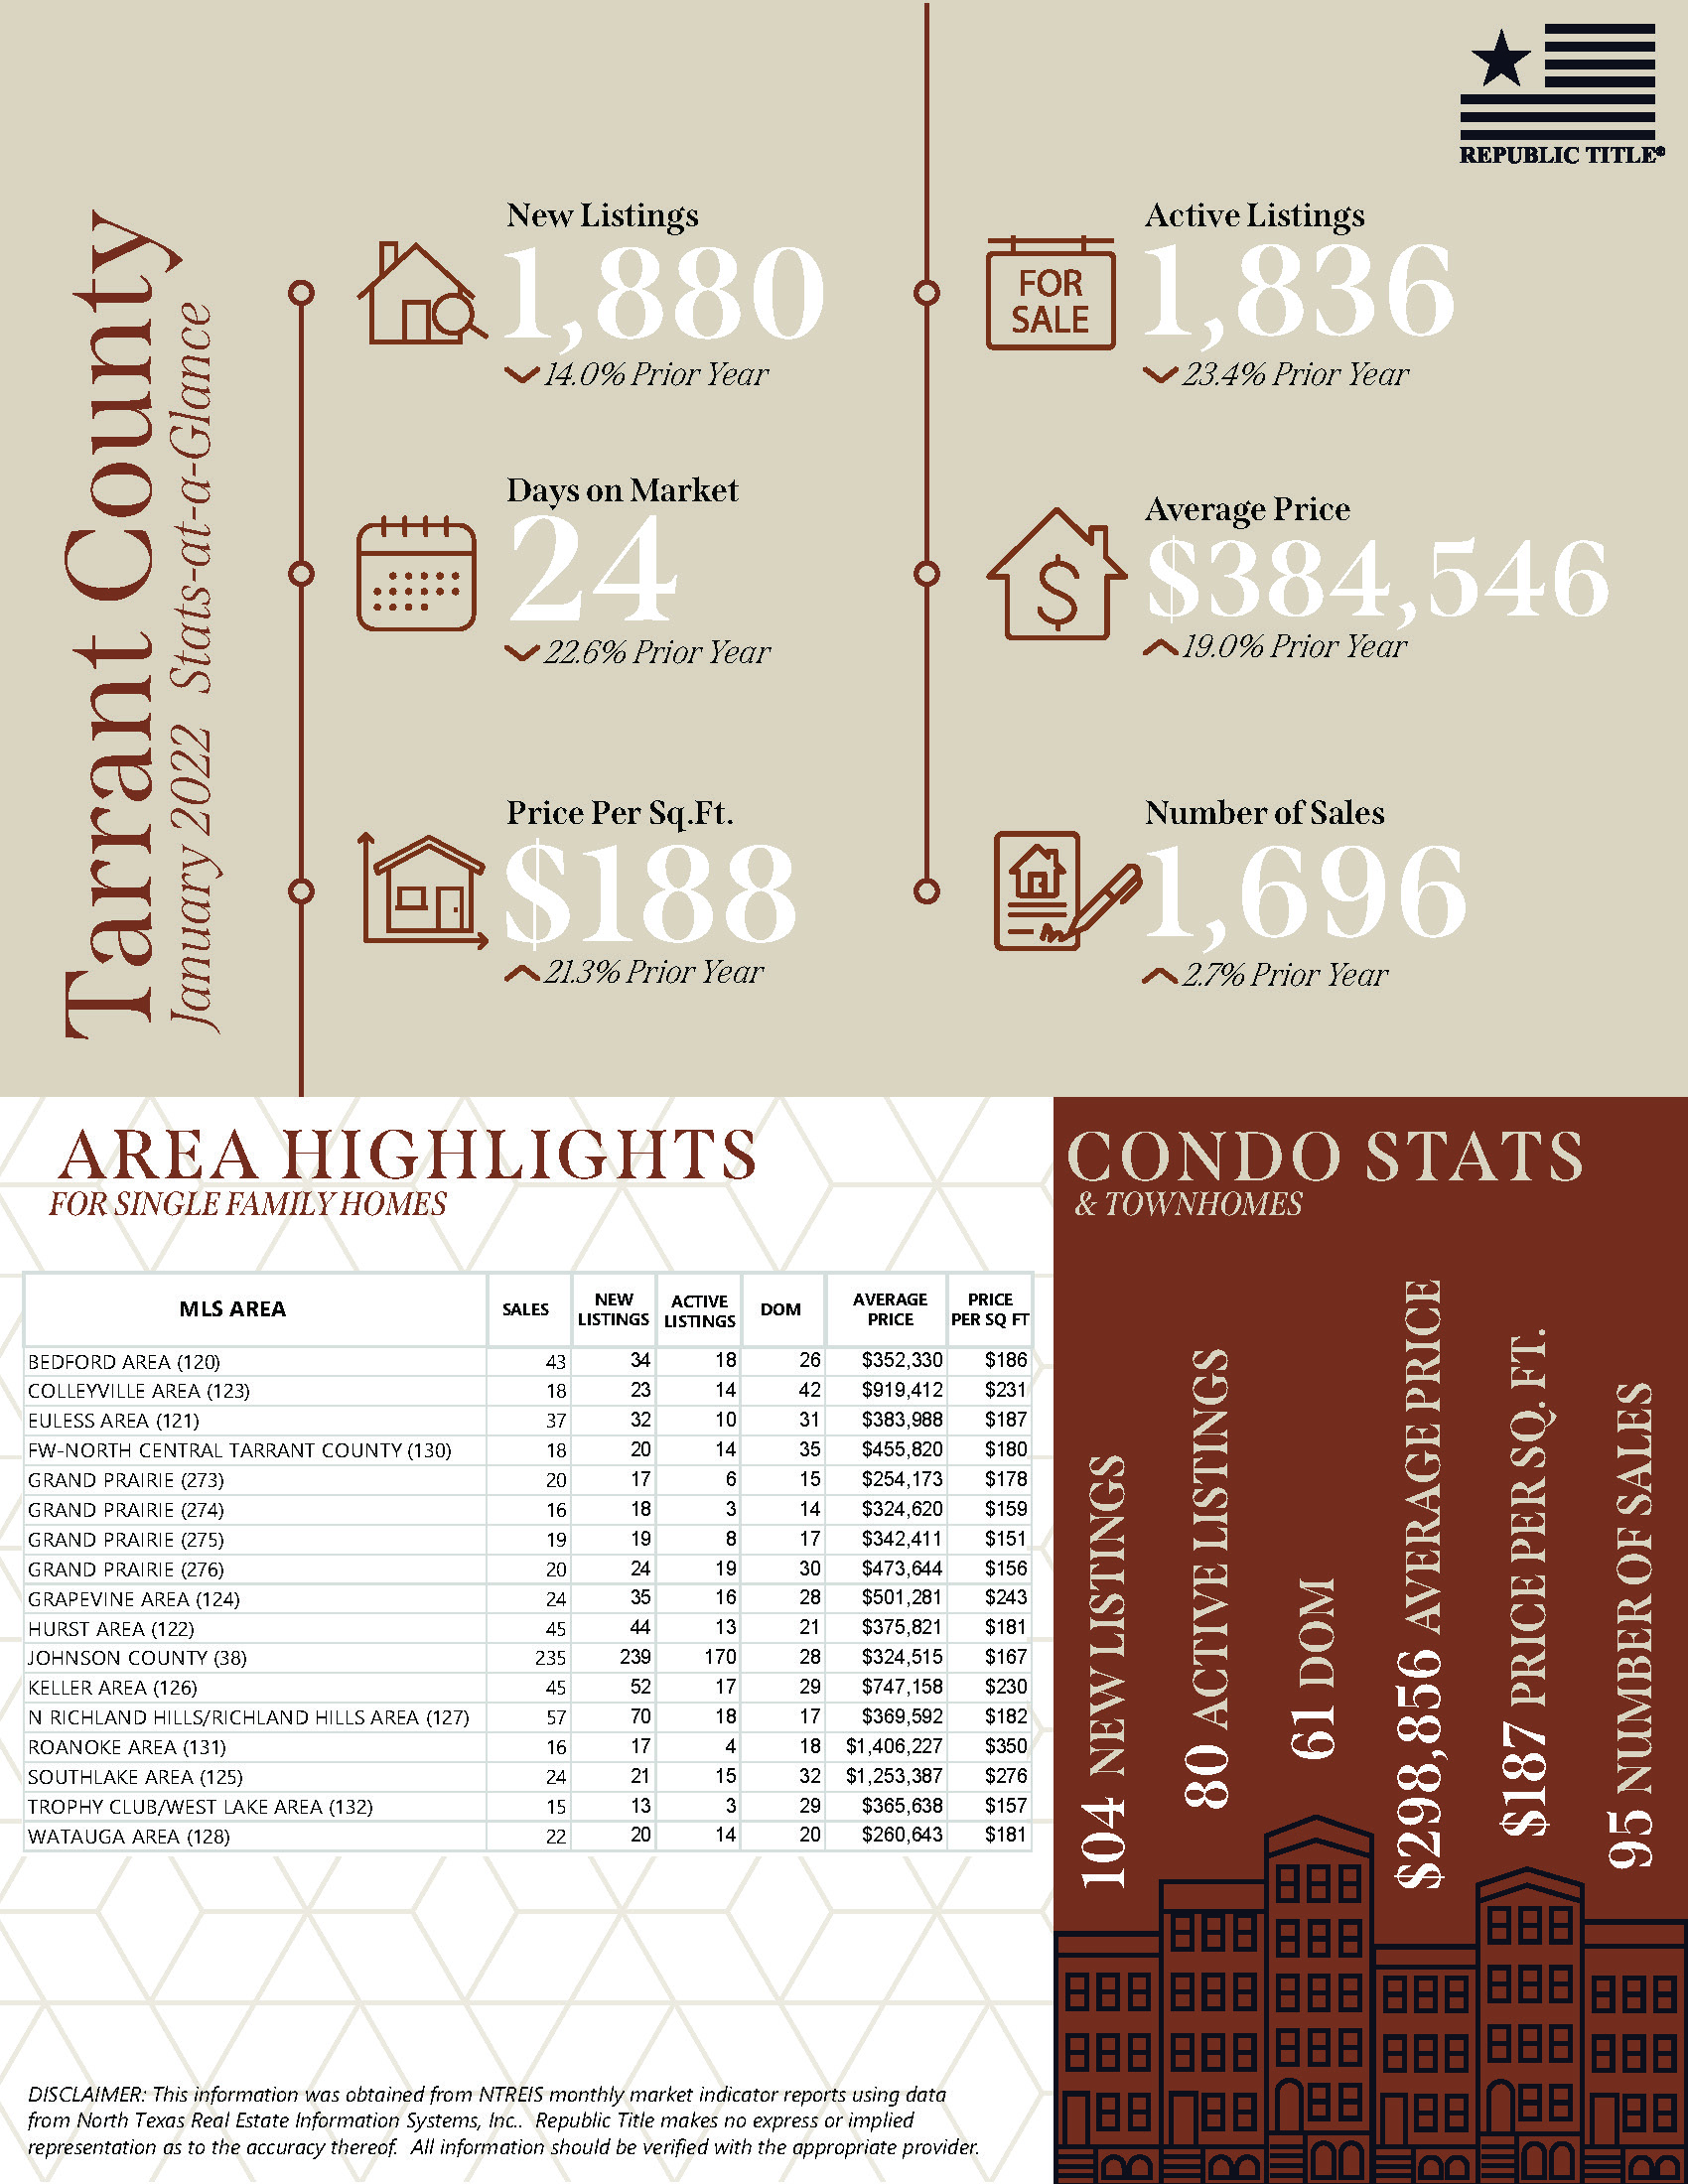
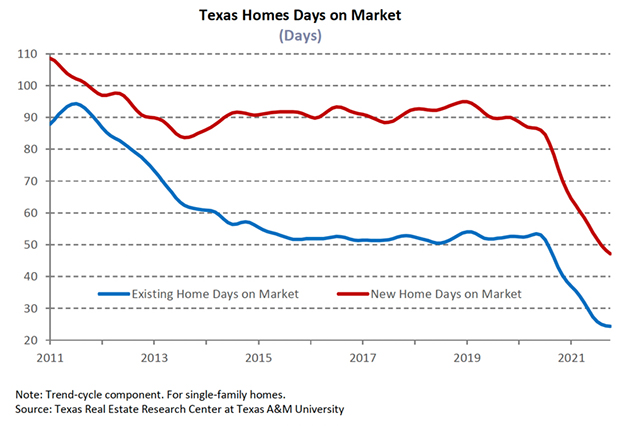
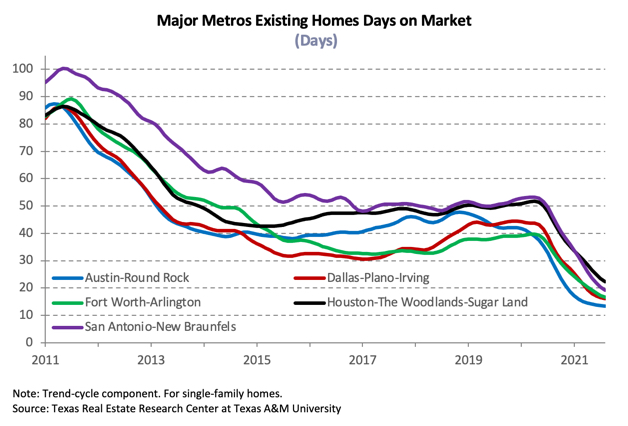
Amid record-breaking sales activity, Texas’ average days on market (DOM) dropped from 47 days in 2020 to 34 days in 2021. The sellers’ market was hottest in July when the DOM plummeted to 26 days. Corroborating robust housing demand, Dallas and Fort Worth’s DOM sank to 29 and 28 days, respectively. Austin remained the most demanded metro, with homes averaging just 25 days on the market. Demand grew stronger in San Antonio with a 12-day decrease in the DOM, converging with the state average. The Houston DOM remained above the state averagebut still fell to 37 days.
The Federal Reserve is expected to accelerate the tapering of assets purchases and increase the Federal Funds rate at least two to four times in 2022, reflecting rising interest rates. The ten-year U.S. Treasury bond yield ticked up 55 basis points in 2021, averaging 1.5 percent. Meanwhile, the Federal Home Loan Mortgage Corporation’s 30-year fixed-rate fell to 3 percent. Notably, both bond and mortgage rates started rebounding after August, counterbalancing the inflation surge. Mortgage rates for conventional mortgages plummeted below 3 percent within Texas, highlighting a year of unprecedented low levels. Mortgage rates plunged to 3 percent for non-government-sponsored-enterprise (GSE) loans while the median mortgage rate for GSE borrowers diminished to 3.2 percent (GSEs include Fannie Mae and Freddie Mac). Mortgage application counts declined drastically in 2021. During that period, the number of refinance applications shrank 27.1 percent SAAR, while purchase applications shrank by 12.6 percent. Amid the reduced mortgage rate and bolstered home prices, average loan sizes decreased 2.6 percent for refinance applications, and the sizes increased 15.3 percent for purchase applications. (For more information, see Finding a Representative Interest Rate for the Typical Texas Mortgagee.)
Tightened lending standards continued with the strong housing demand. The debt-to-income ratio (DTI) constituting the “typical” Texas non-GSE mortgage decreased to 35.9 in 2021. Relief actions taken by the federal government and lenders helped some households pay off debt and save money. This helped push borrowers’ median credit score to a multidecade high of 749 The median loan-to-value ratio (LTV) dipped to 85.3 percent for non-GSE borrowers, leaving borrowers with a maximized loan value that’s 2.2 percent less with the same home equity value, while the GSE metric flattened at 85.4. The DTI for GSE borrowers, on the other hand, ticked up, inching up from 35.6 to 36.
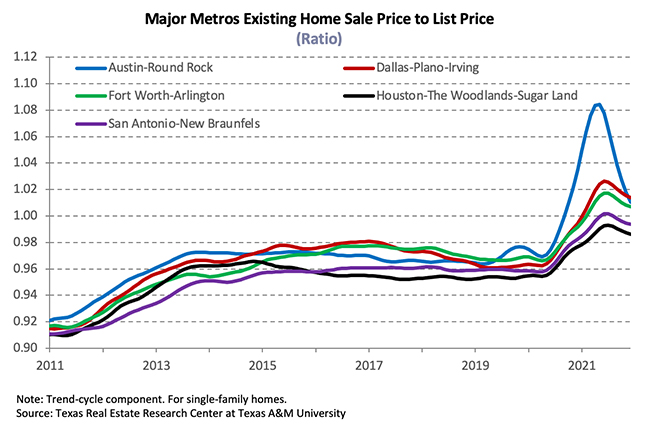
Prices
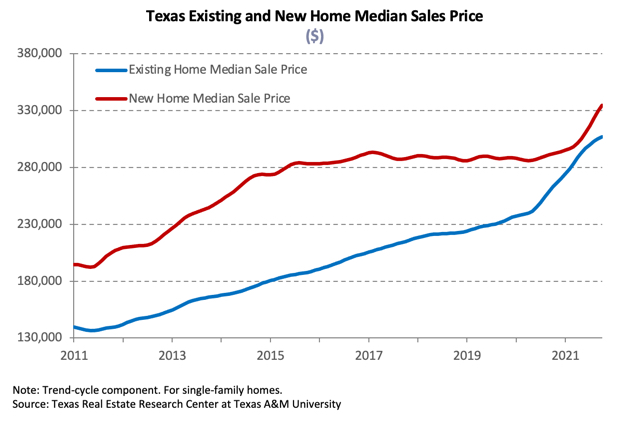
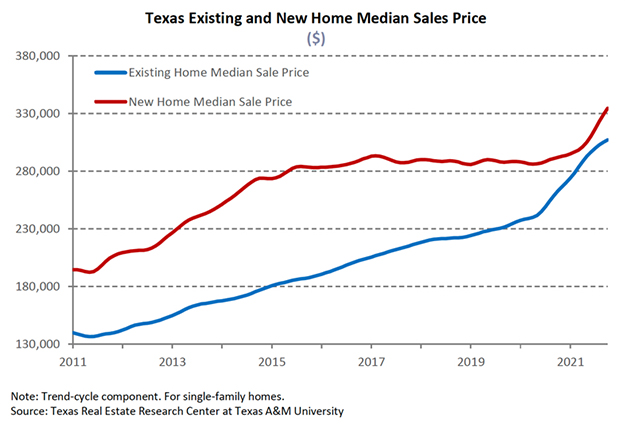
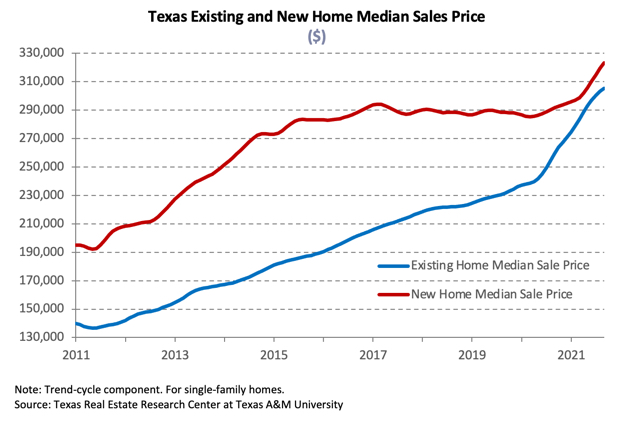
Texas’ median home price rose for ten consecutive months, reaching a record-breaking $300,000 and appreciating at an astonishing rate of 15.6 percent annually. All five major metros all hit record-high median prices in the last months. The ongoing shift in the composition of sales toward higher-priced homes due to constrained inventories at the lower end of the market boosted the average and median home price. The share of luxury homes sold in Austin surged, pushing the median price ($450,000) by a notable growth of 30.8 percent YOY. The Dallas metric ($365,000) increased 17.4 percent, while annual price growth in Fort Worth ($309,000) shot up to 18.8 percent. Houston’s ($300,000) and San Antonio’s ($284,900) metrics increased to 15.4 and 14.4 percent, respectively.
The Texas Repeat Sales Home Price Index accounts for compositional price effects and provides a better measure of changes in single-family home values. Compared with December 2020’s 8.3 percent YOY increase. Texas’ index corroborated significant home-price appreciation, accelerating 19.5 percent YOY in 2021. The rate of growth surpassed the surge in the median home price. The repeat sales index also accelerated in all of the major metros. Austin stood above the rest, posting a 34 percent increase YOY. DFW and San Antonio saw their index rise 18.4 and 15.4 percent, respectively. Meanwhile, Houston had the lowest gains but a still strong 12.4 percent. Increasing home prices pressured housing affordability, decreasing Texas affordability advantage compared with past years.
Single-Family Forecast
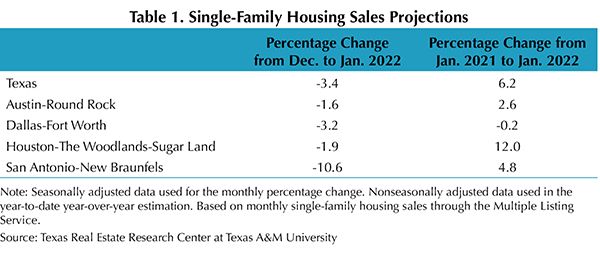
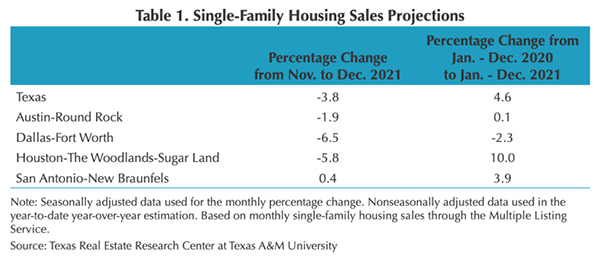
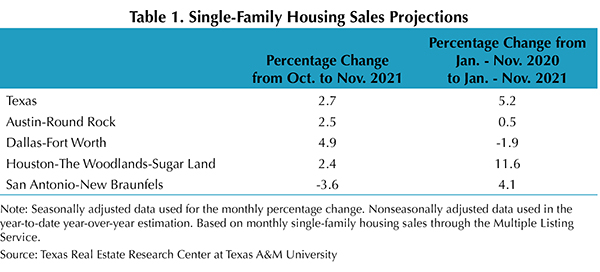
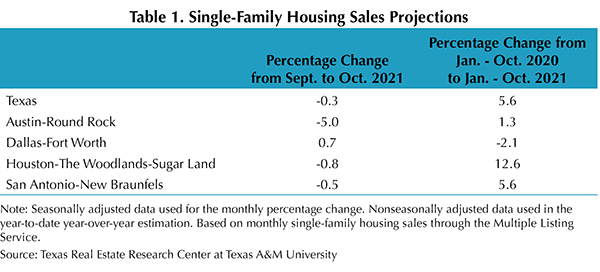
Texas sales in January 2022 are expected to increase 6.2 percent over December 2021 (Table 1). On the metropolitan level, transactions are expected to drop across the board, but San Antonio is expected to decline the most. Except for Dallas, year-end home sales were greater in 2021 than in 2020.
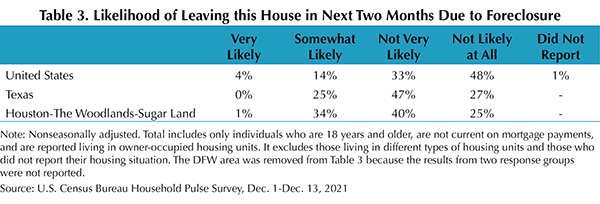
Household Pulse Survey
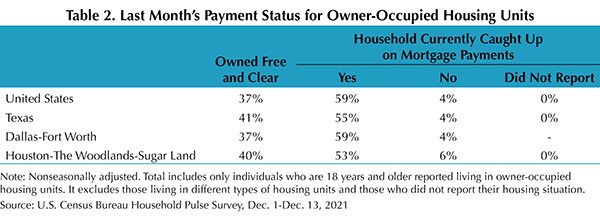
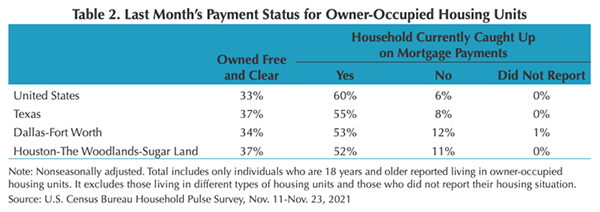
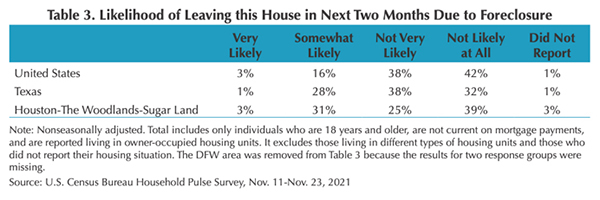
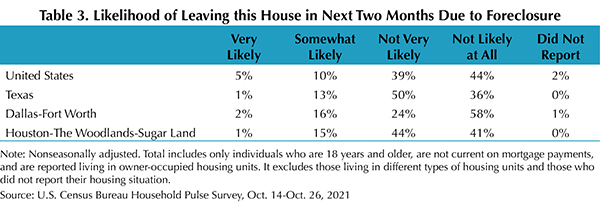
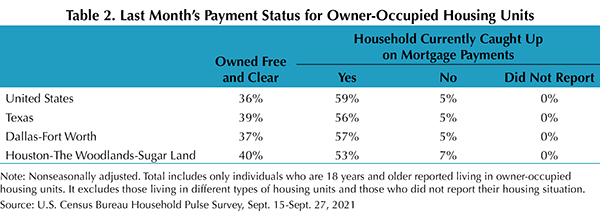
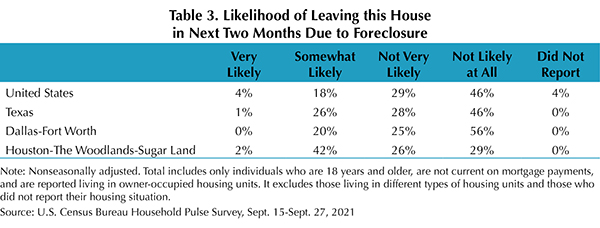
According to the U.S. Census Bureau’s Household Pulse Survey, the share of homeowners behind on mortgage payments shrank both at the national and state levels compared with year-ago numbers (Table 2). Remarkably, the portion of Texas homeowners free and clear of a mortgage rose 2.9 percent, corroborating the effect of reduced mortgage rates and a recovered economy. Likewise, homeowners claiming the risk of foreclosure as “not likely” increased significantly from 8.5 percent to 27.5 percent. The proportion of delinquent individuals at risk of foreclosure in the state fell to only 0.3 percent. The Federal Housing Finance Agency’s foreclosure and REO eviction moratoria for properties owned by Fannie Mae and Freddie Mac (the Enterprises) expired Sept. 30, 2021. Continuing the stability and current trend in reducing delinquent homeowners’ mortgage payments is essential to Texas’ economic recovery.