In October 2024, the real estate market in North Texas remained dynamic, with notable changes across Collin, Dallas, Denton, Tarrant, and Rockwall counties.
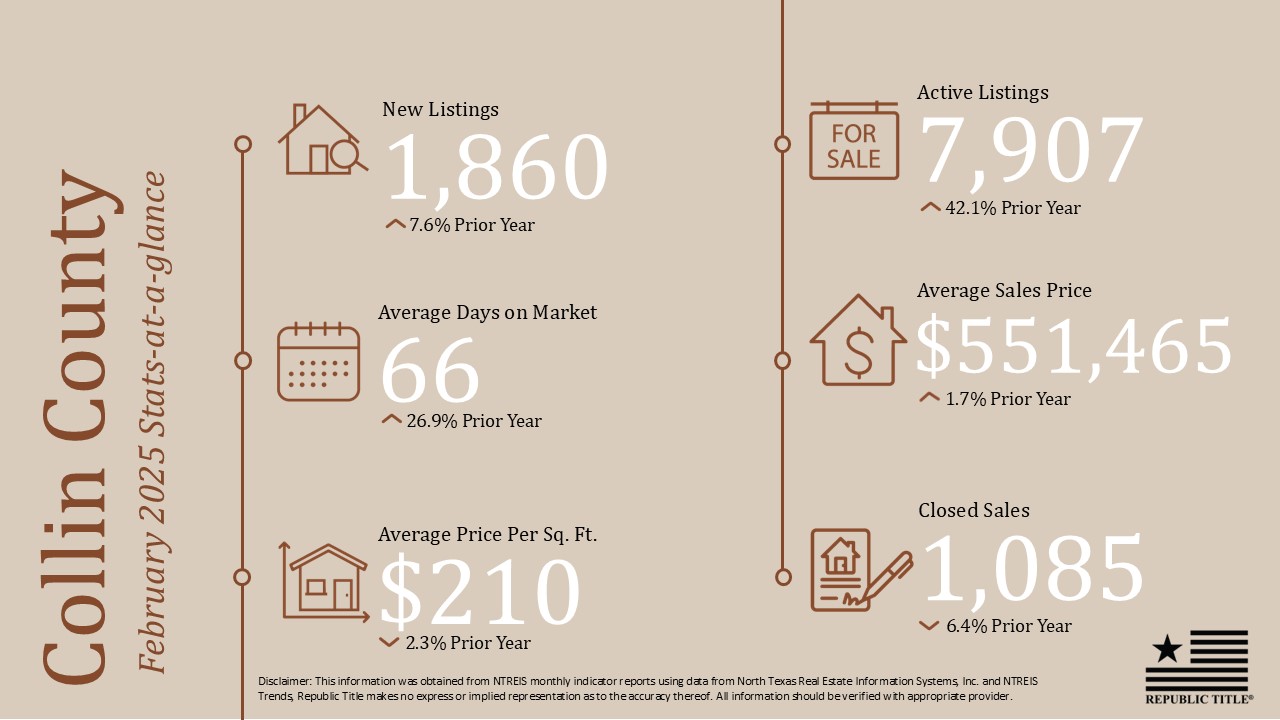
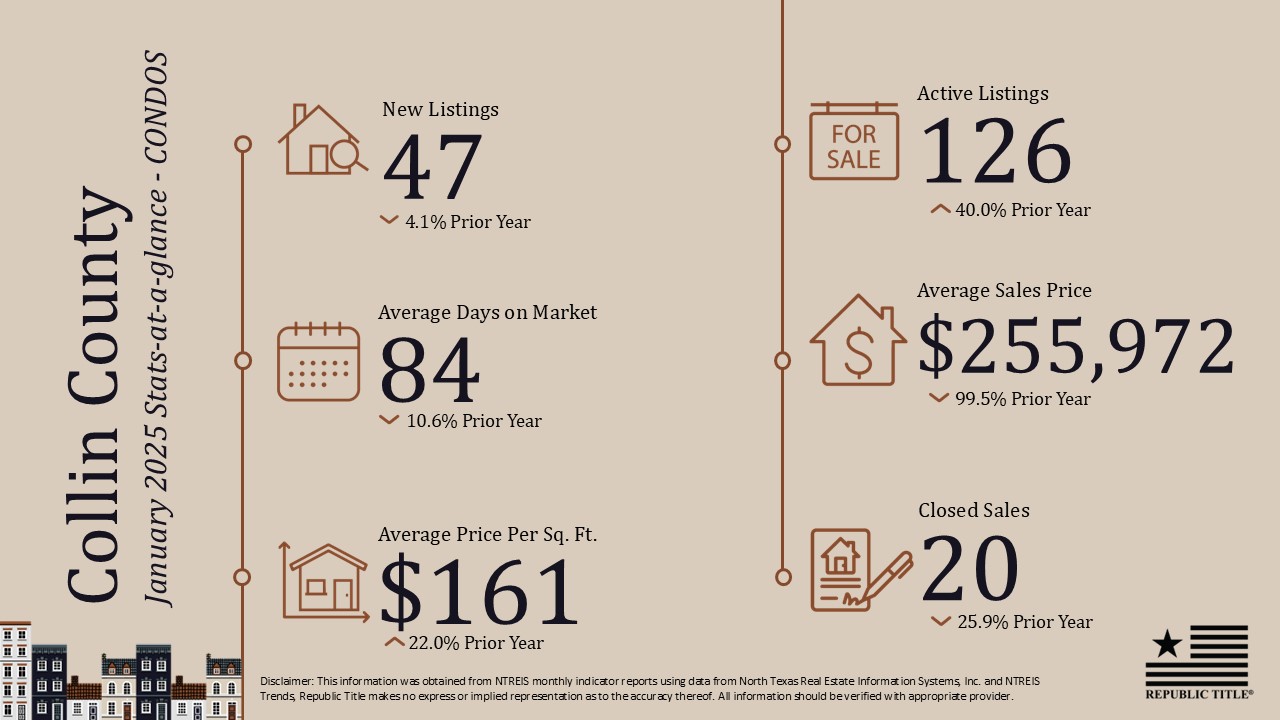
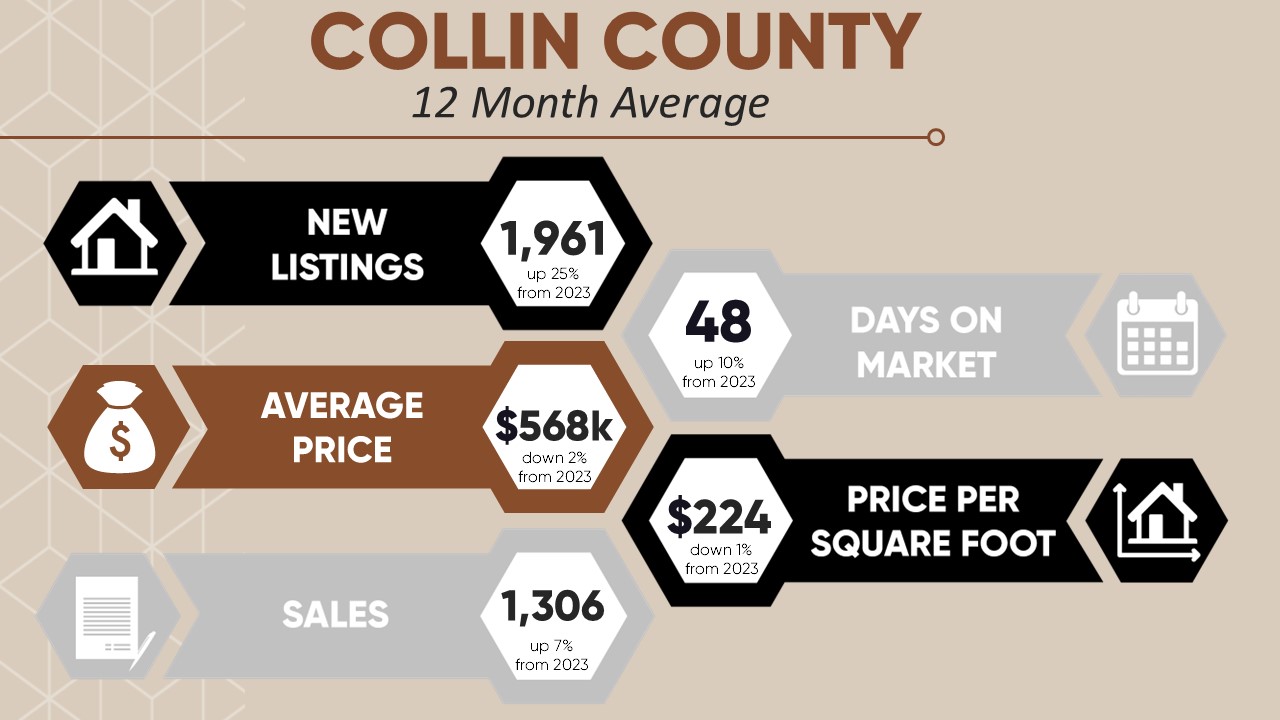
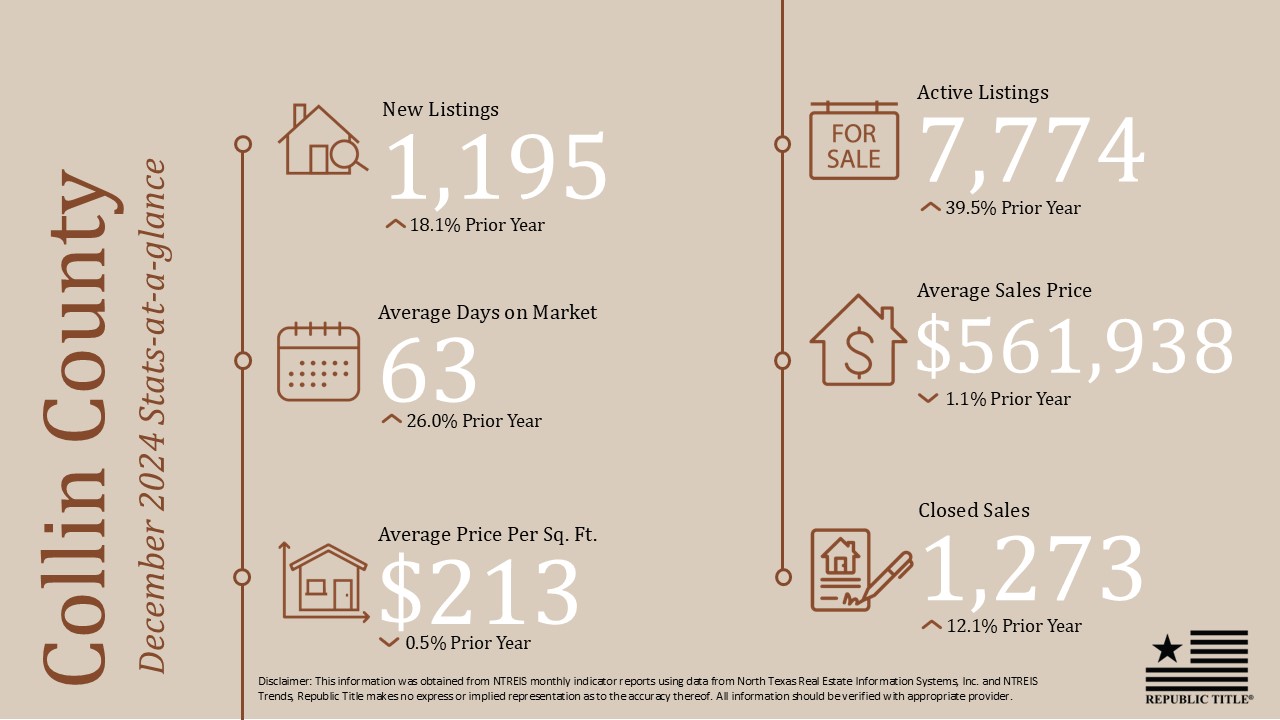
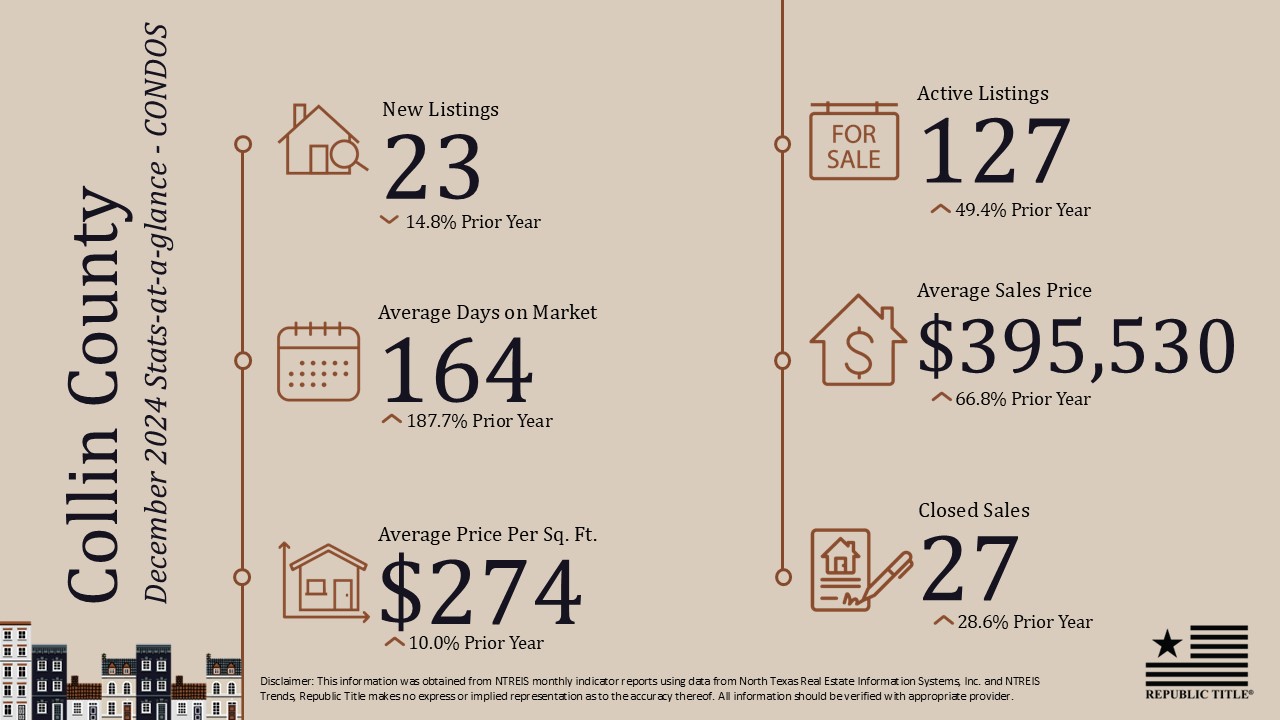
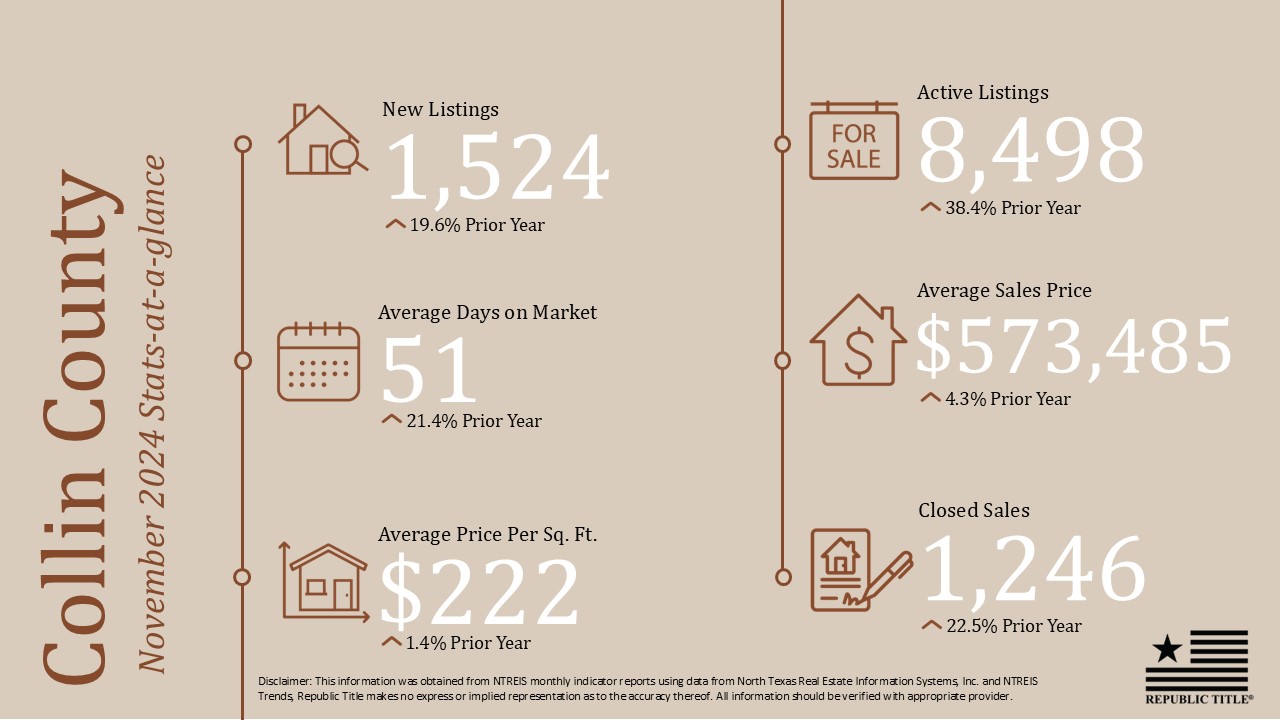
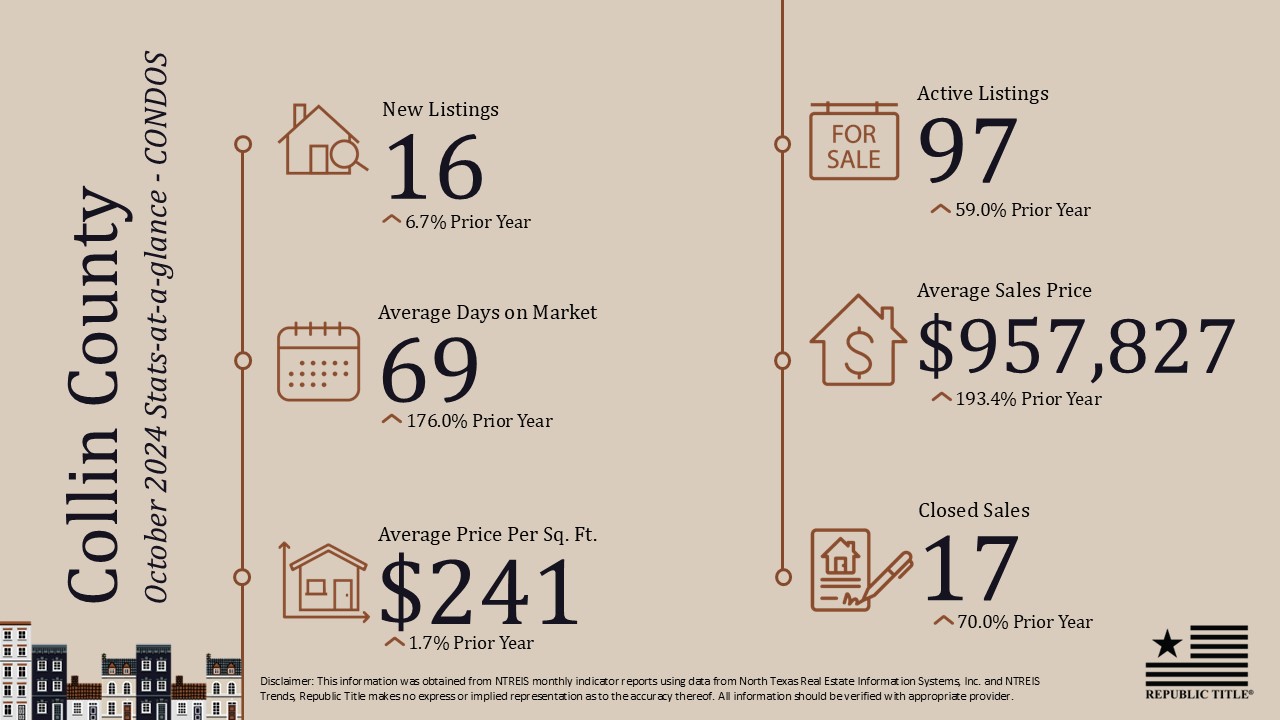
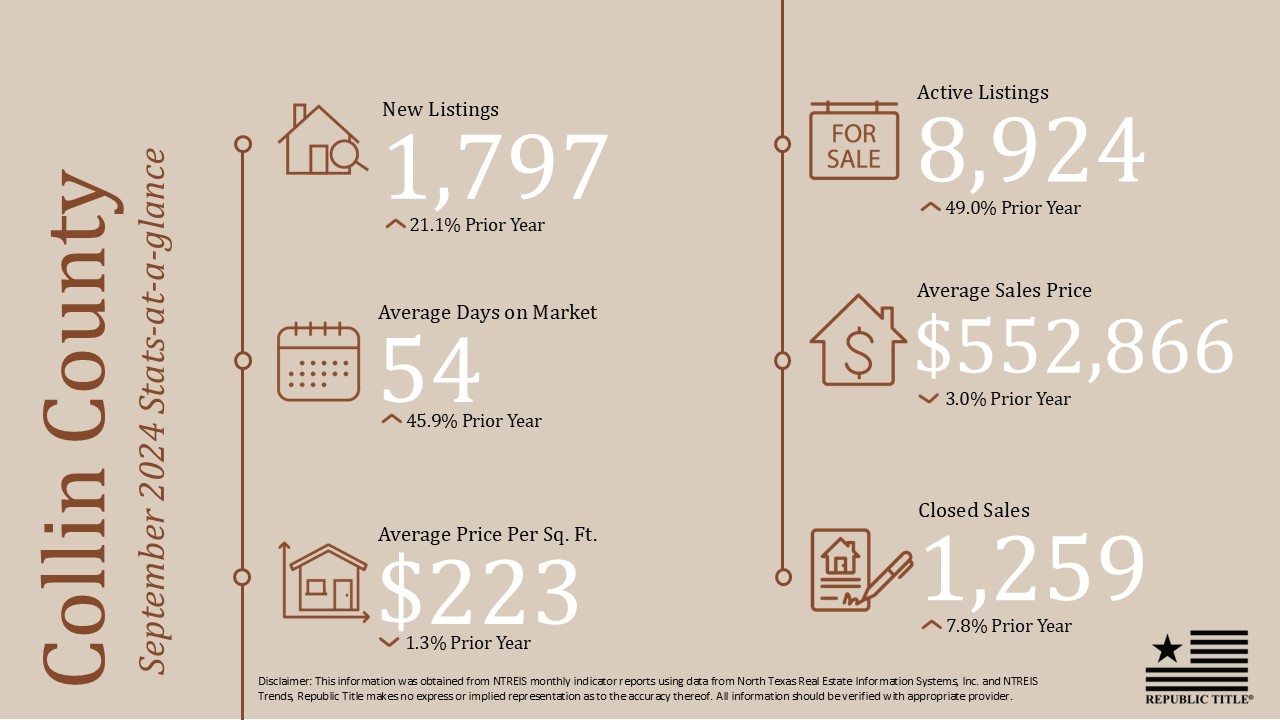
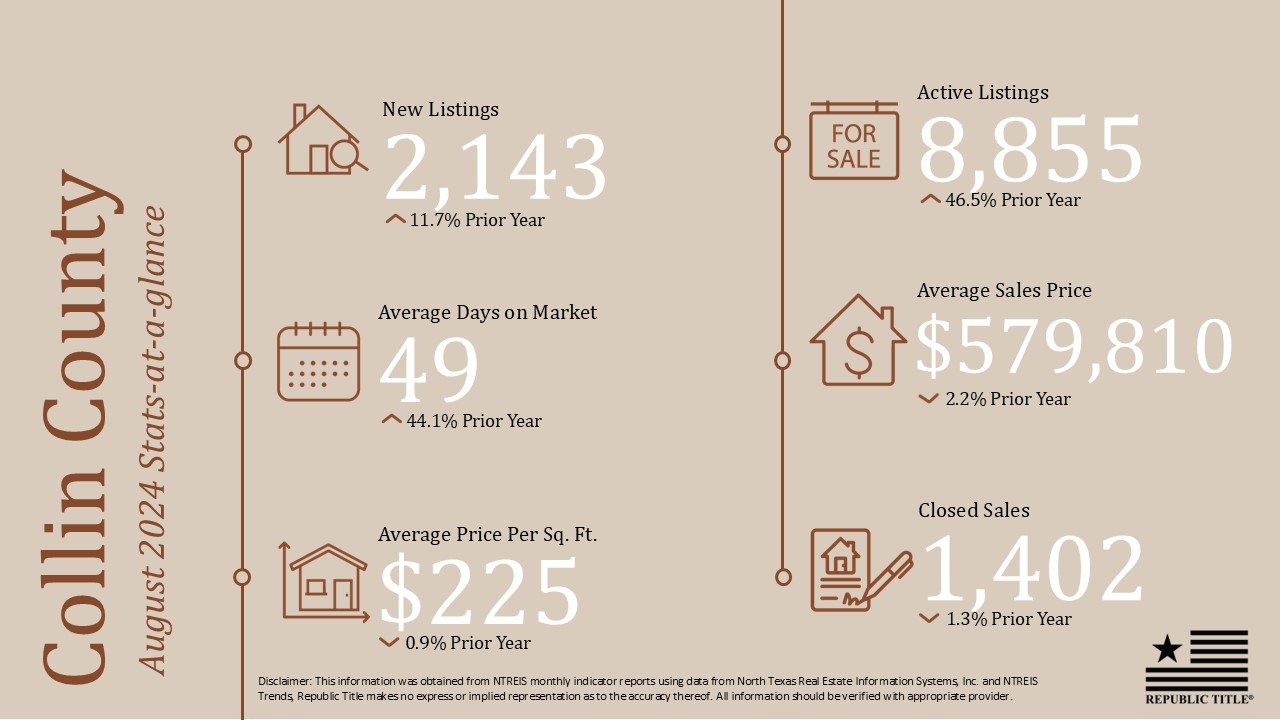
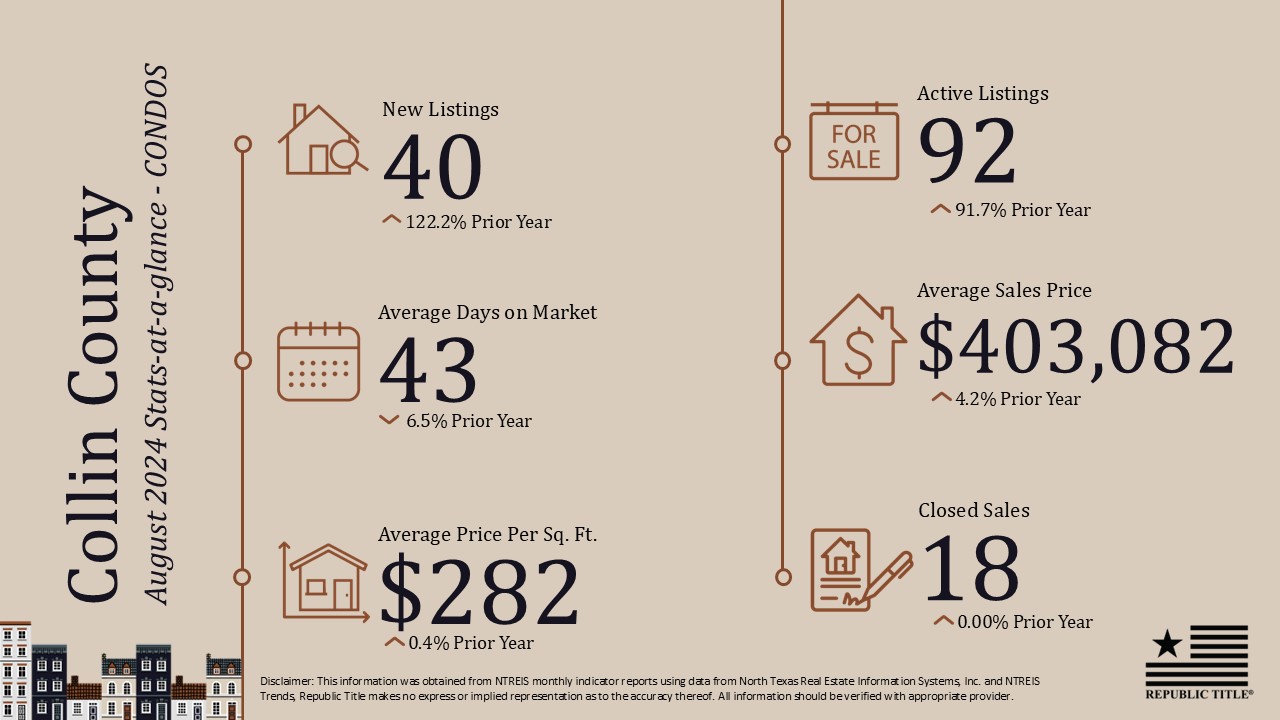
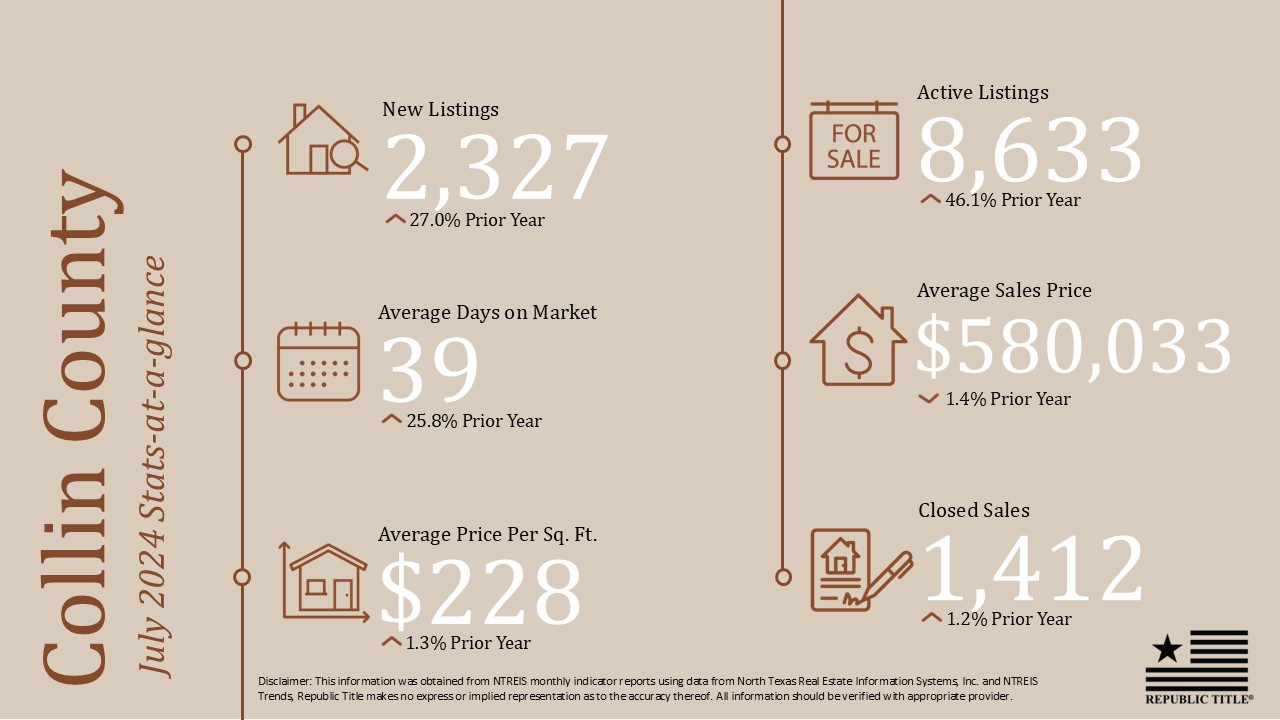
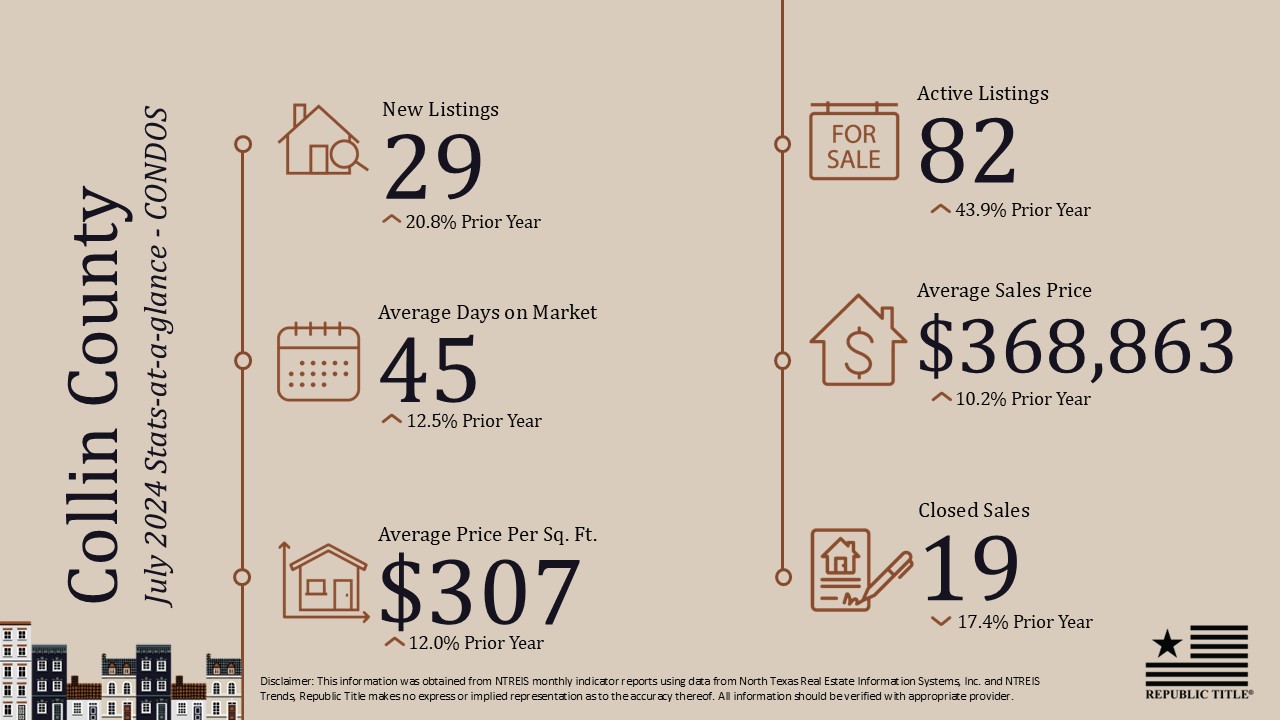
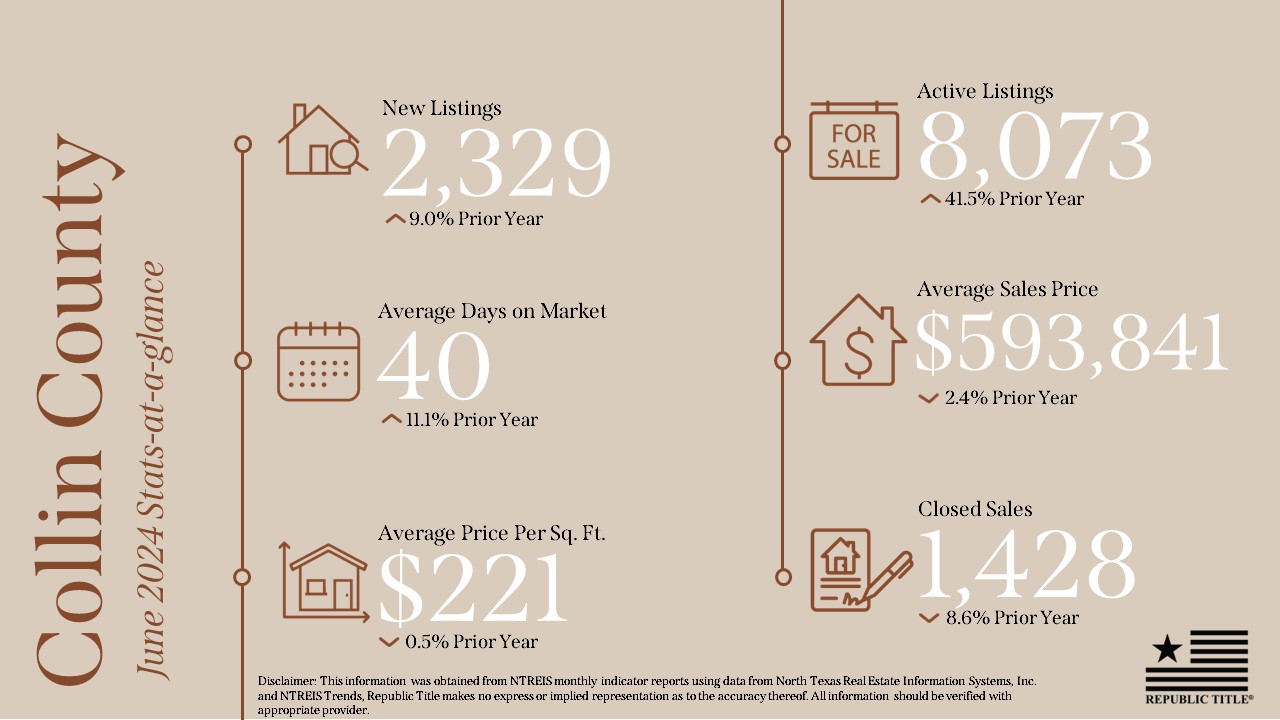
In Collin County, the number of active listings increased by 28.7% from last year, but the average sales price remained steady at $563,333, showing minimal change from the prior year. The area saw a 22.6% increase in new listings, totaling 1,972, while closed sales were up by 13%, reaching 1,300. On average, homes spent 55 days on the market, which was a 37.5% increase compared to the previous year.
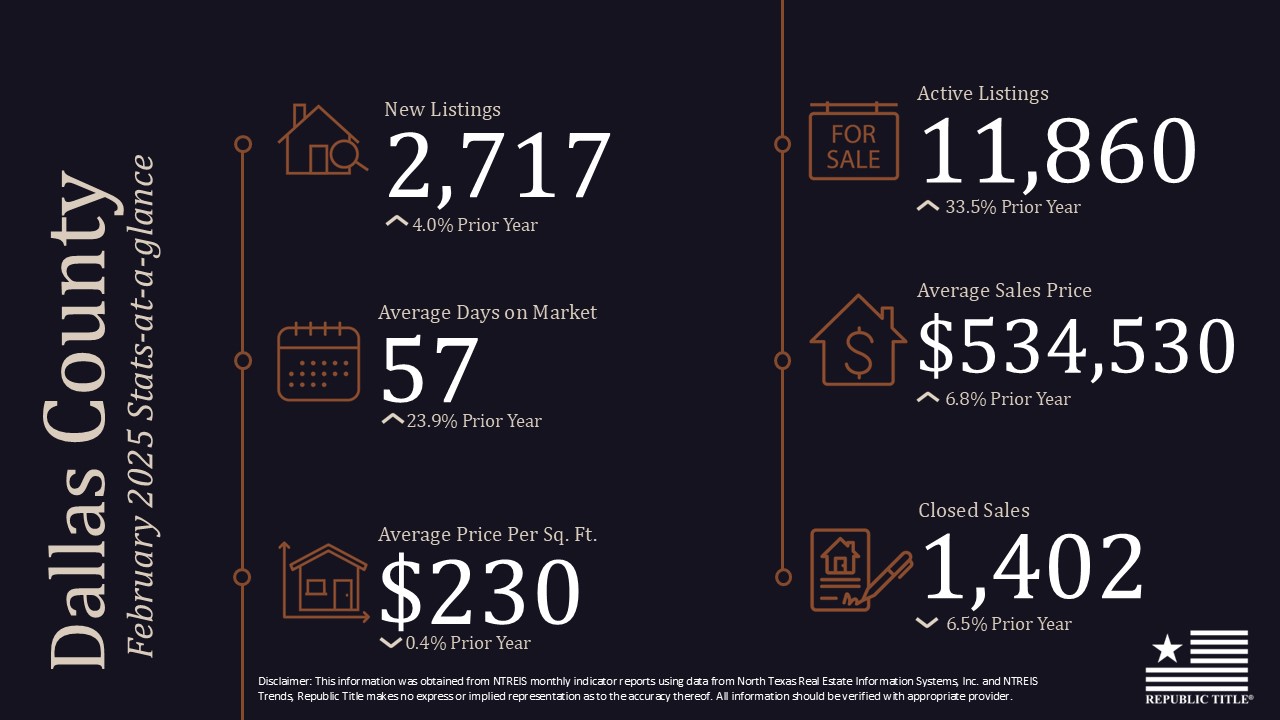
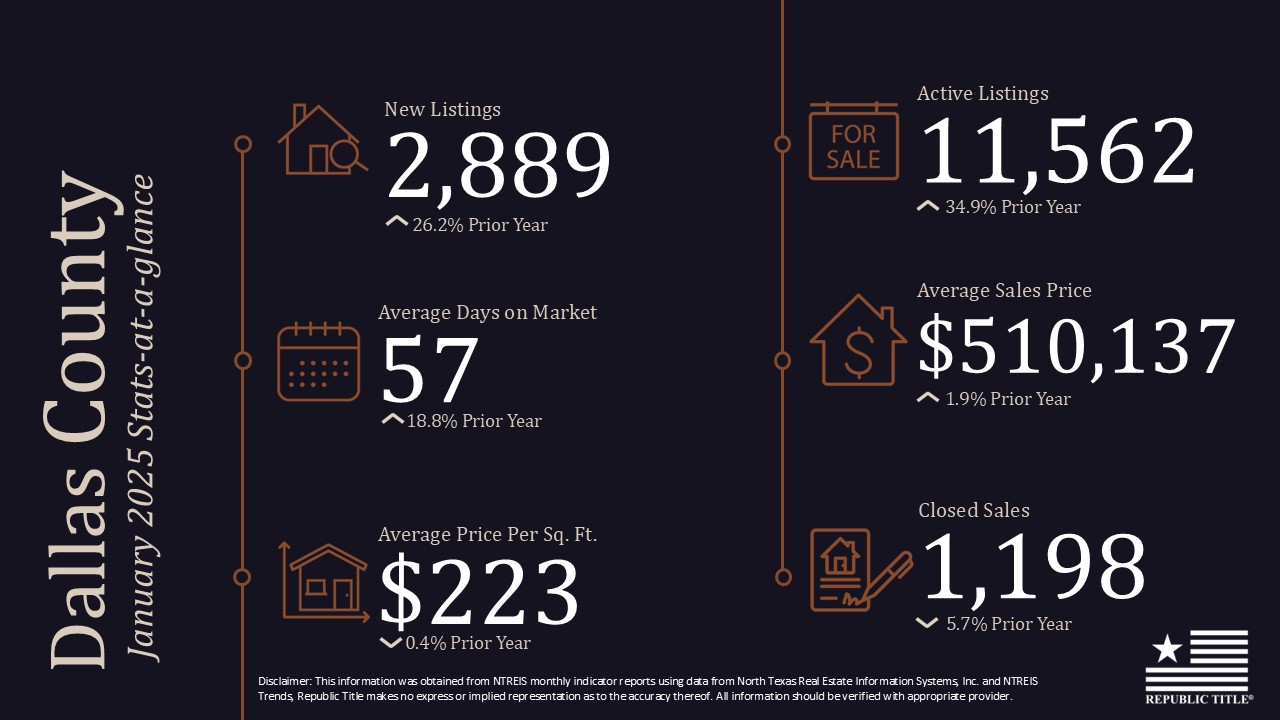
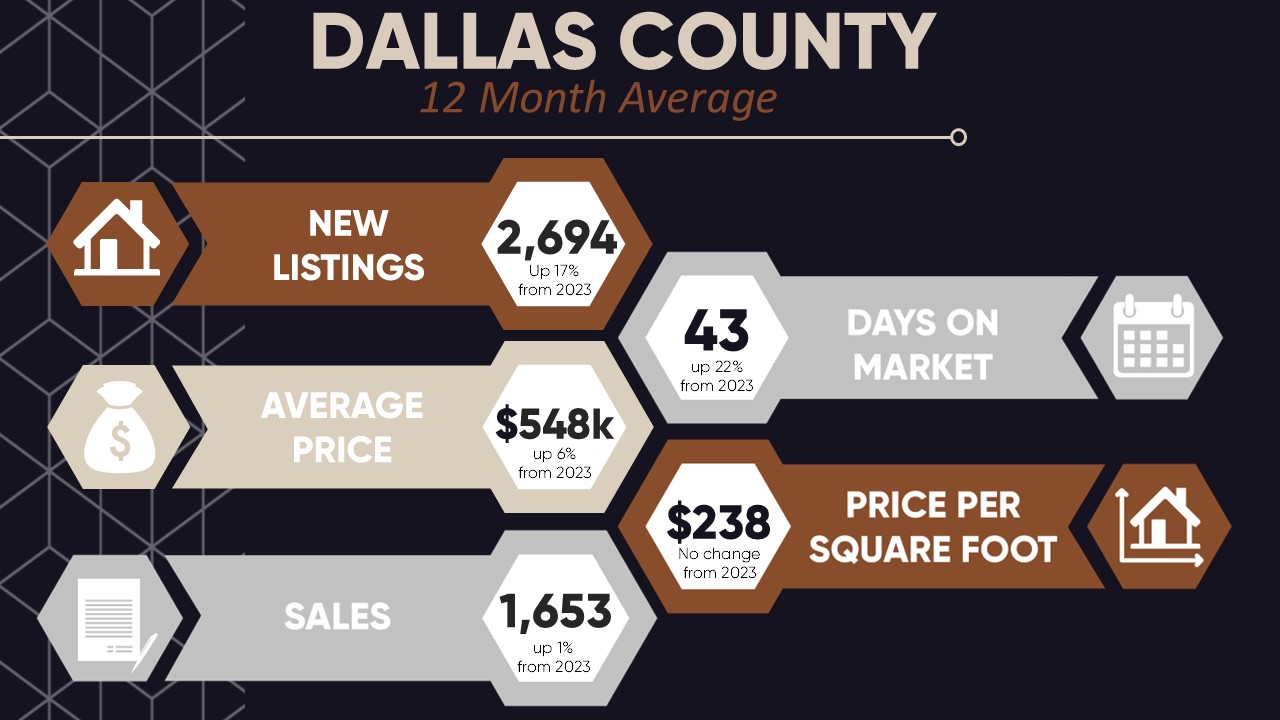
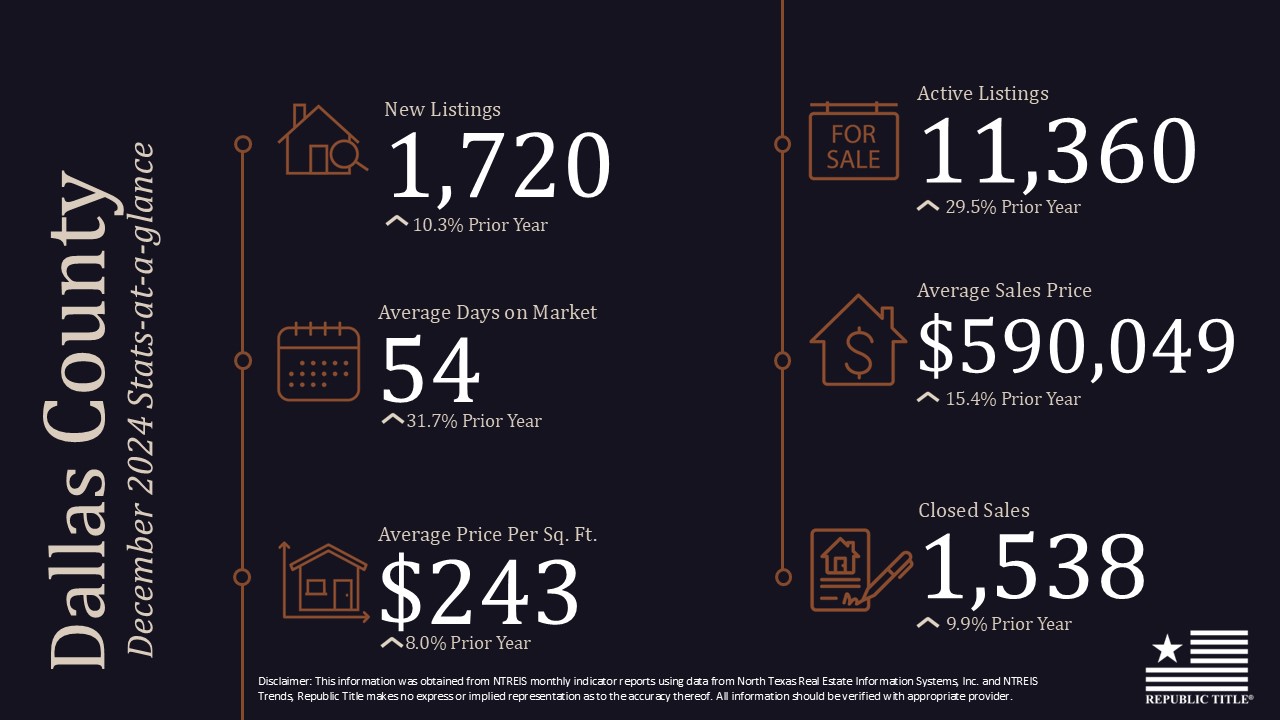
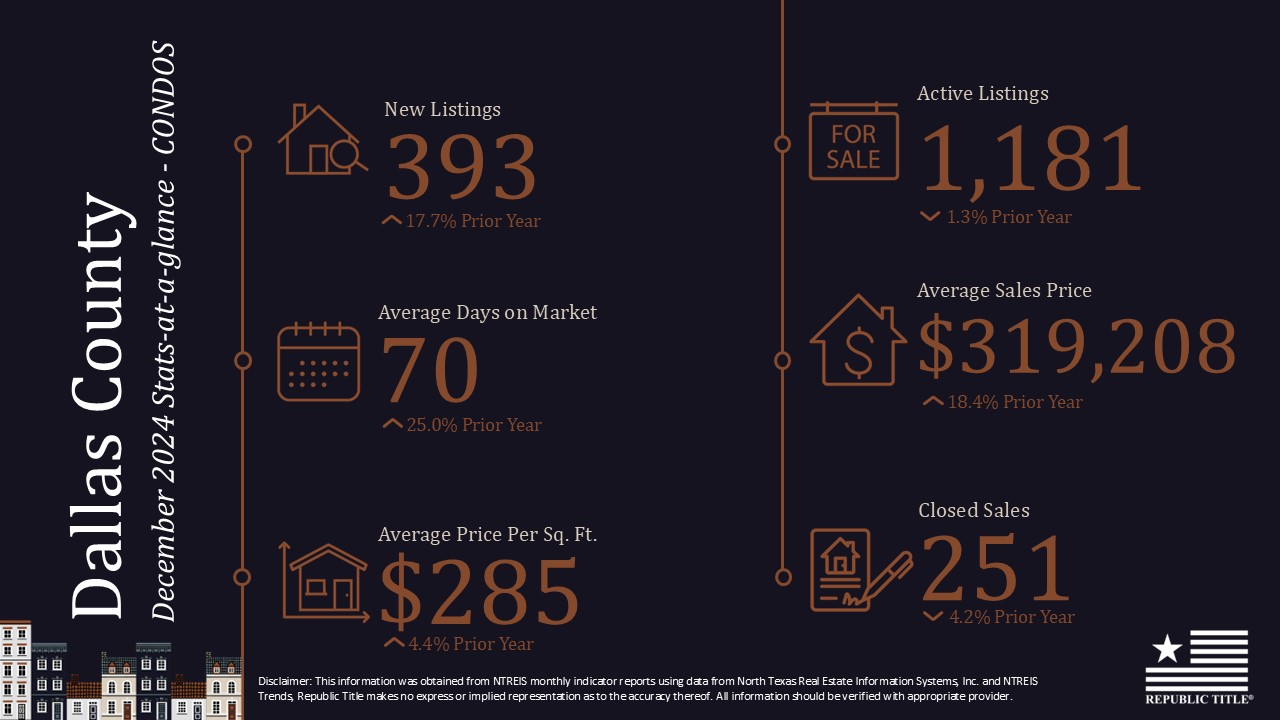
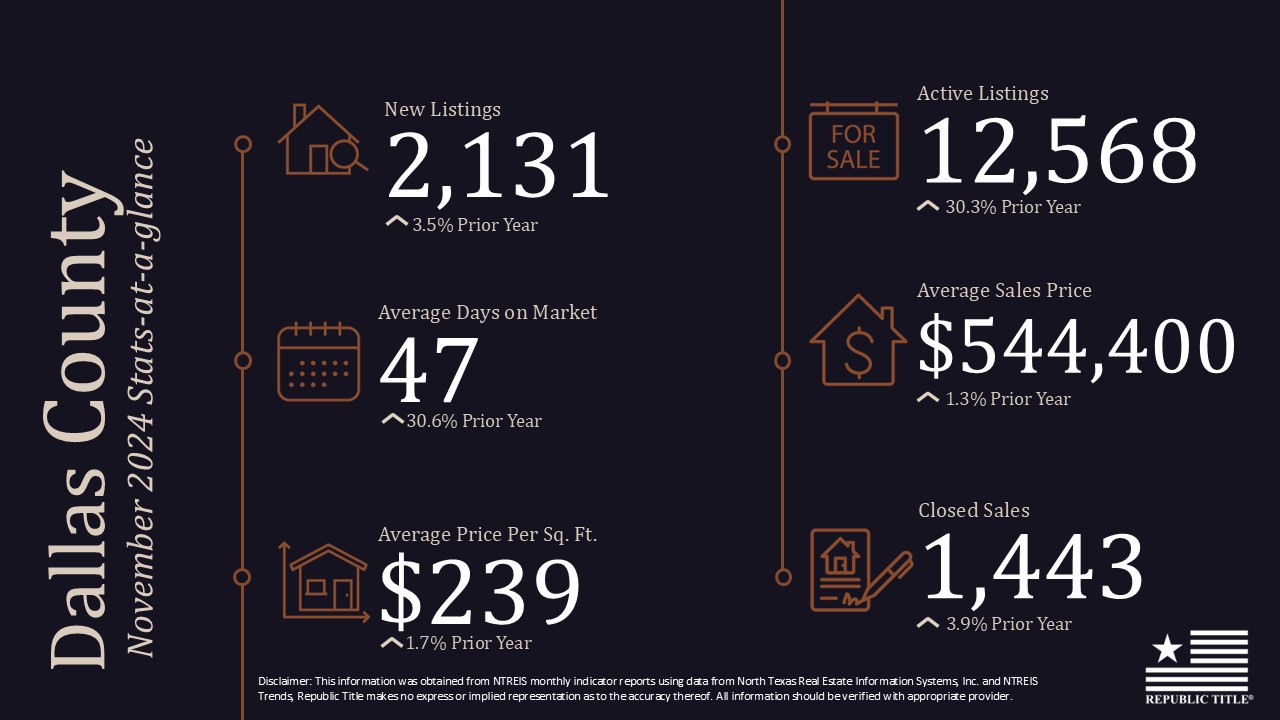
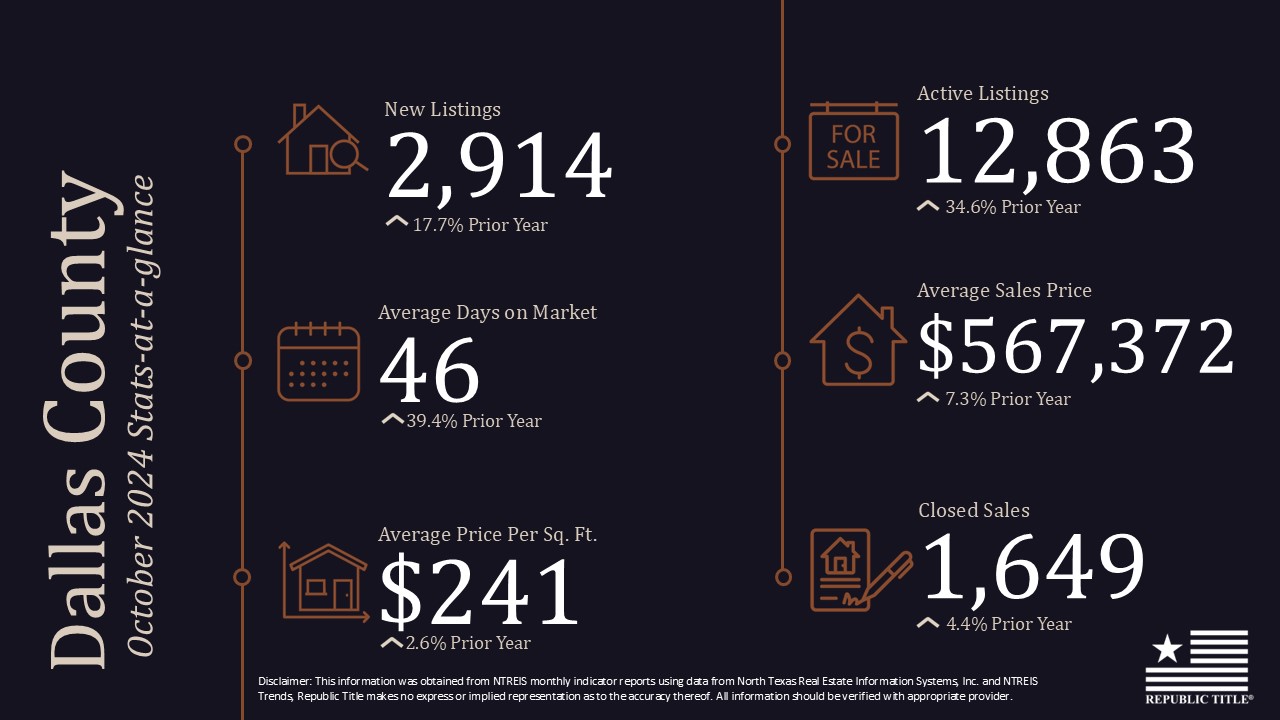
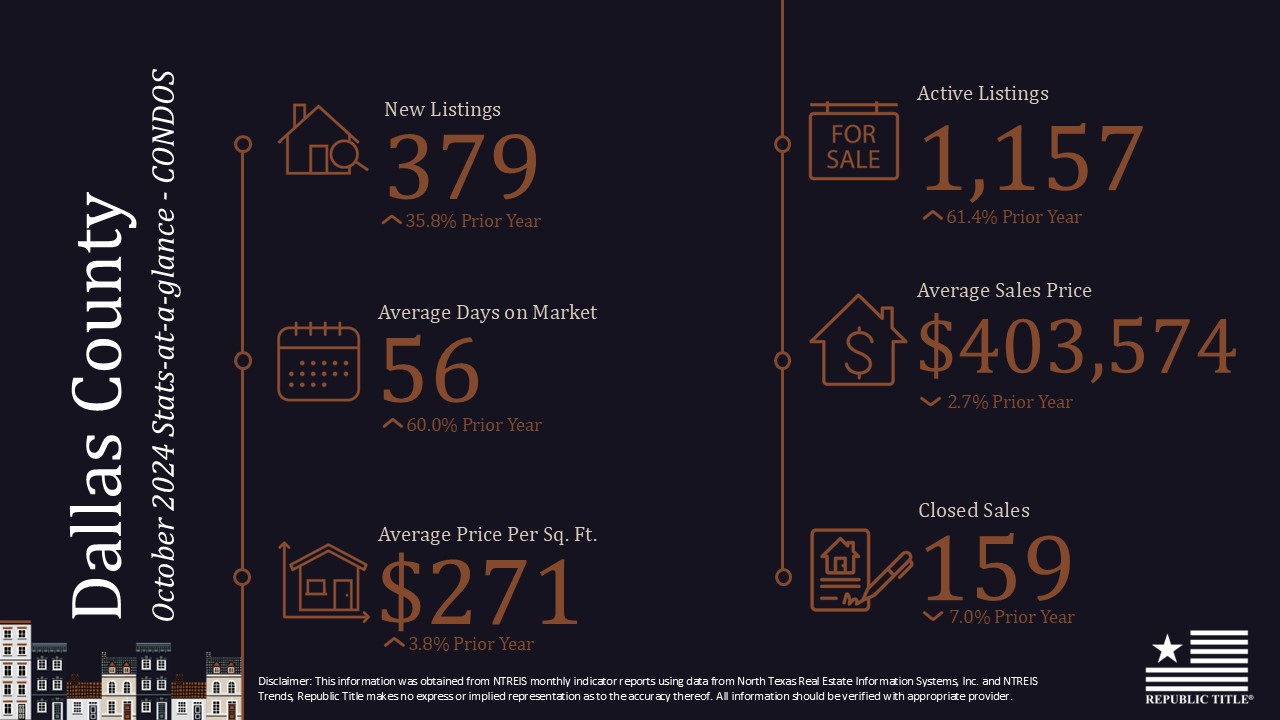
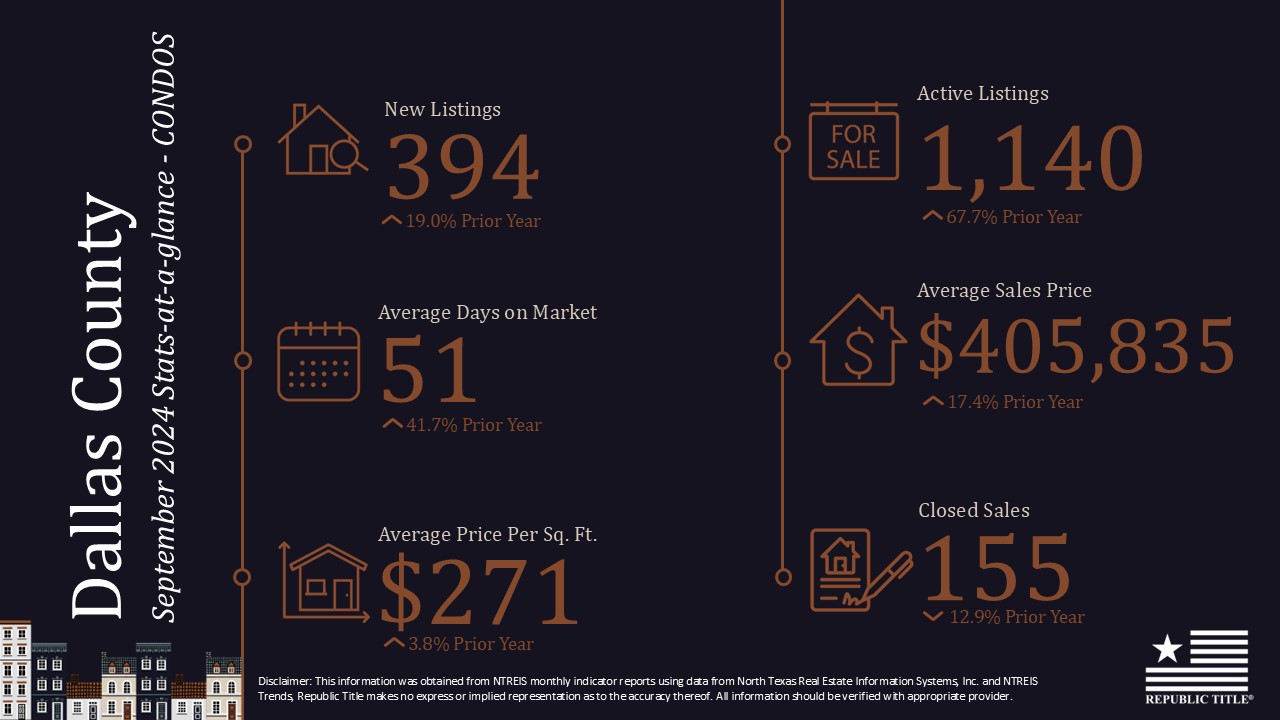
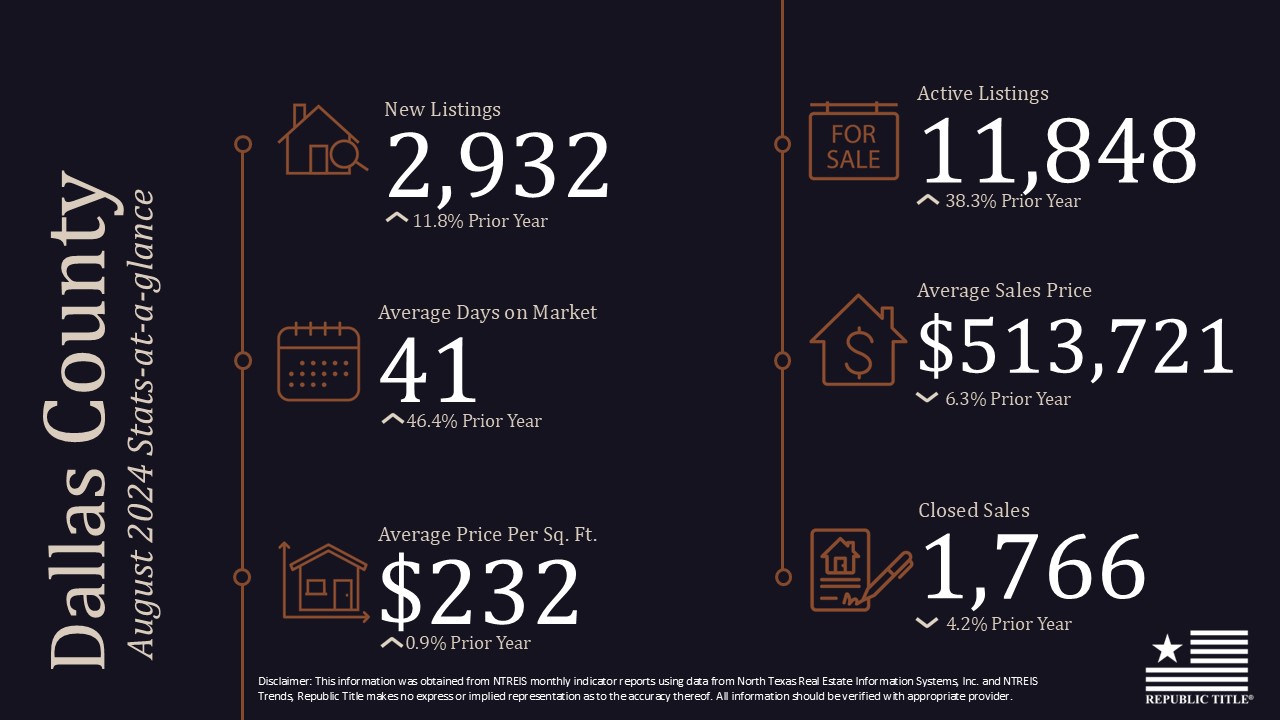
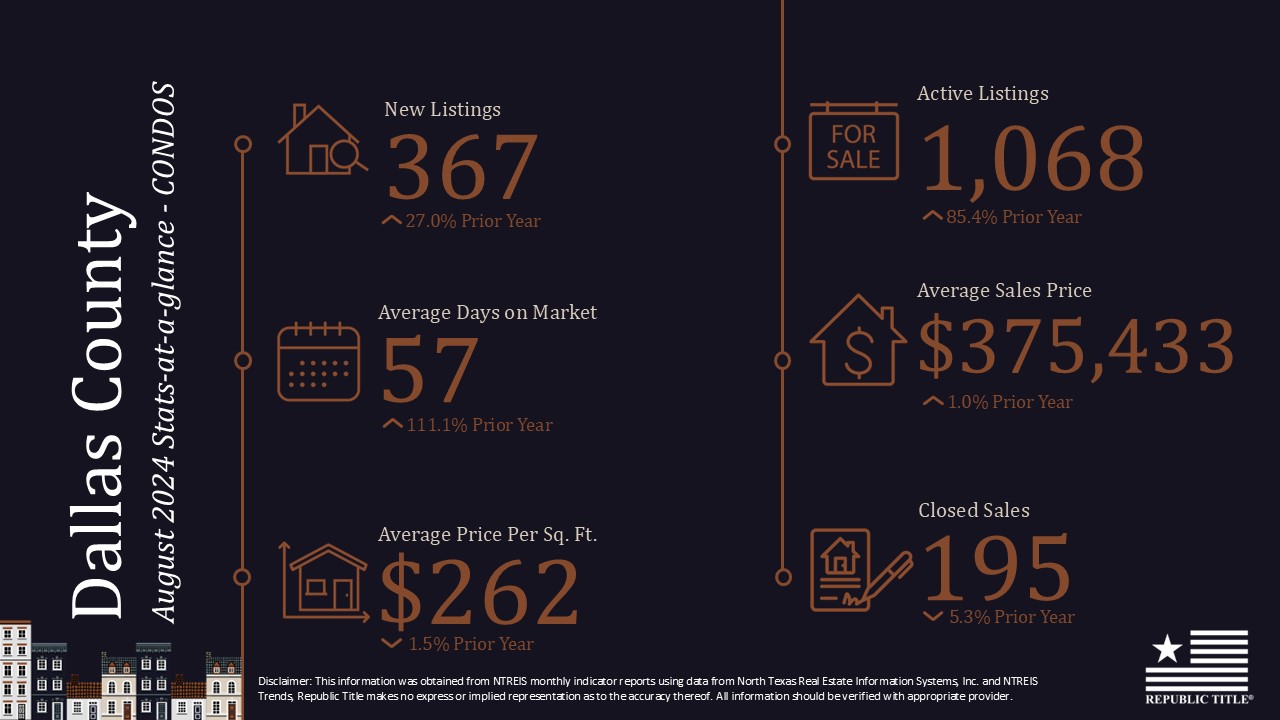
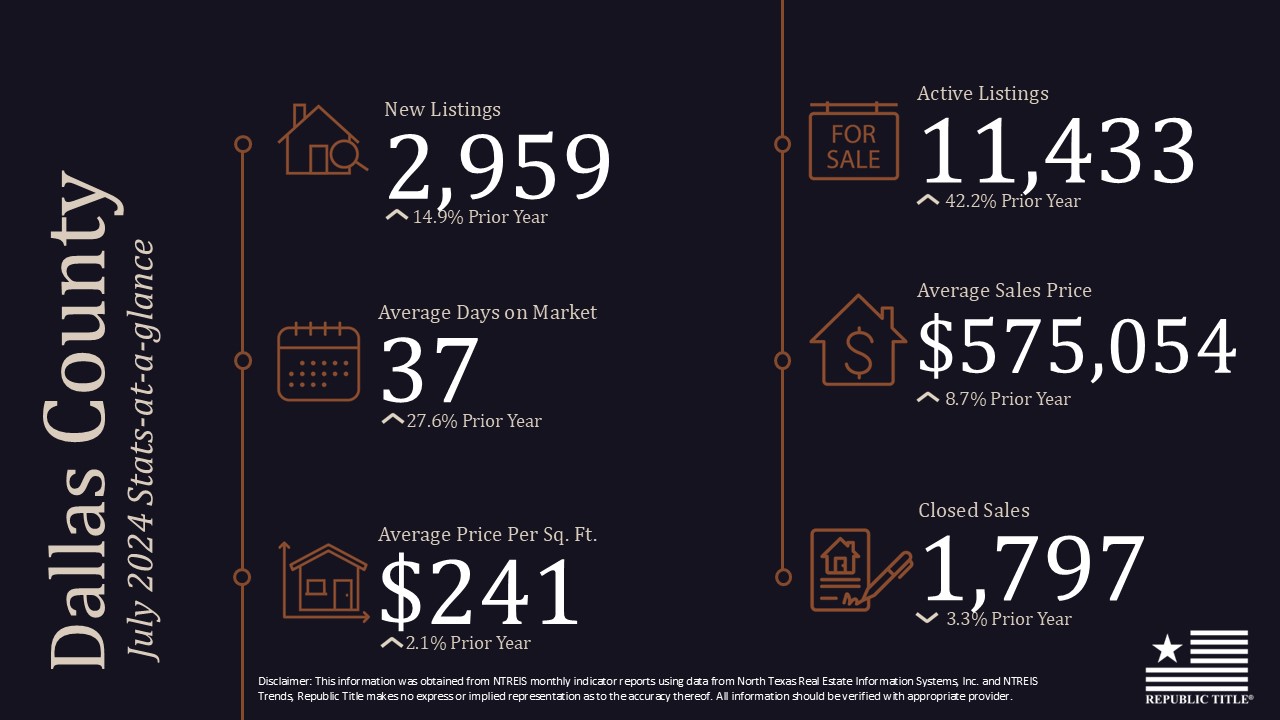
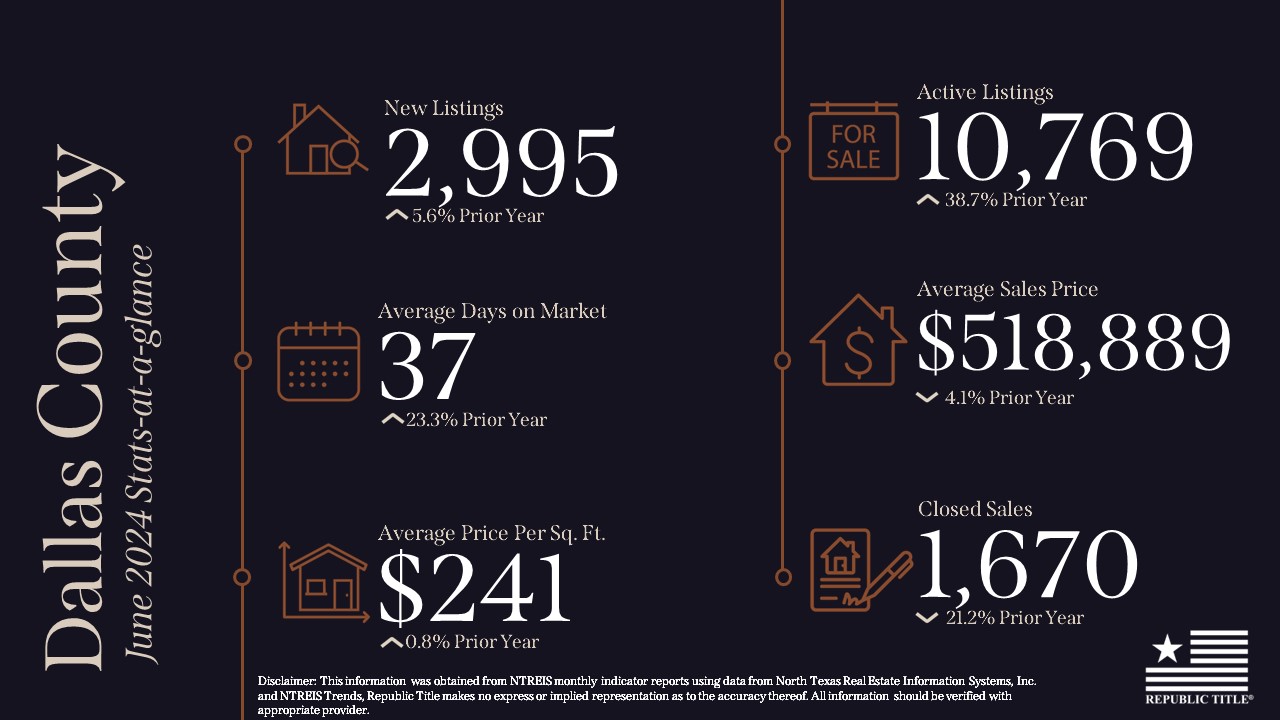
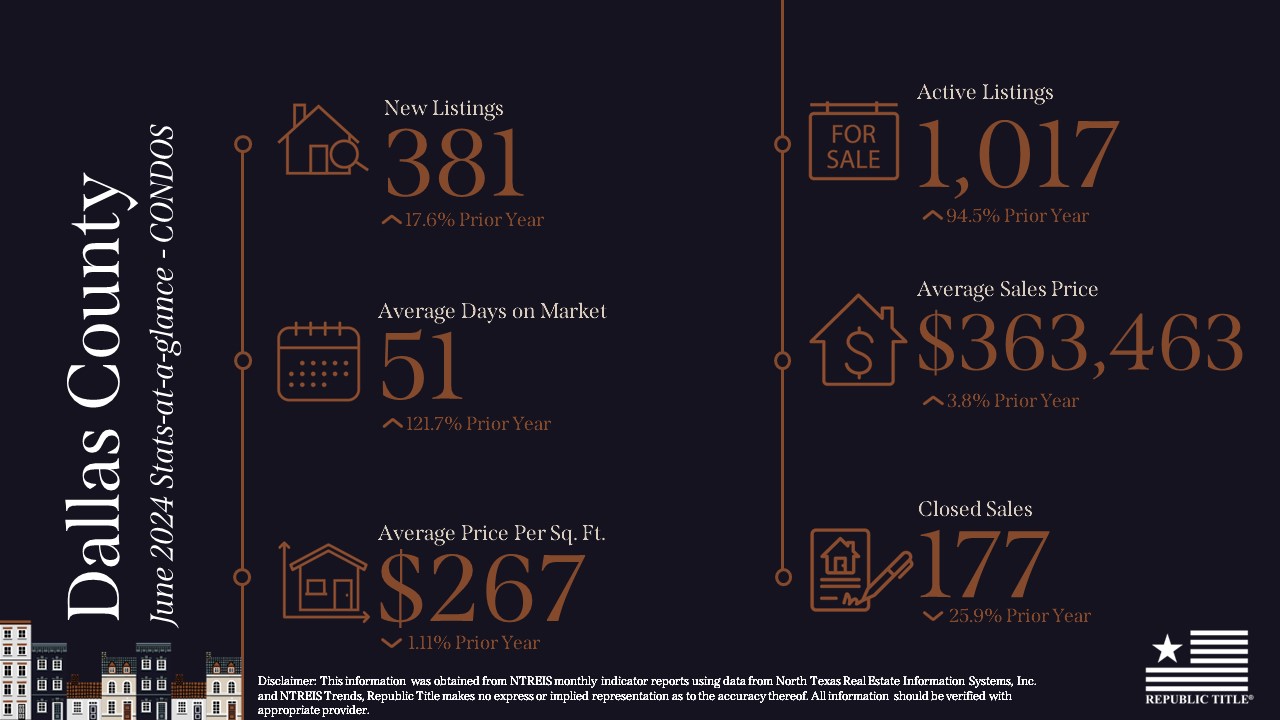
Dallas County continued to see strong activity with a 17.7% increase in new listings, totaling 2,914. Active listings surged by 34.6%, bringing the total to 12,863. The average sales price in the county increased by 7.3%, reaching $567,372, while average days on market increased by 39.4%, now at 46 days.
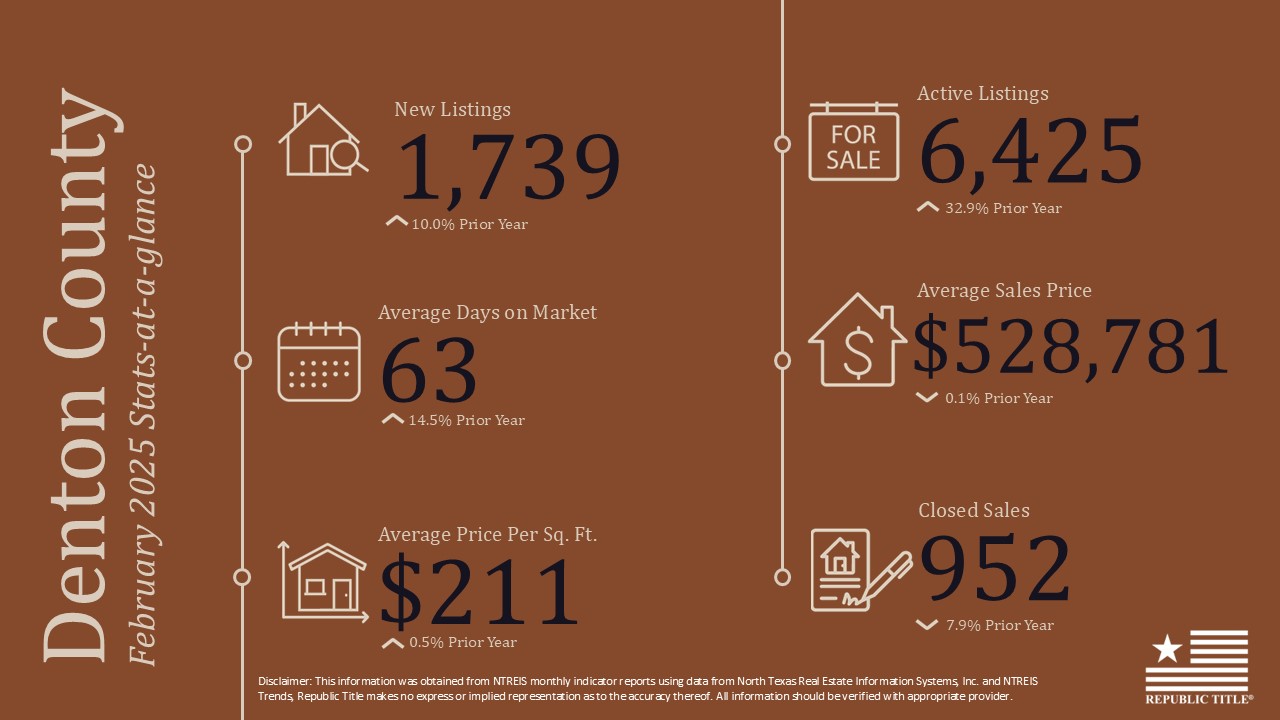
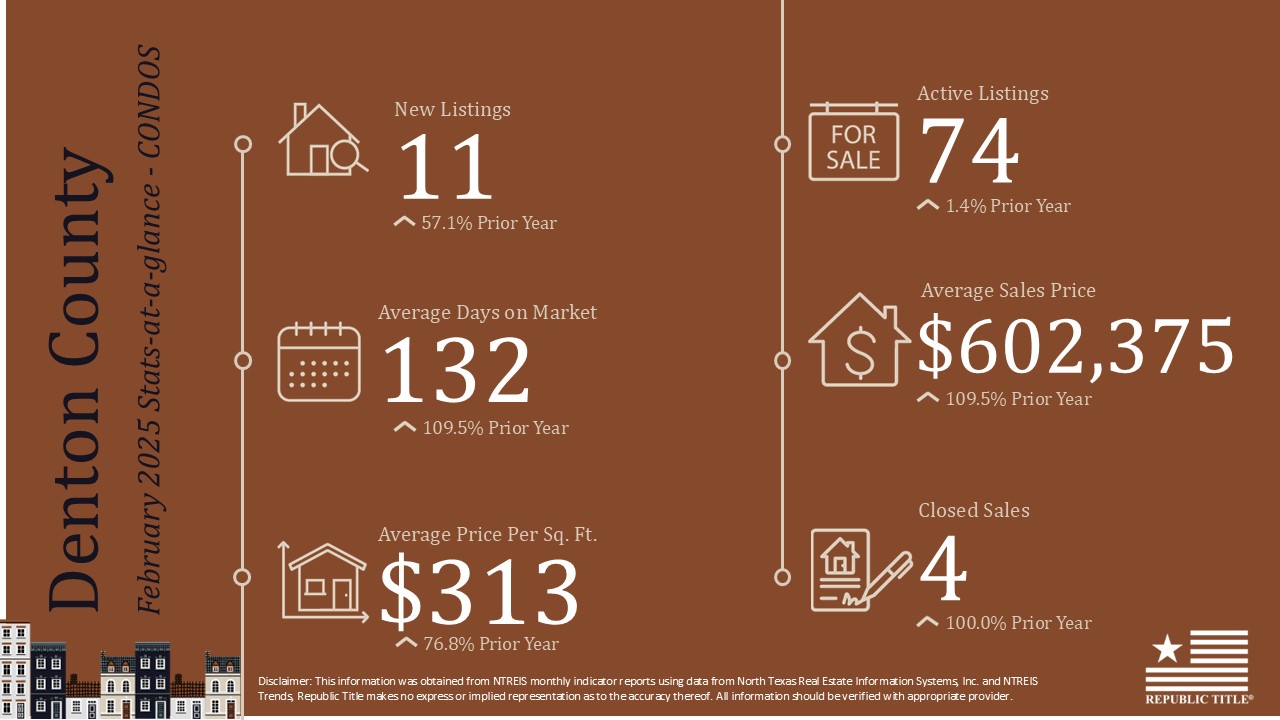
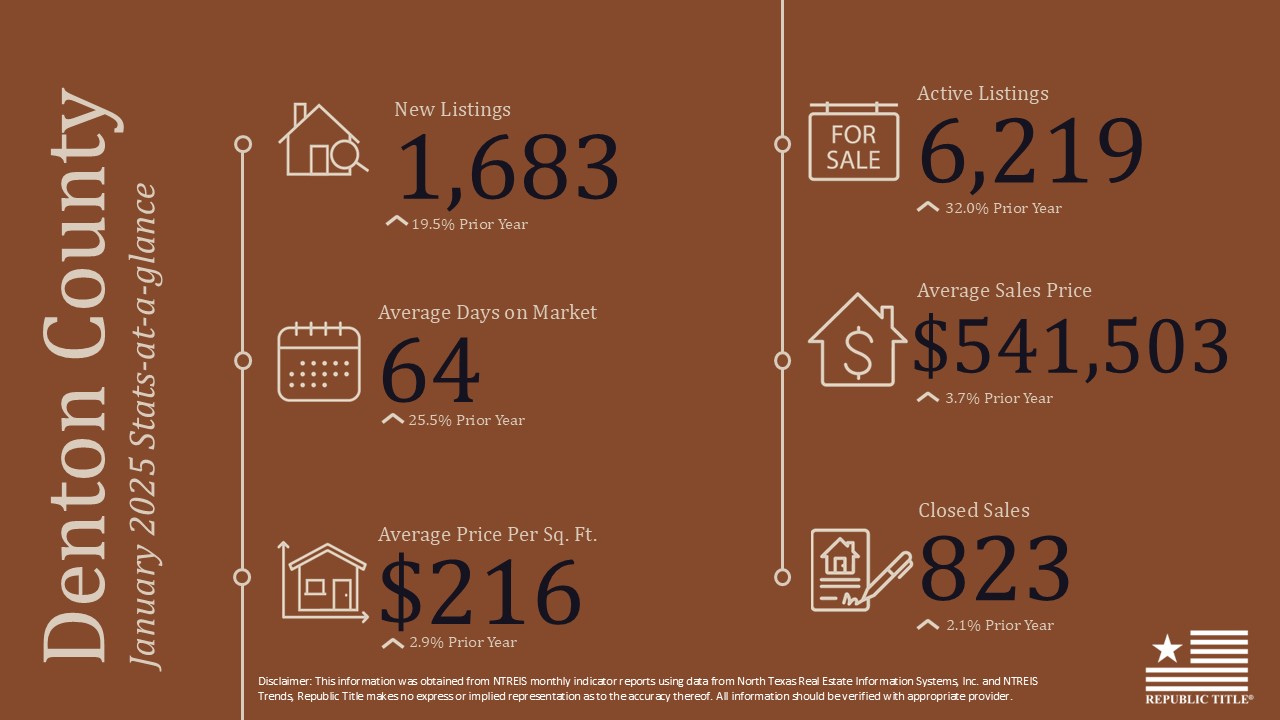
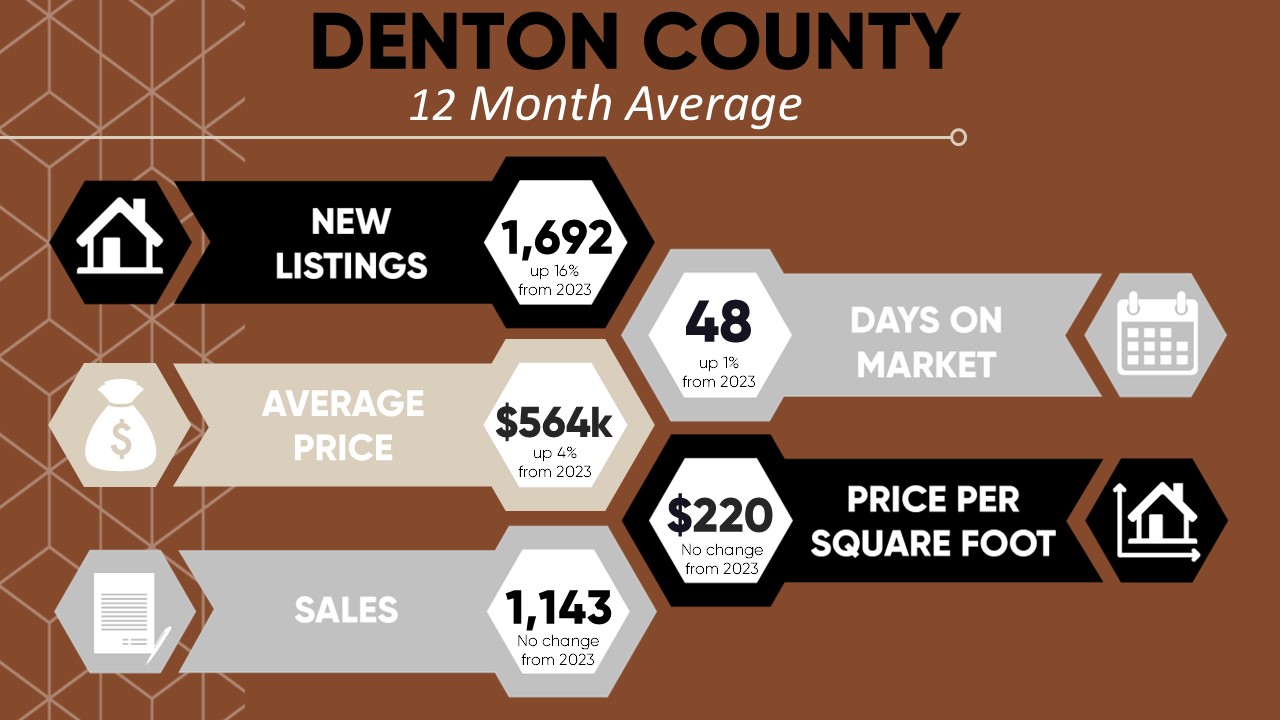
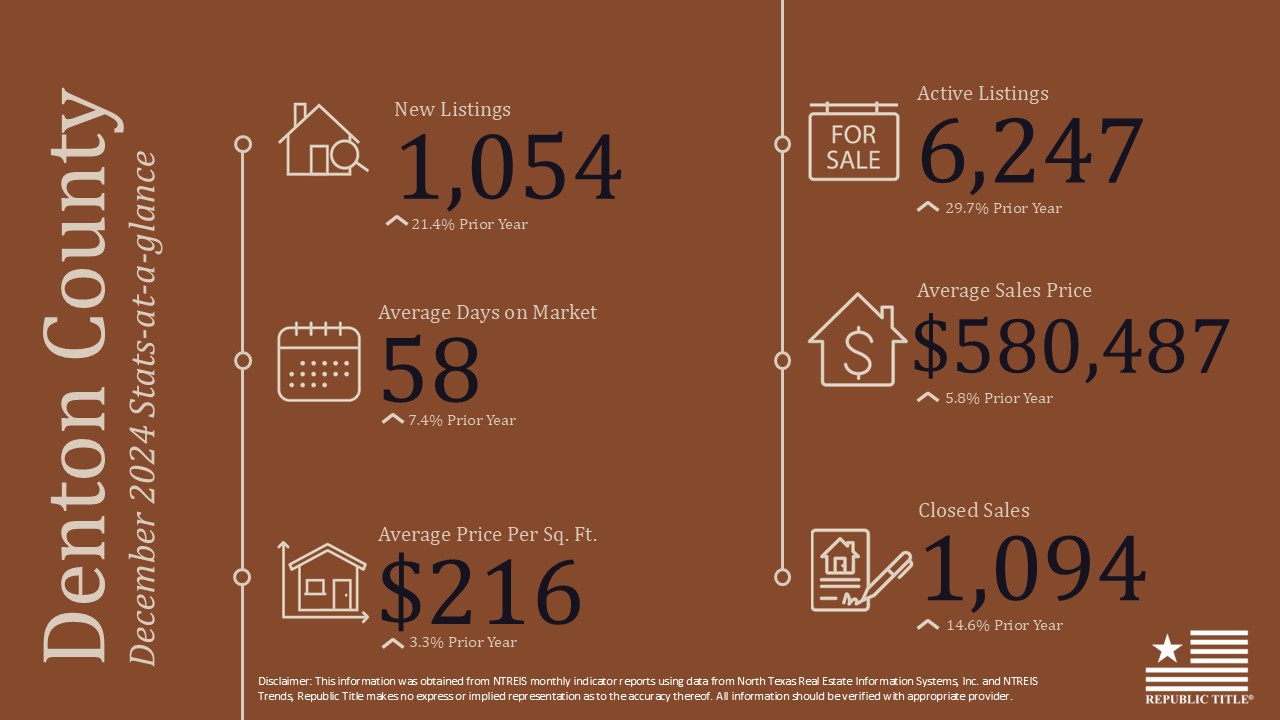
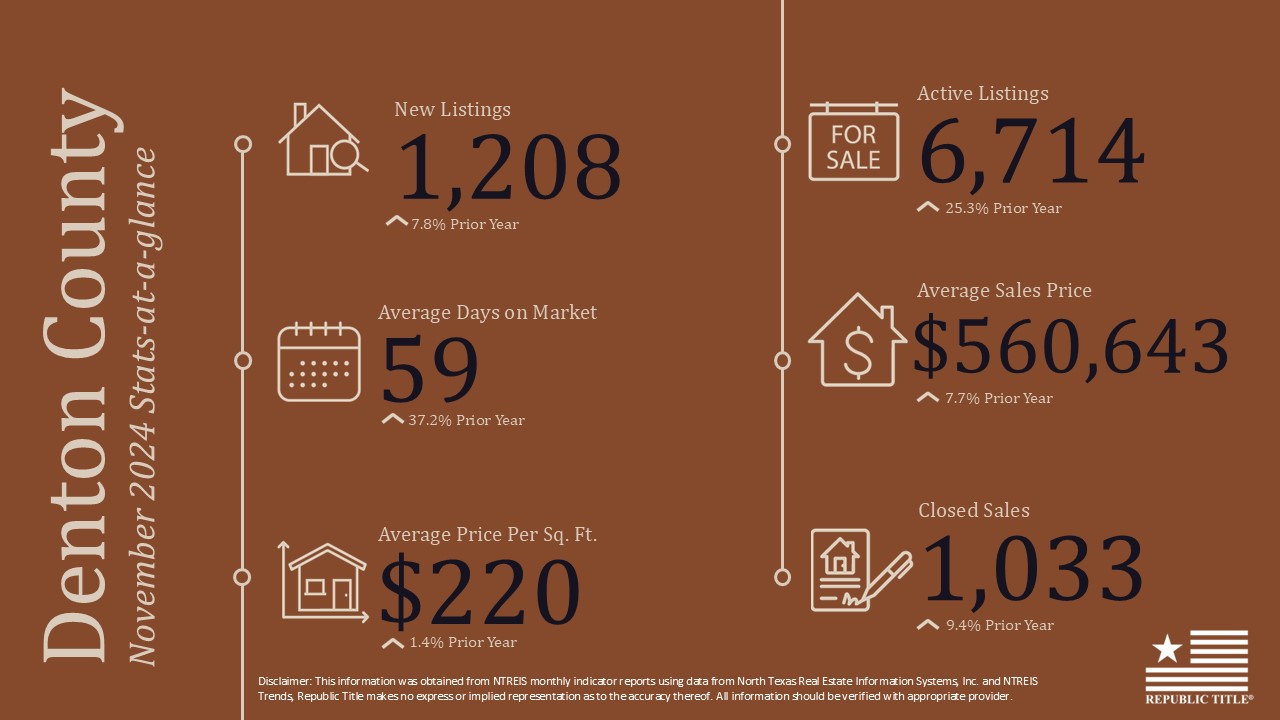
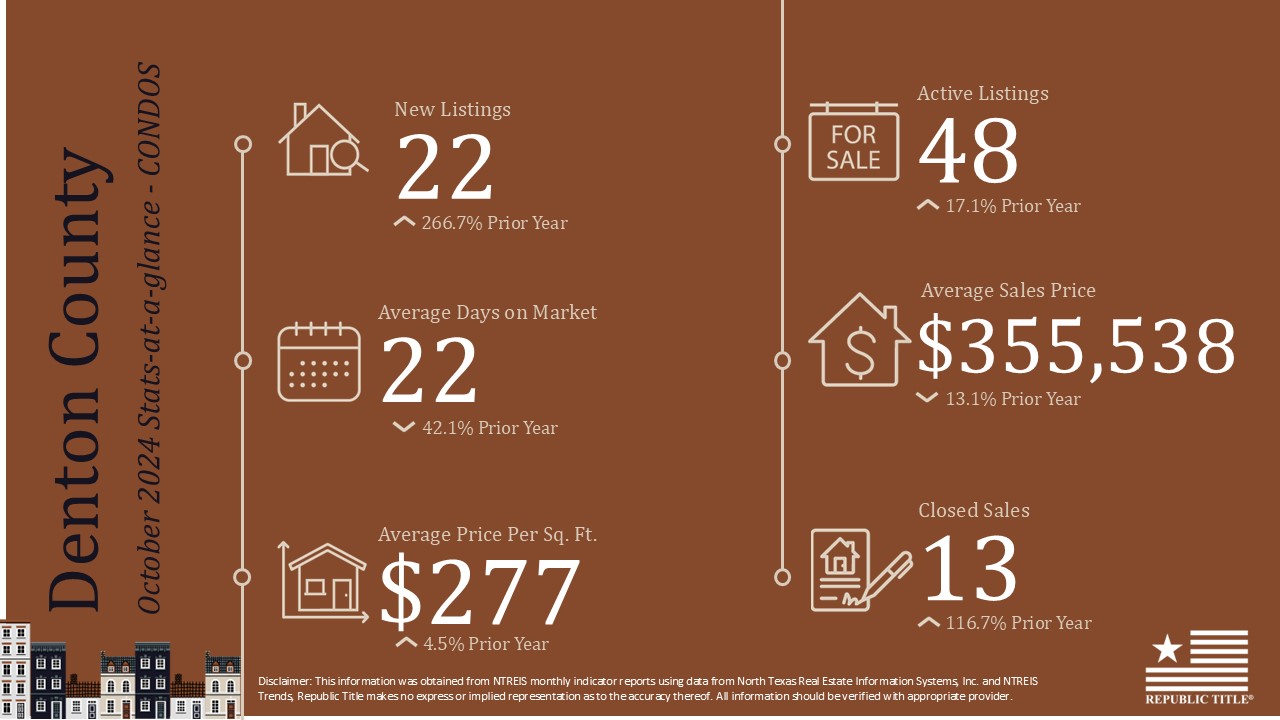
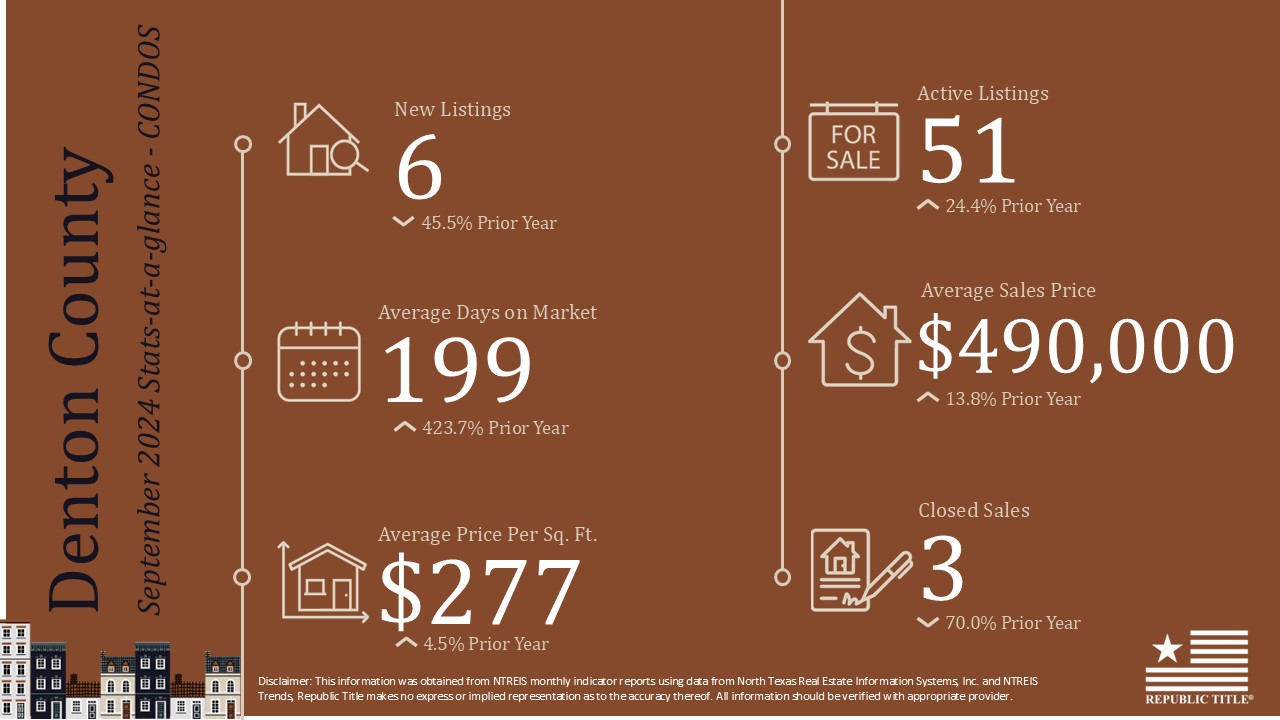
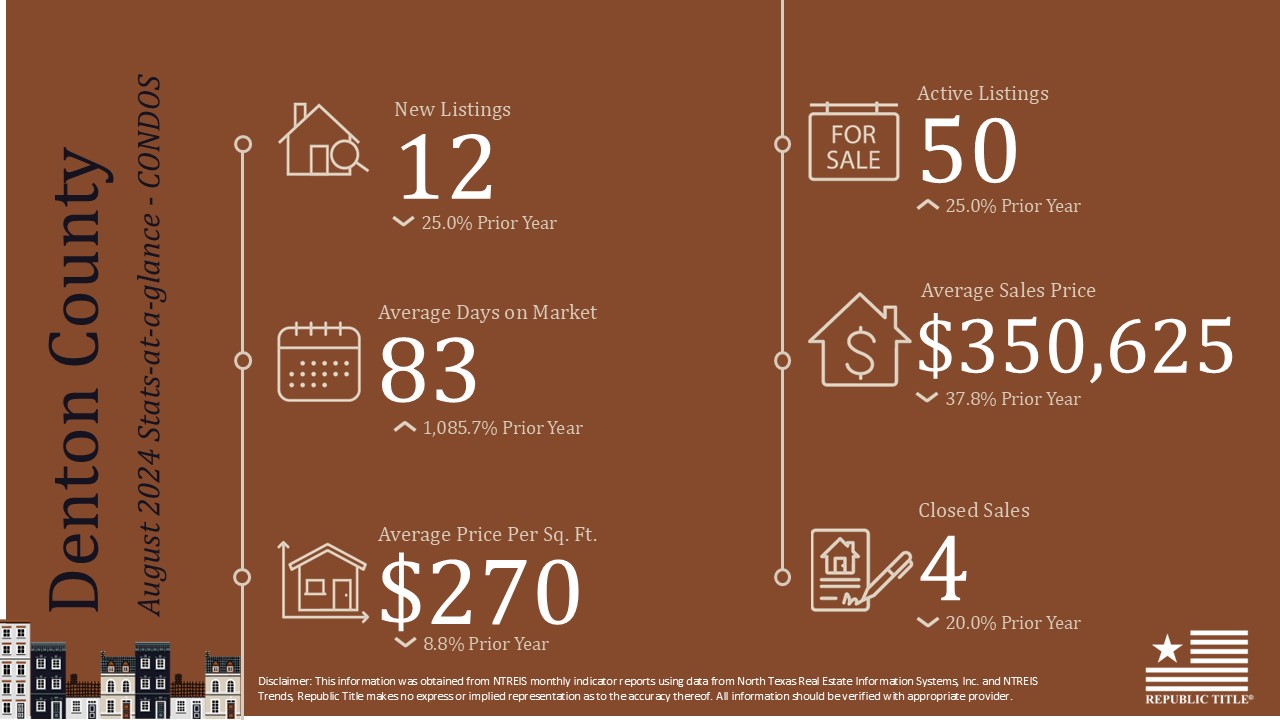
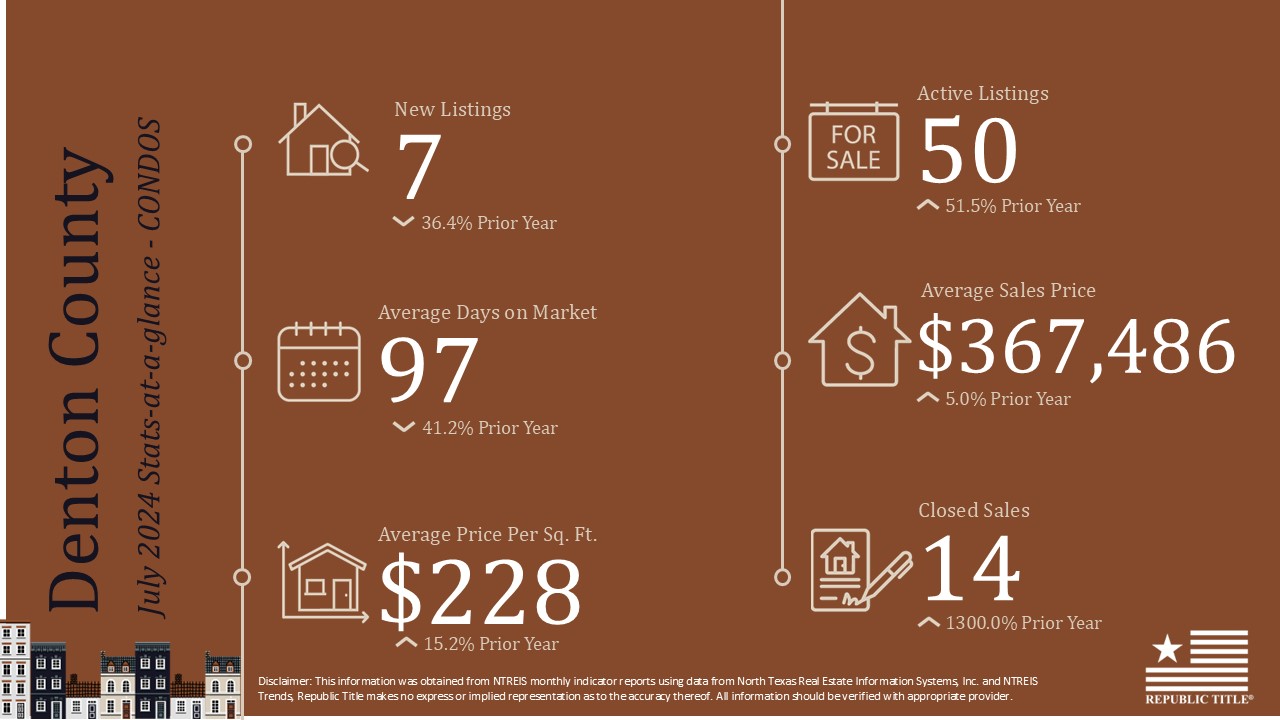
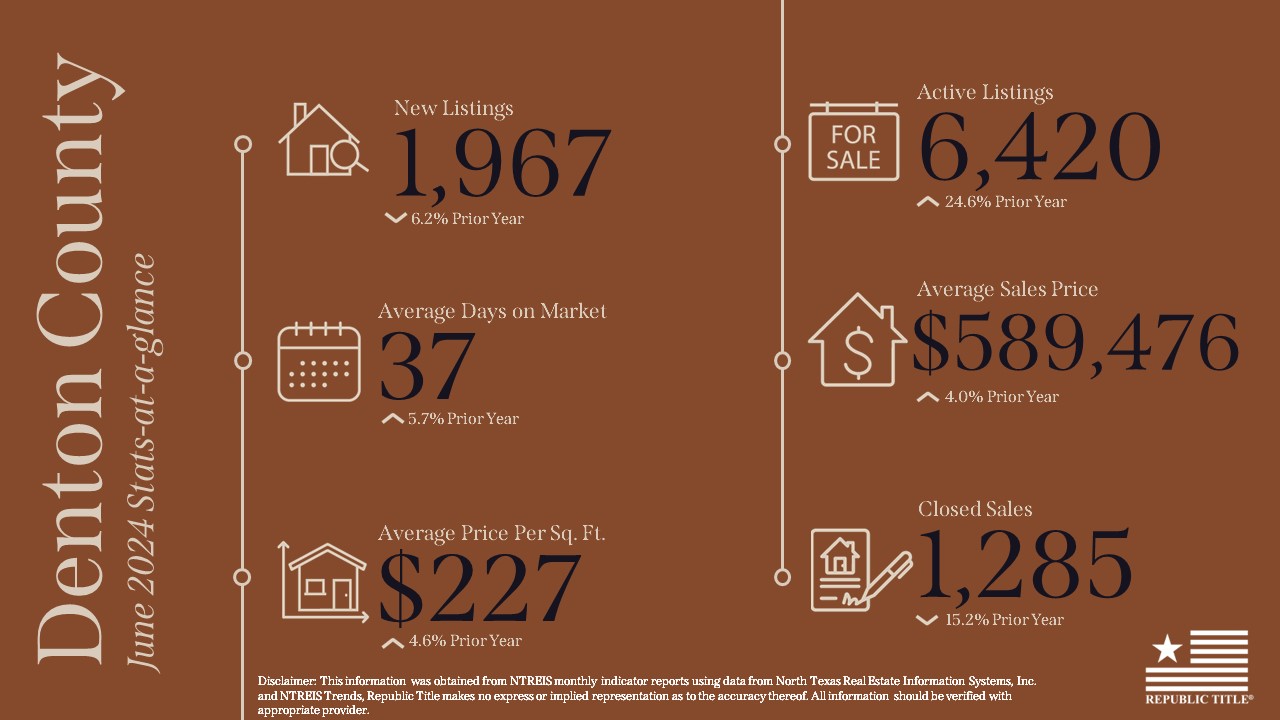
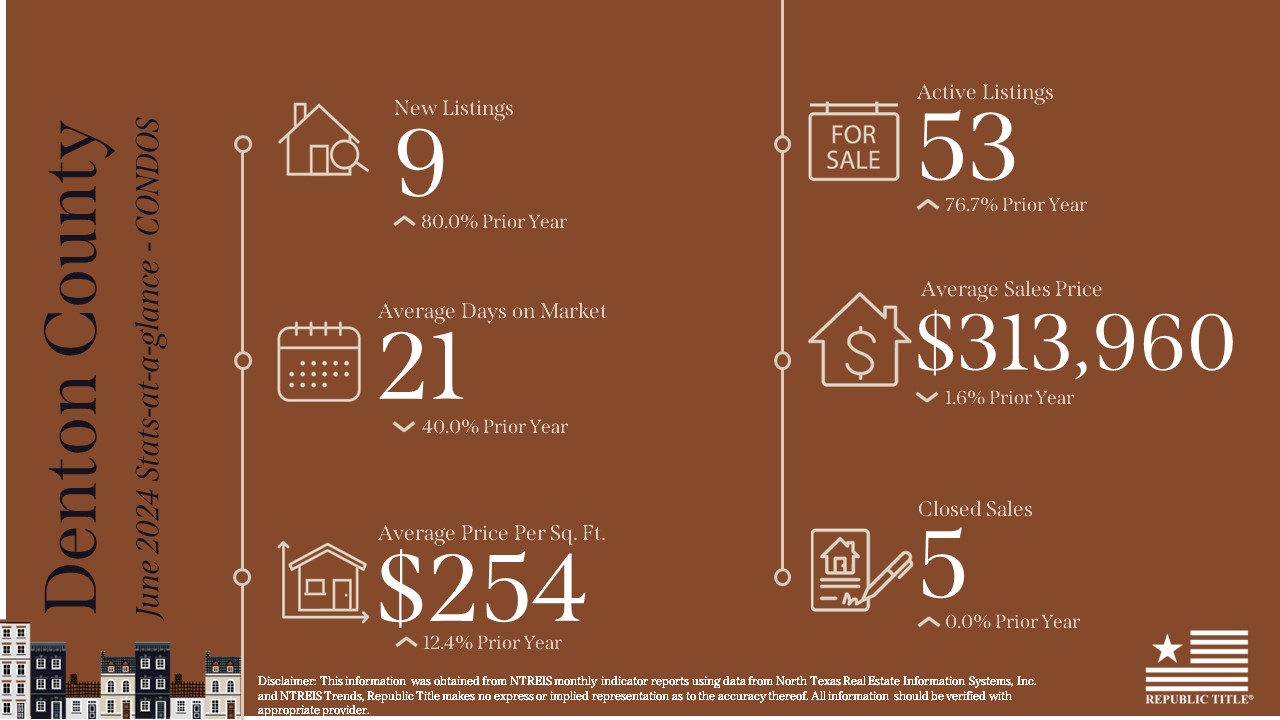
In Denton County, new listings grew by 22.8%, while active listings rose by 30%. The average sales price increased by 5.6%, reaching $567,045. The number of closed sales saw a modest rise of 4.6%, with homes spending 52 days on the market, up by 20.9%.
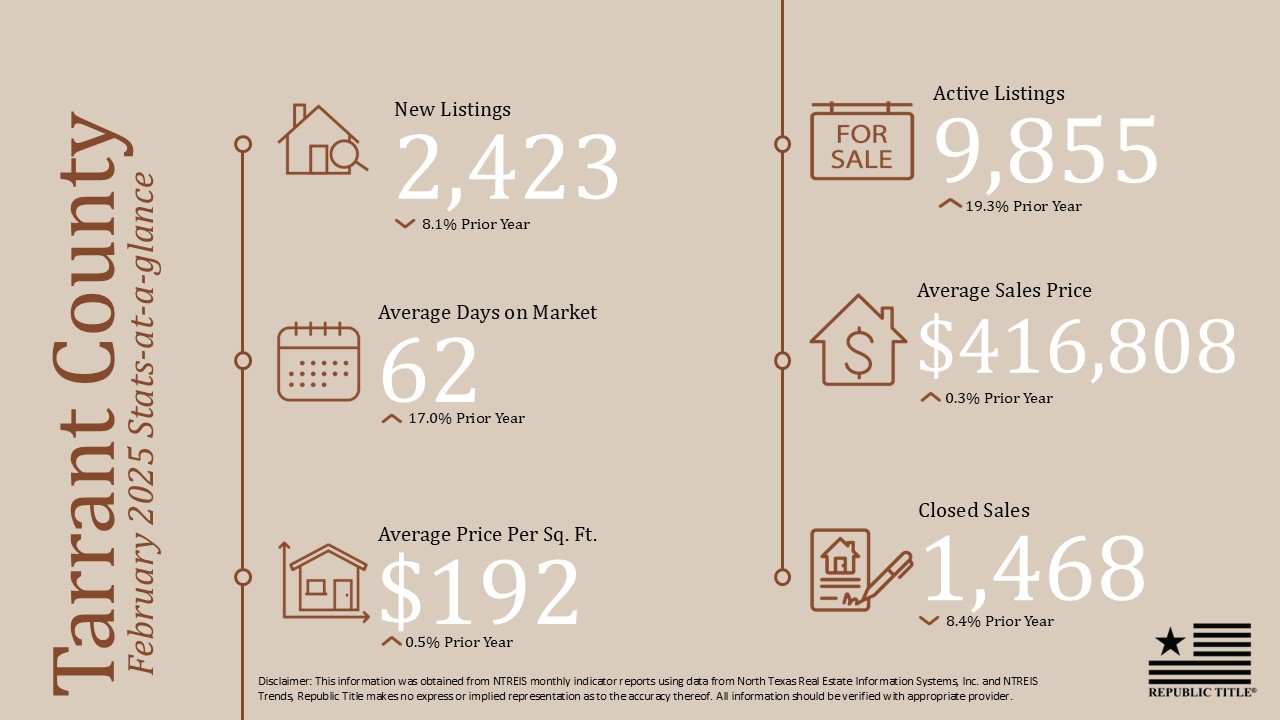
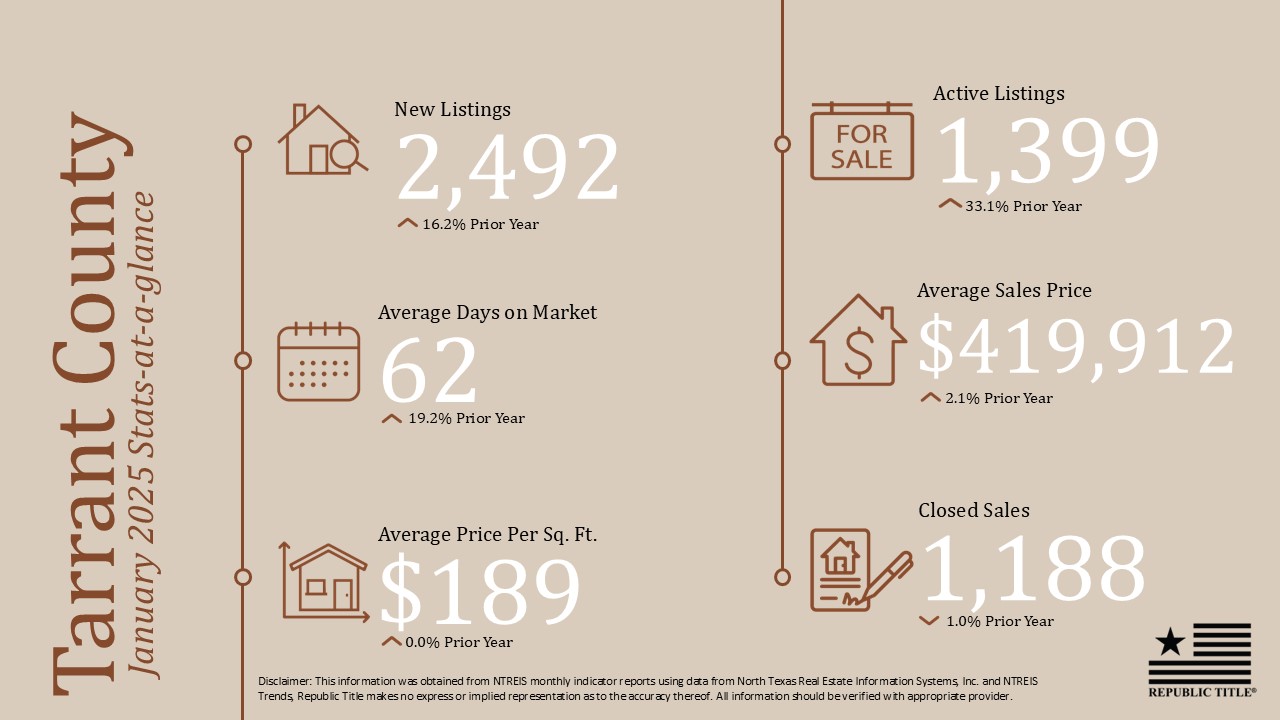
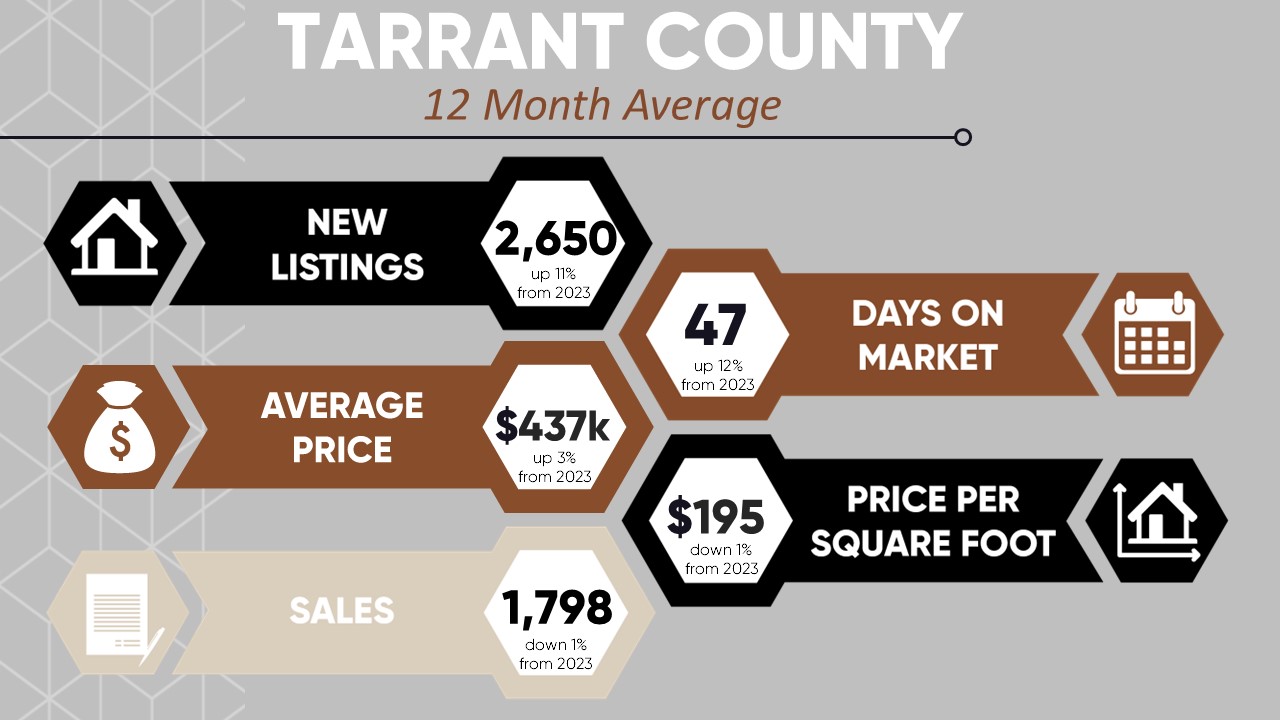
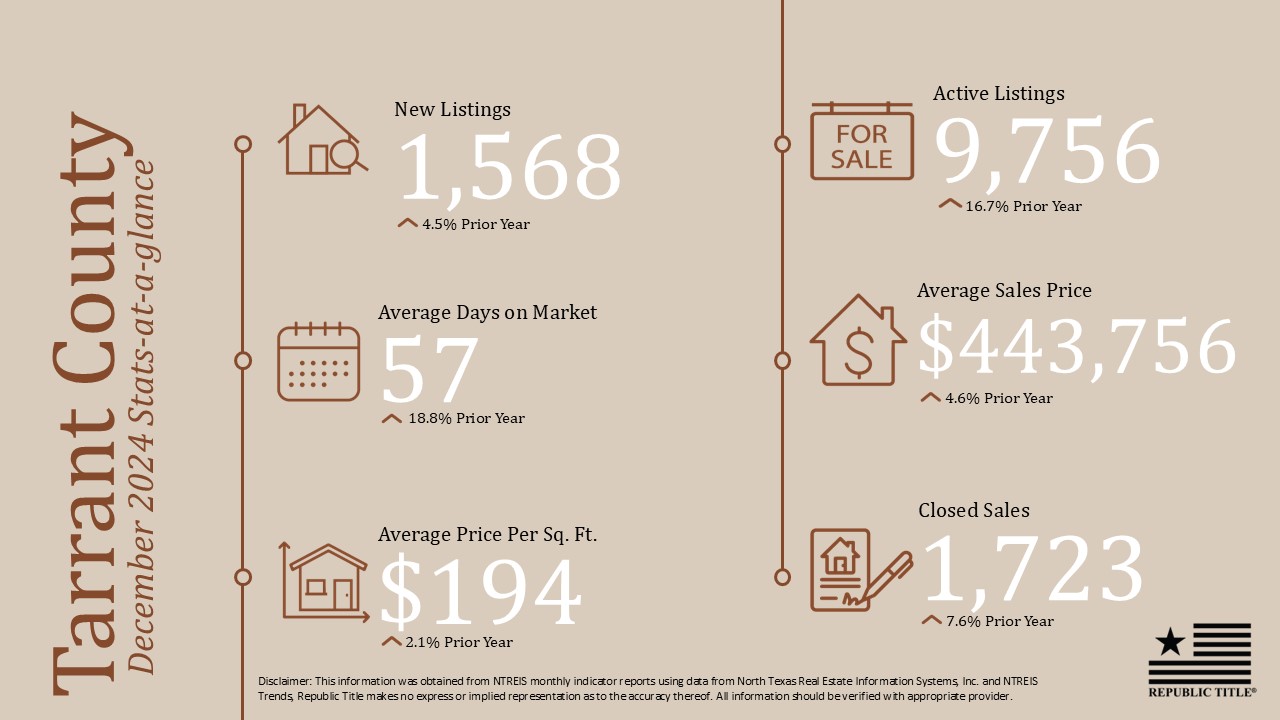
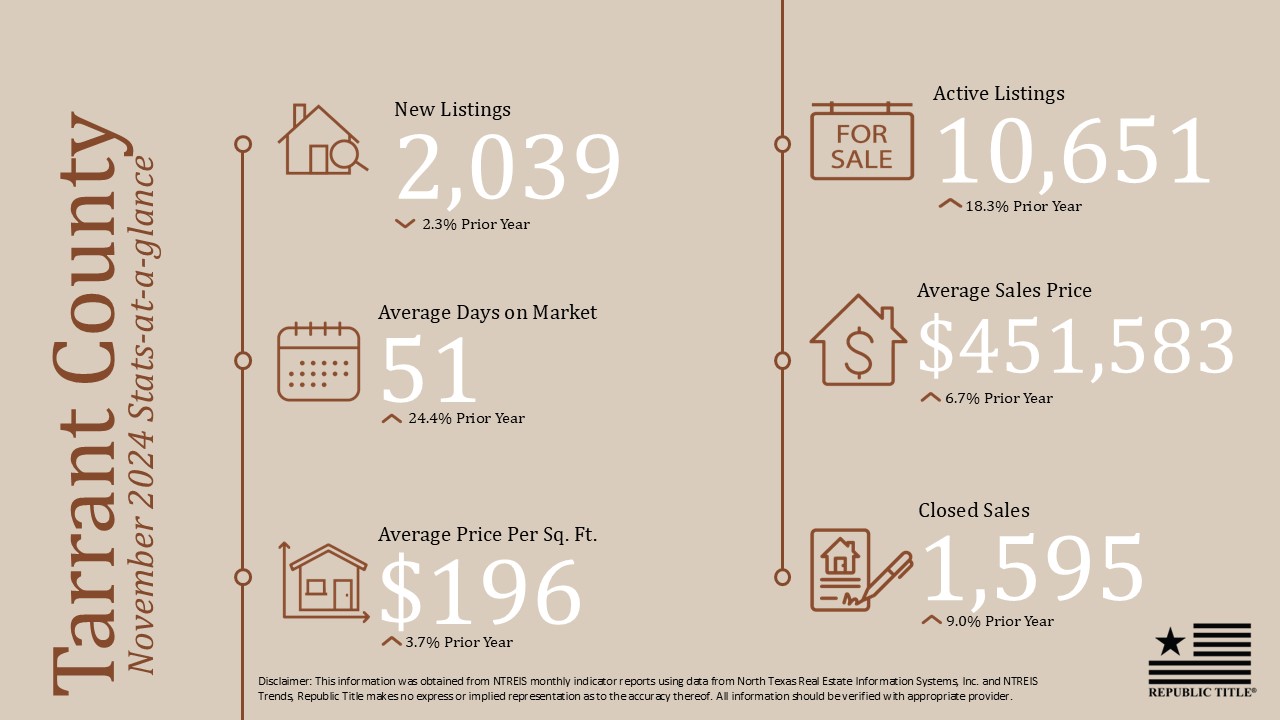
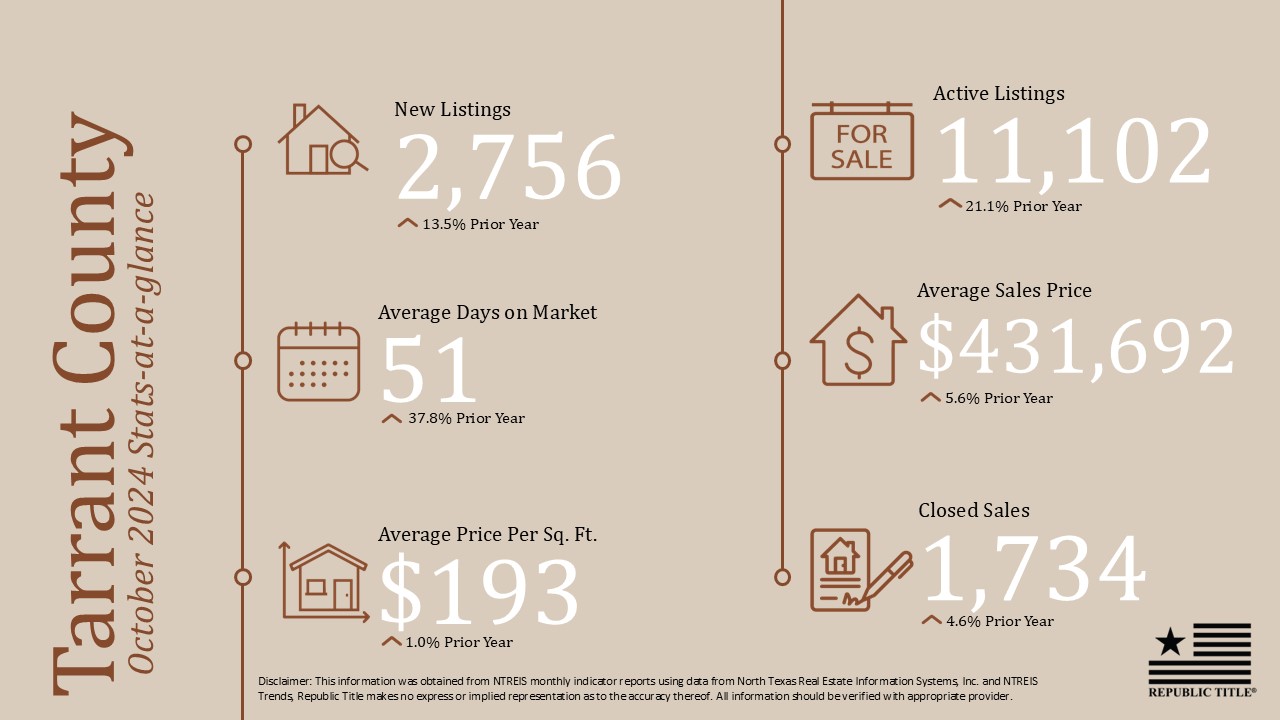
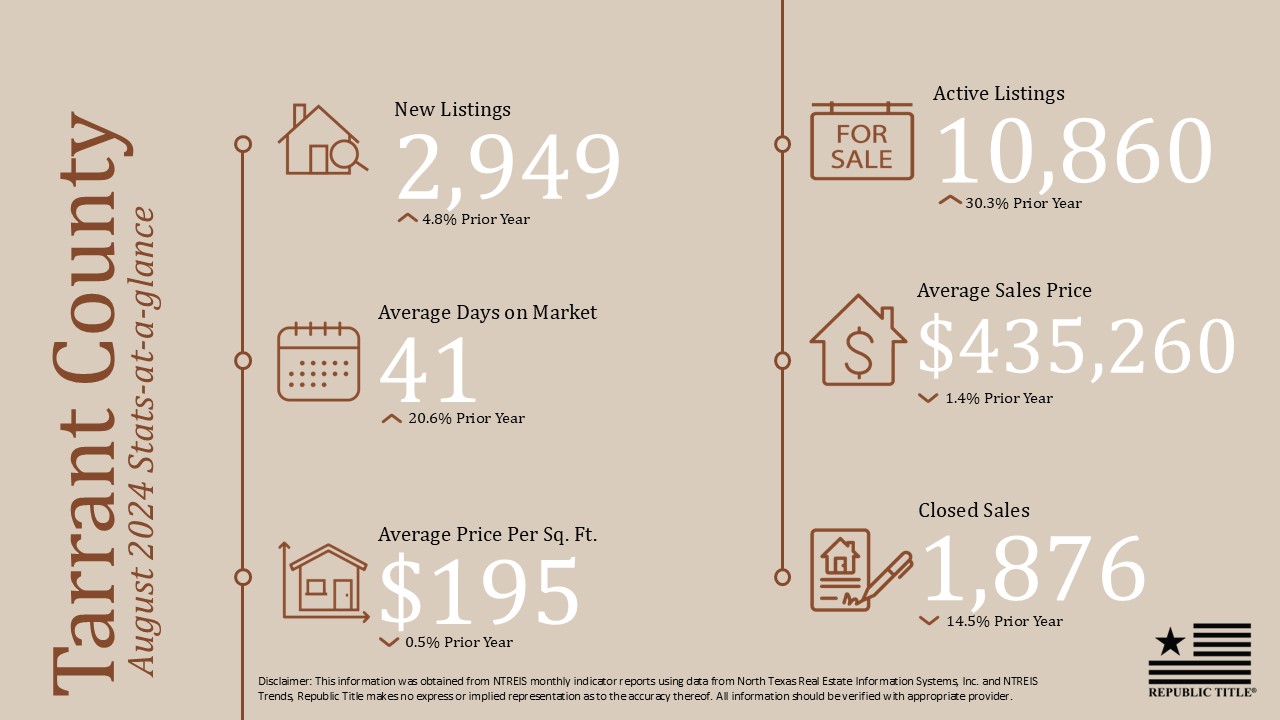
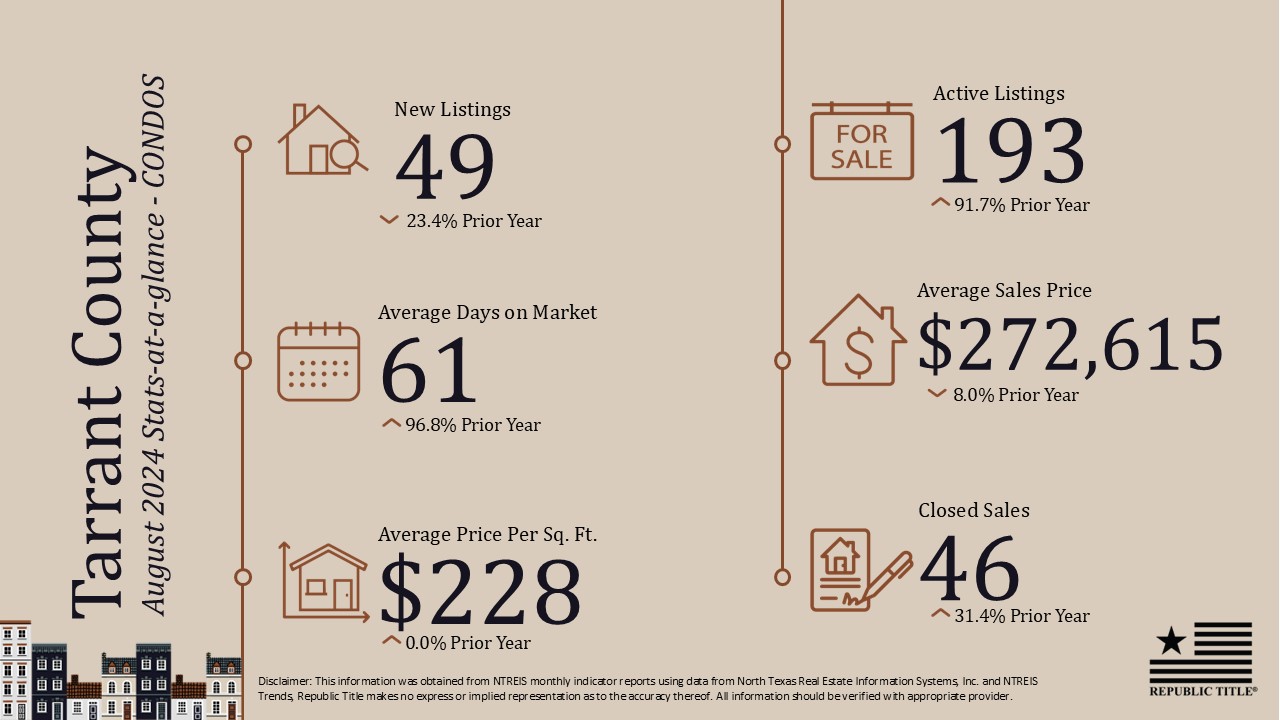
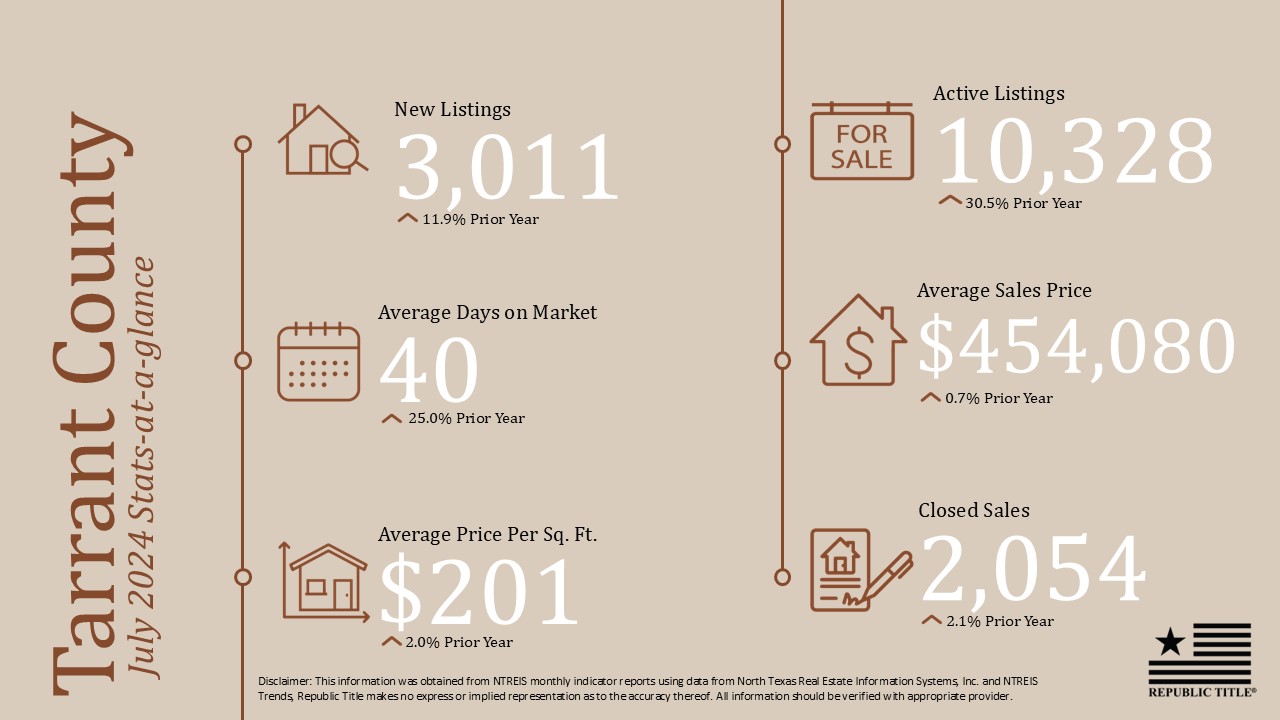
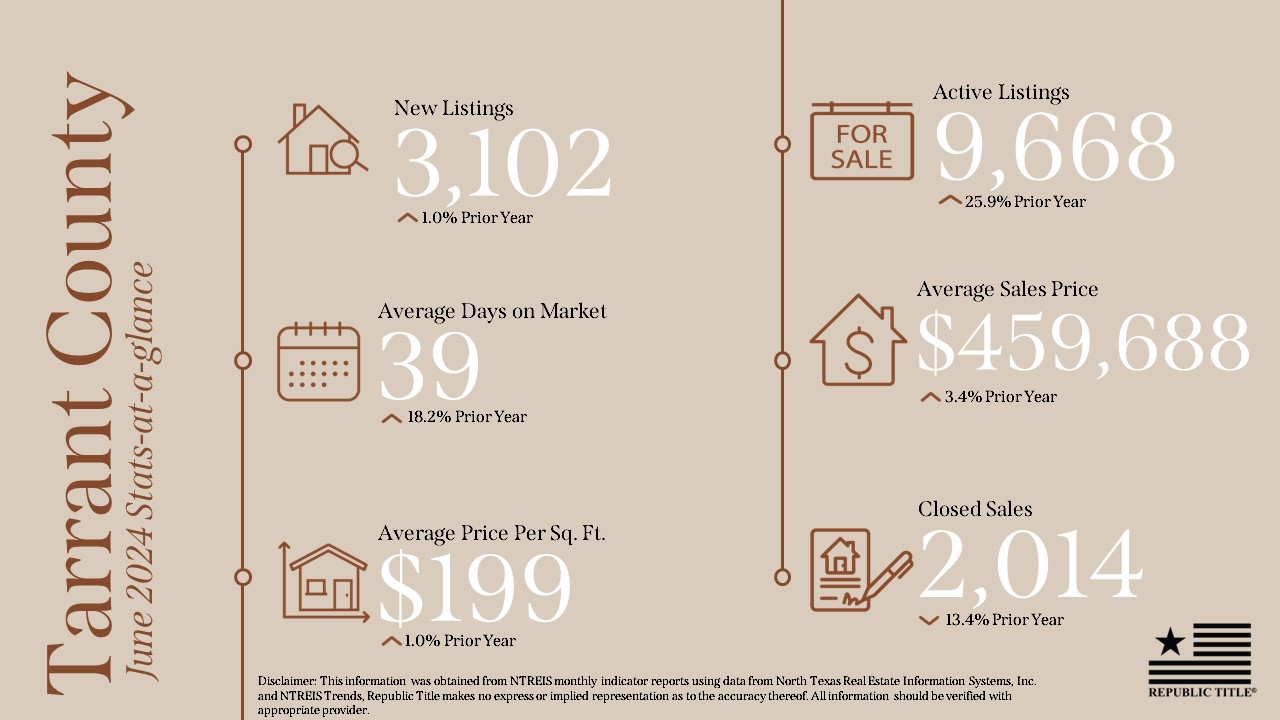
In Tarrant County, active listings grew by 21.1%, while new listings increased by 13.5%. The average sales price reached $431,692, up by 5.6%, and homes spent an average of 51 days on the market, up 37.8% from last year.
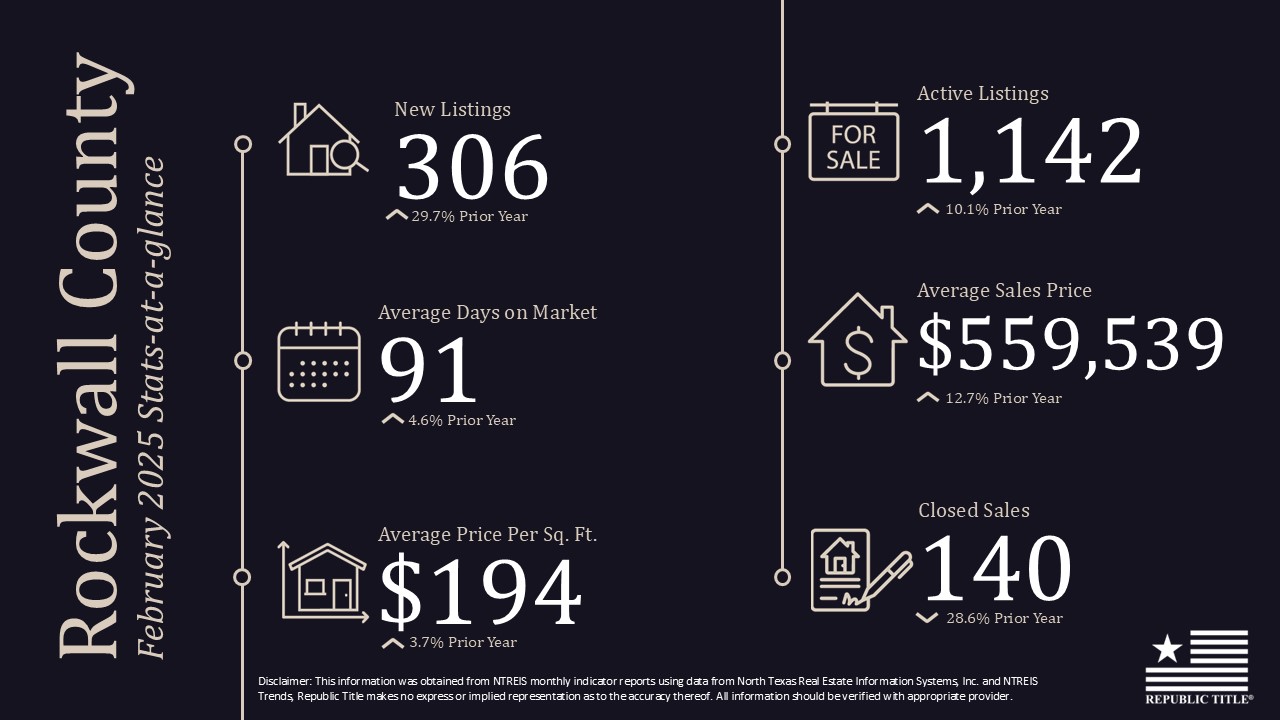
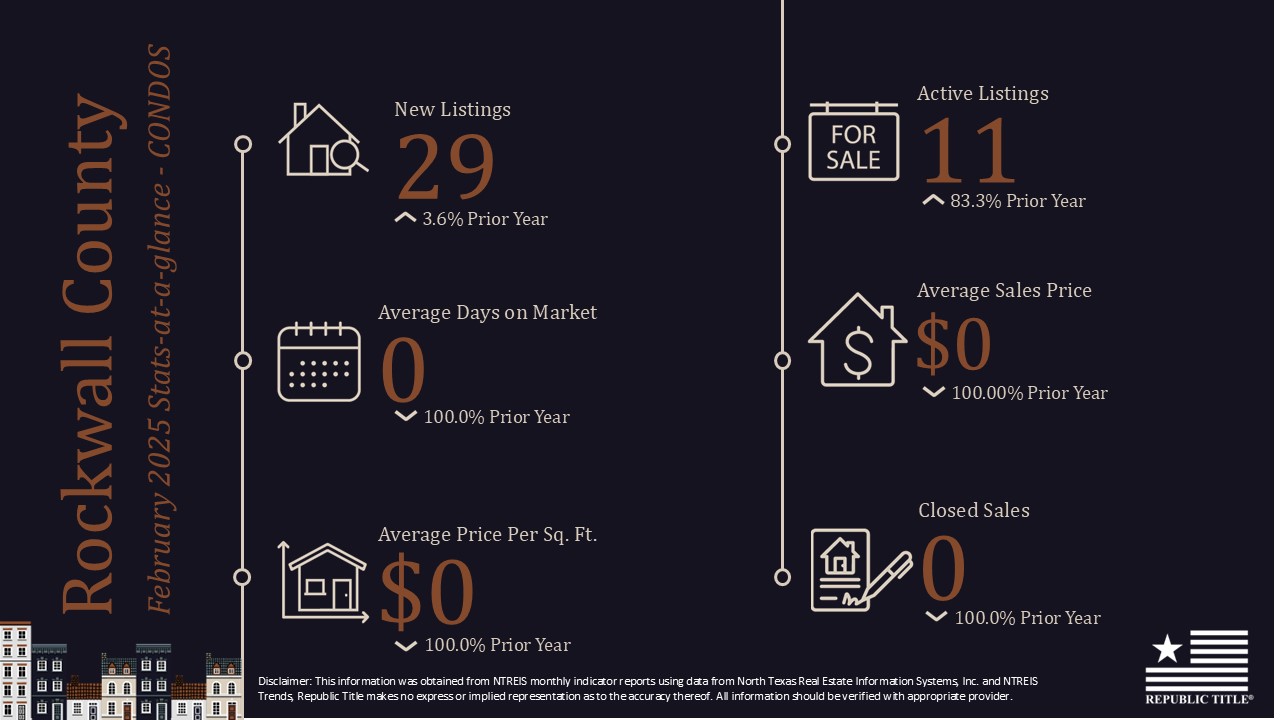
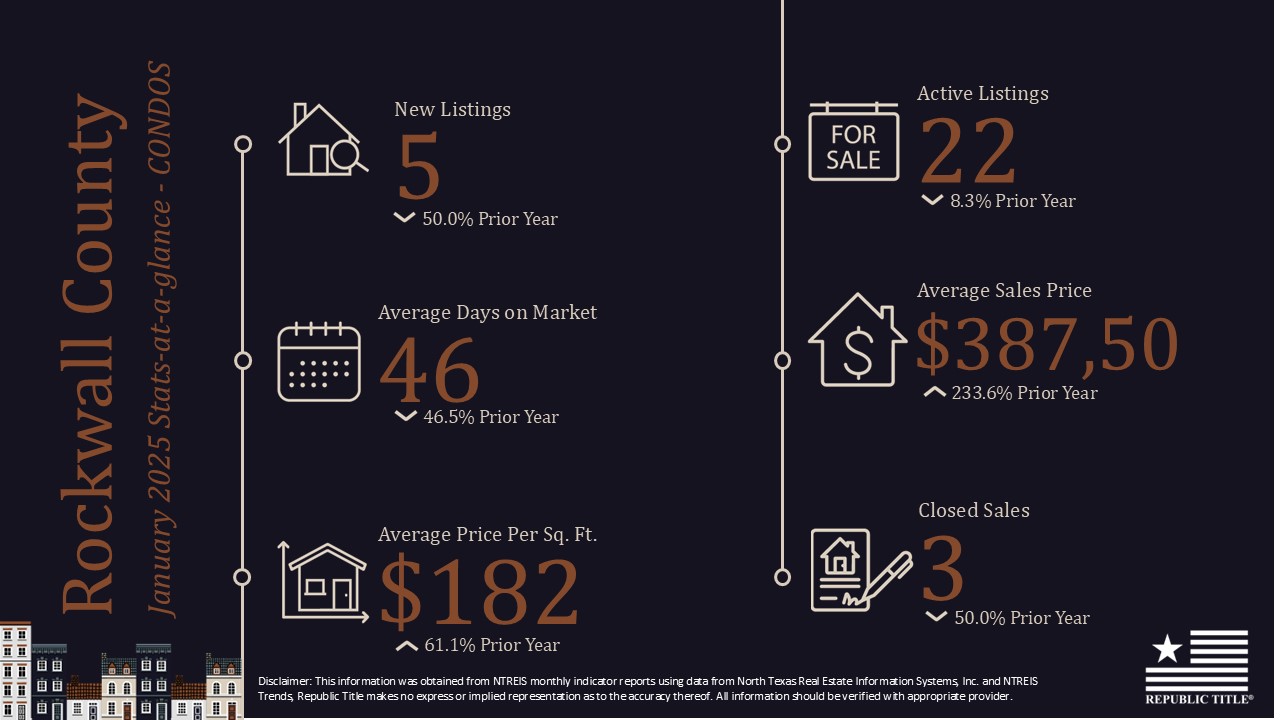
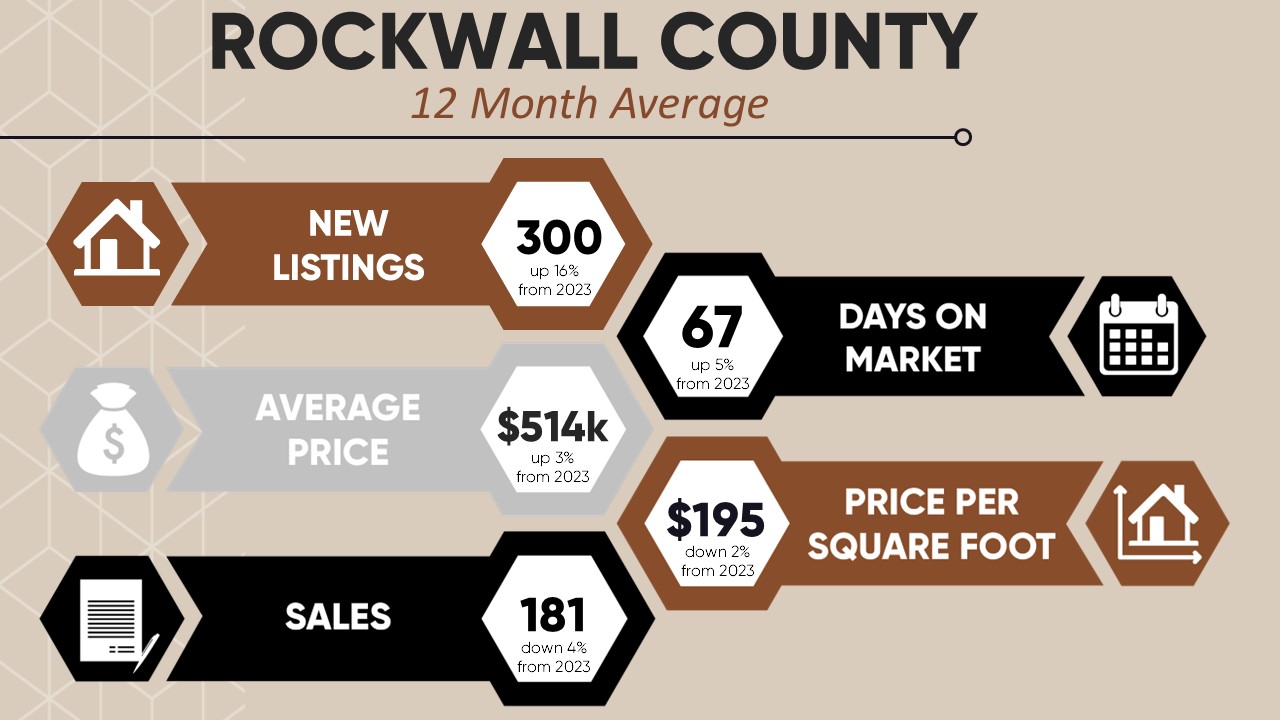
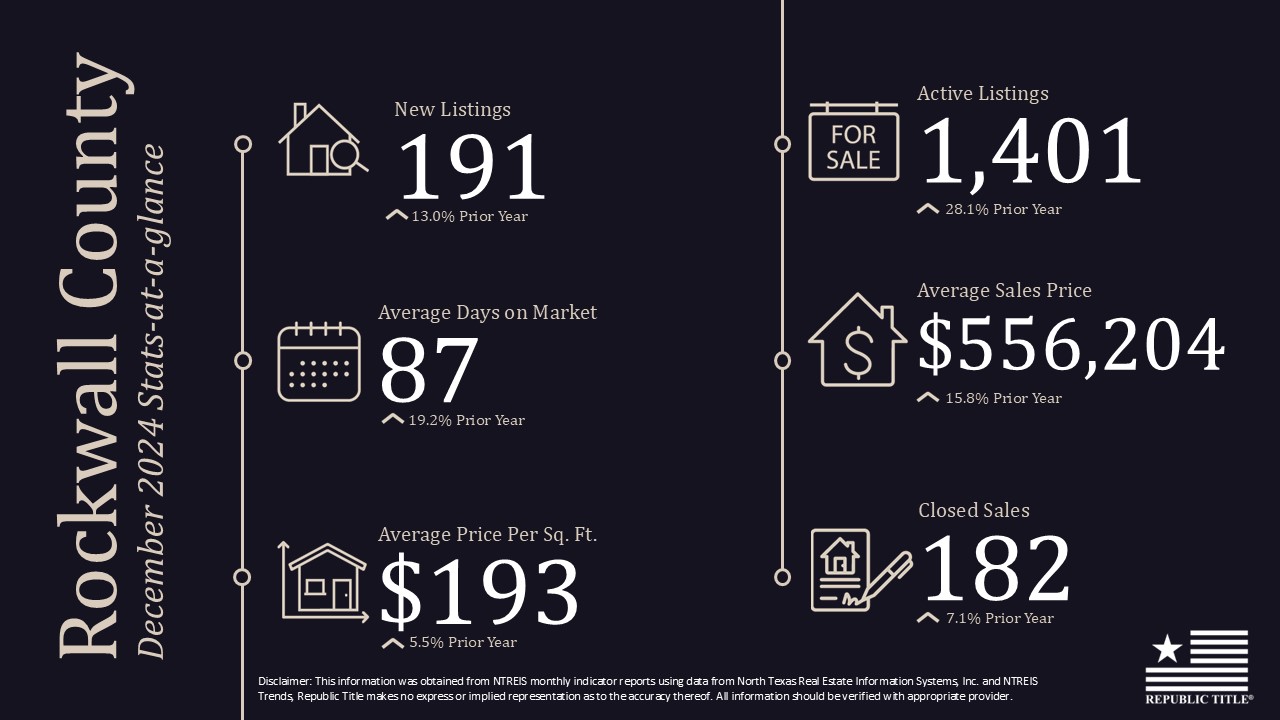
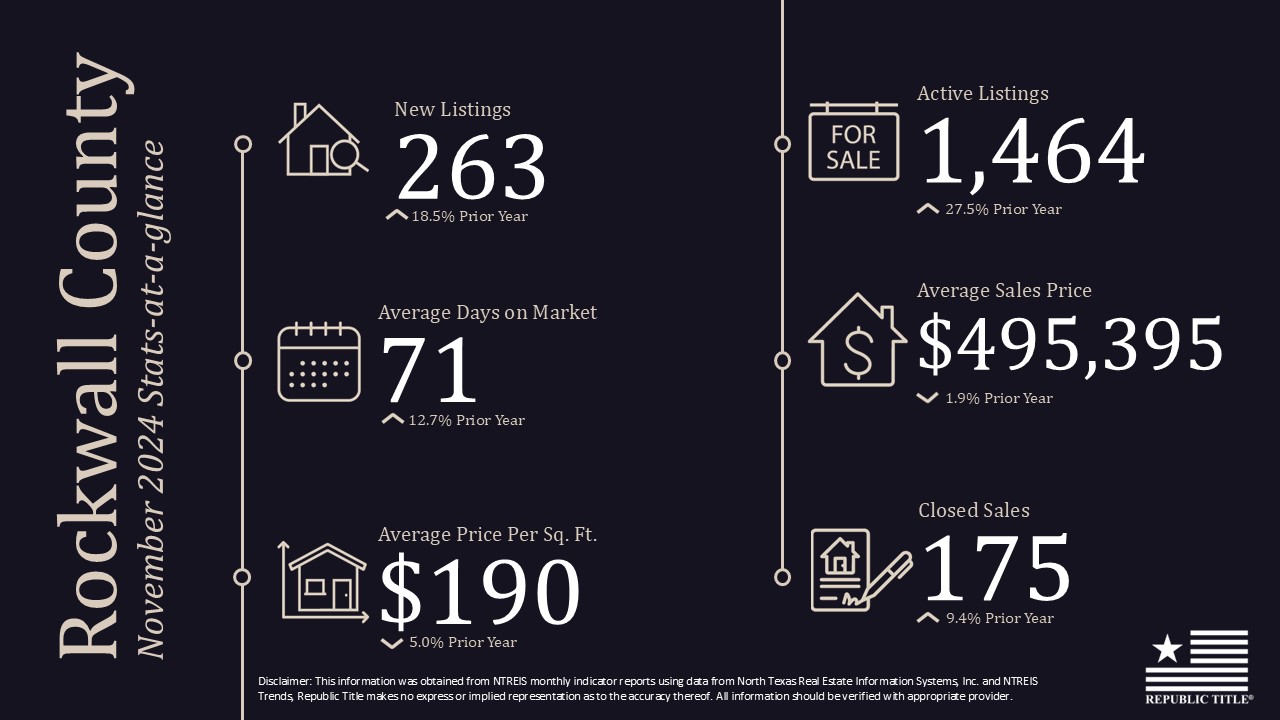
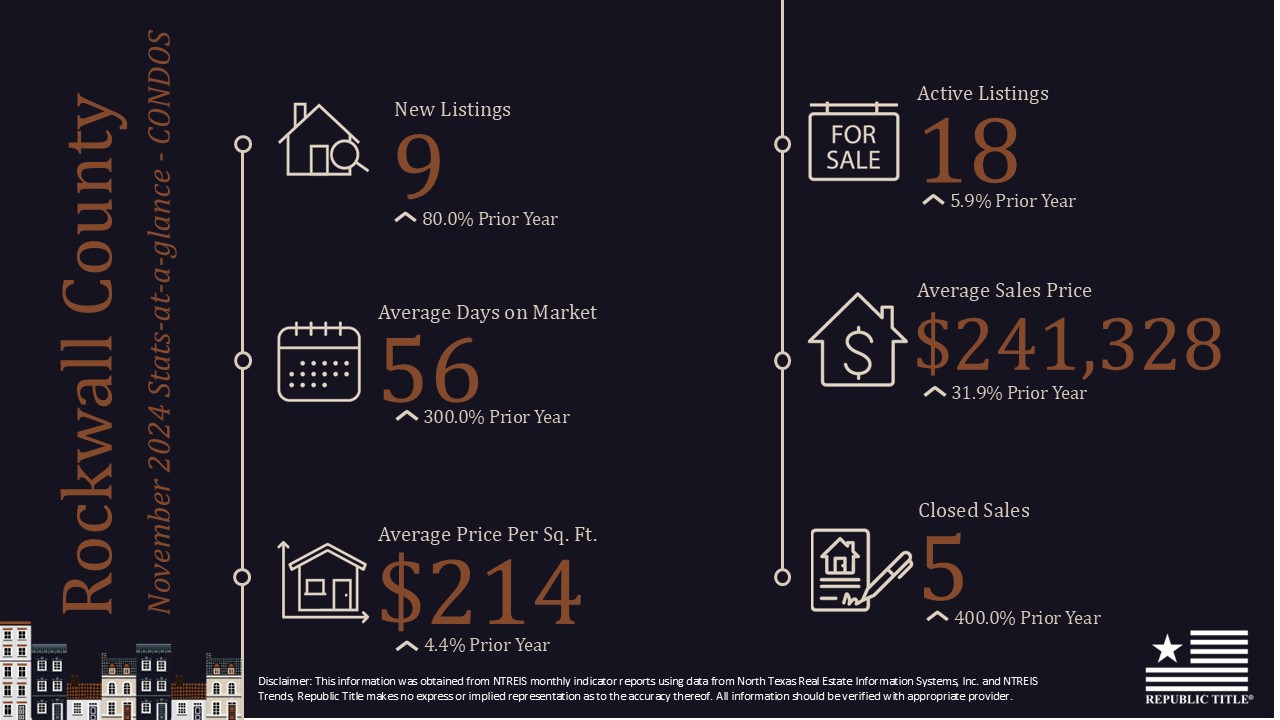
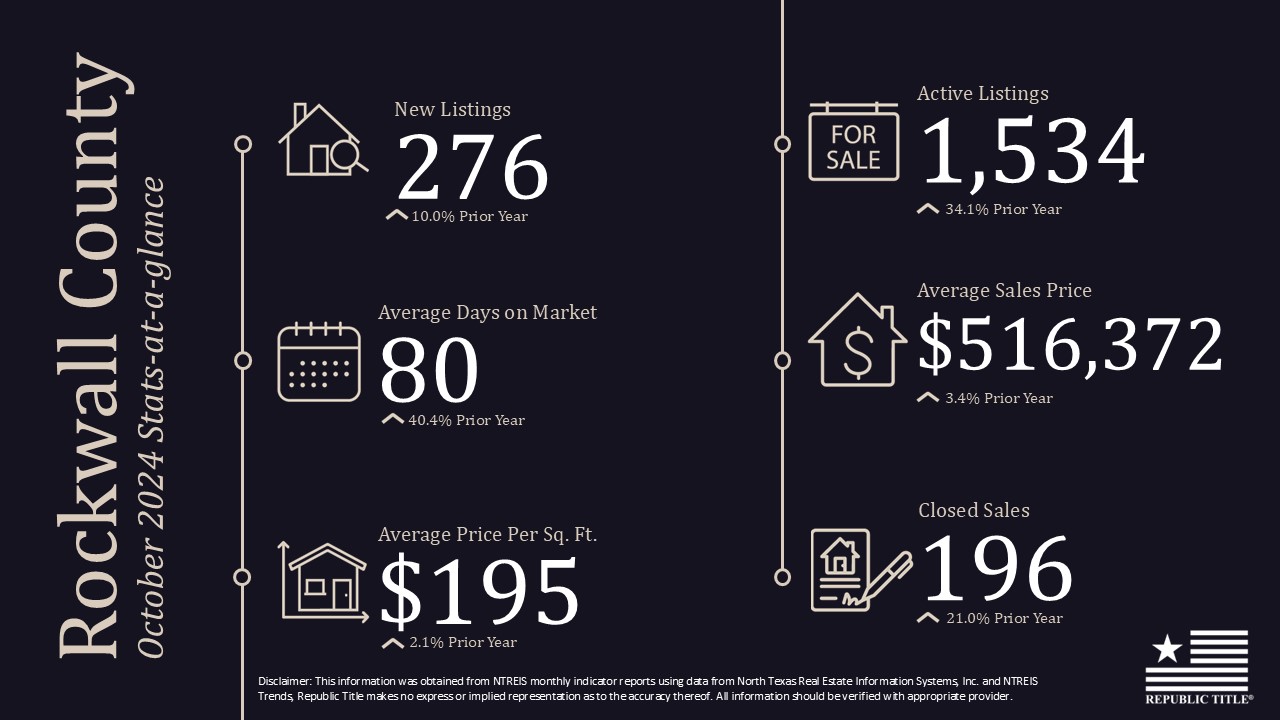
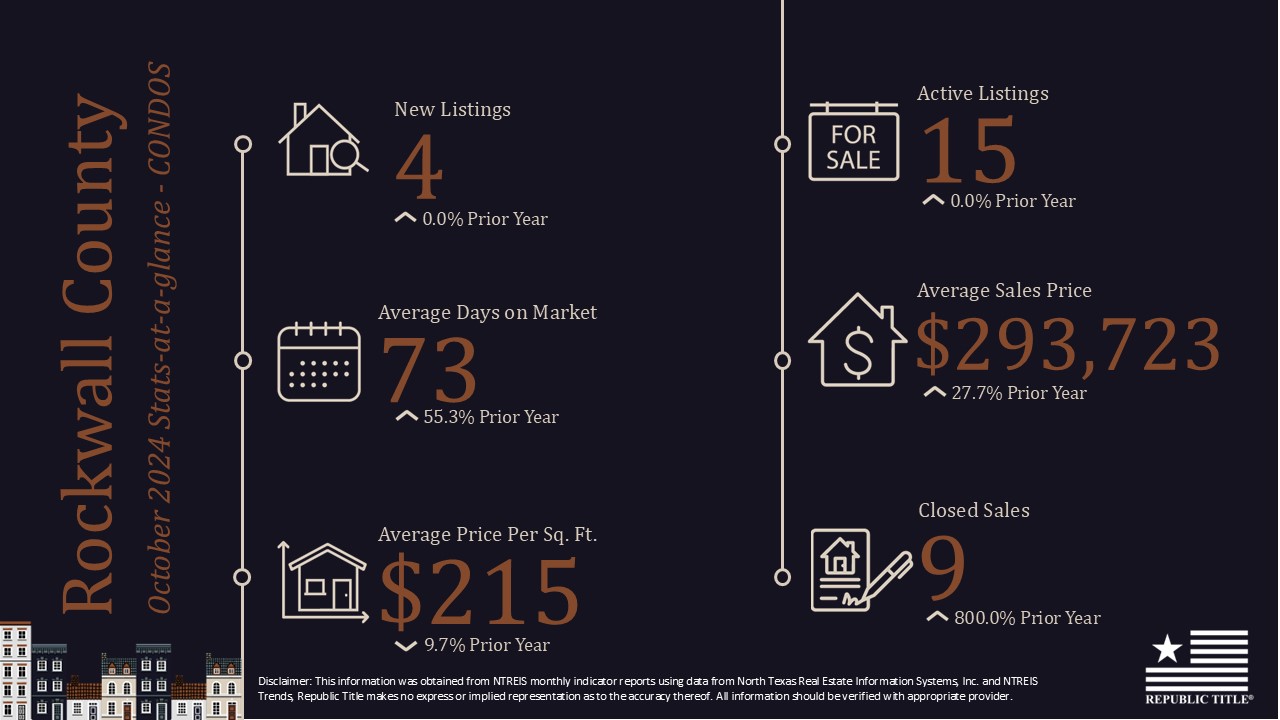
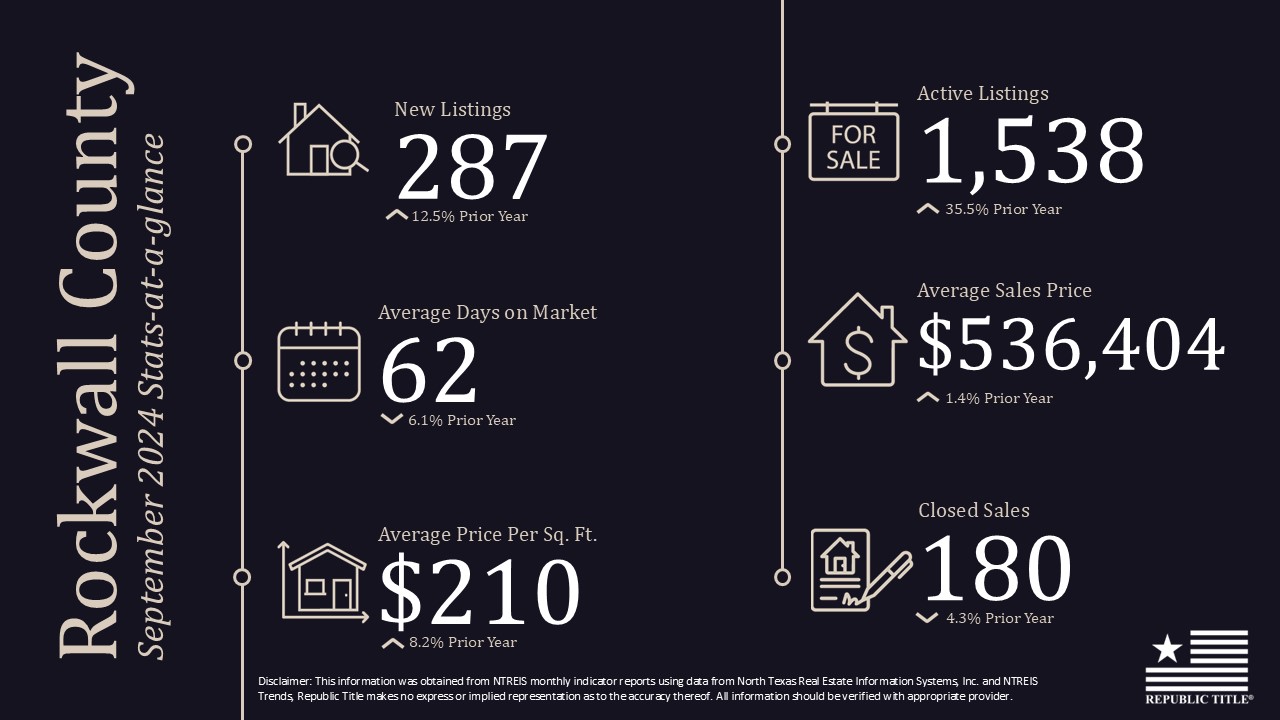
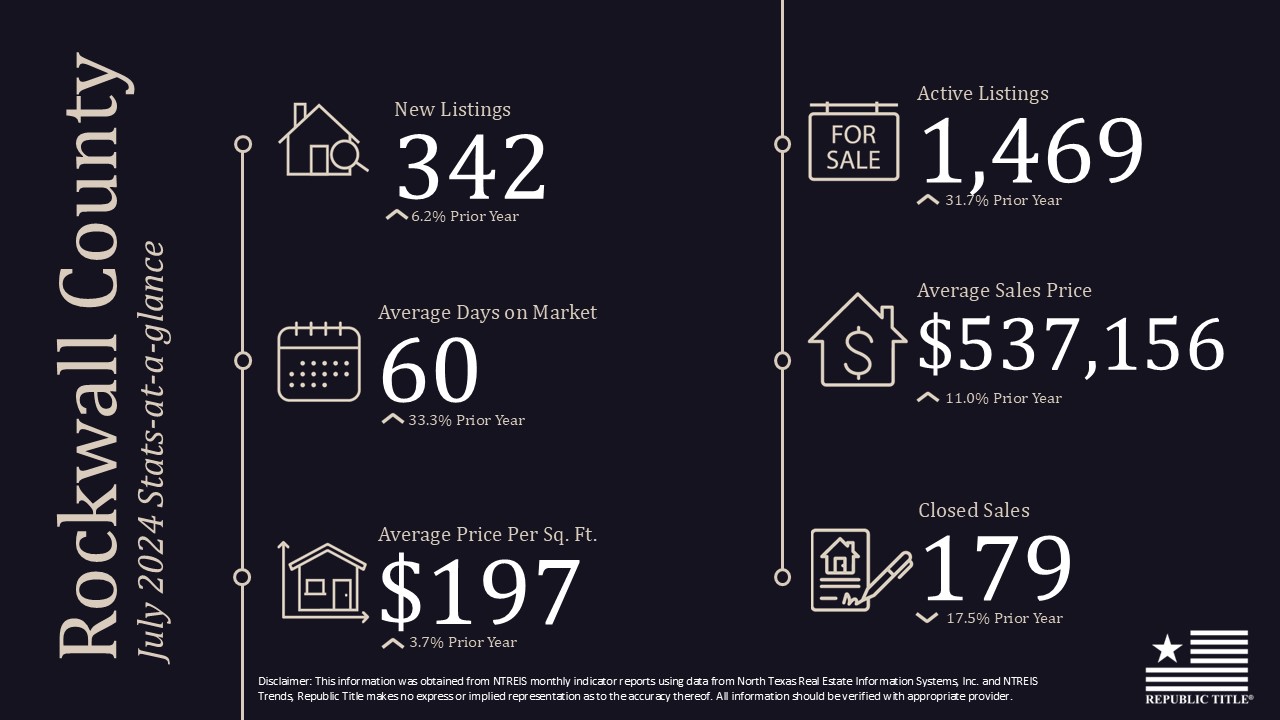
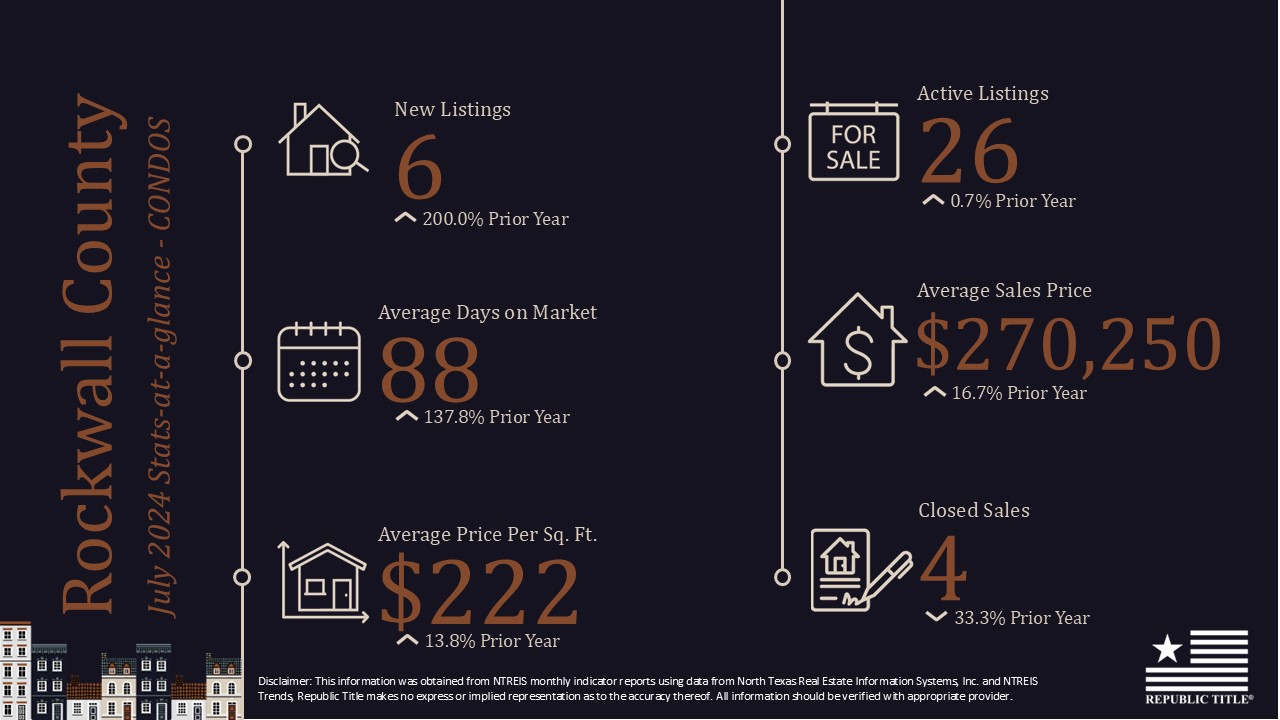
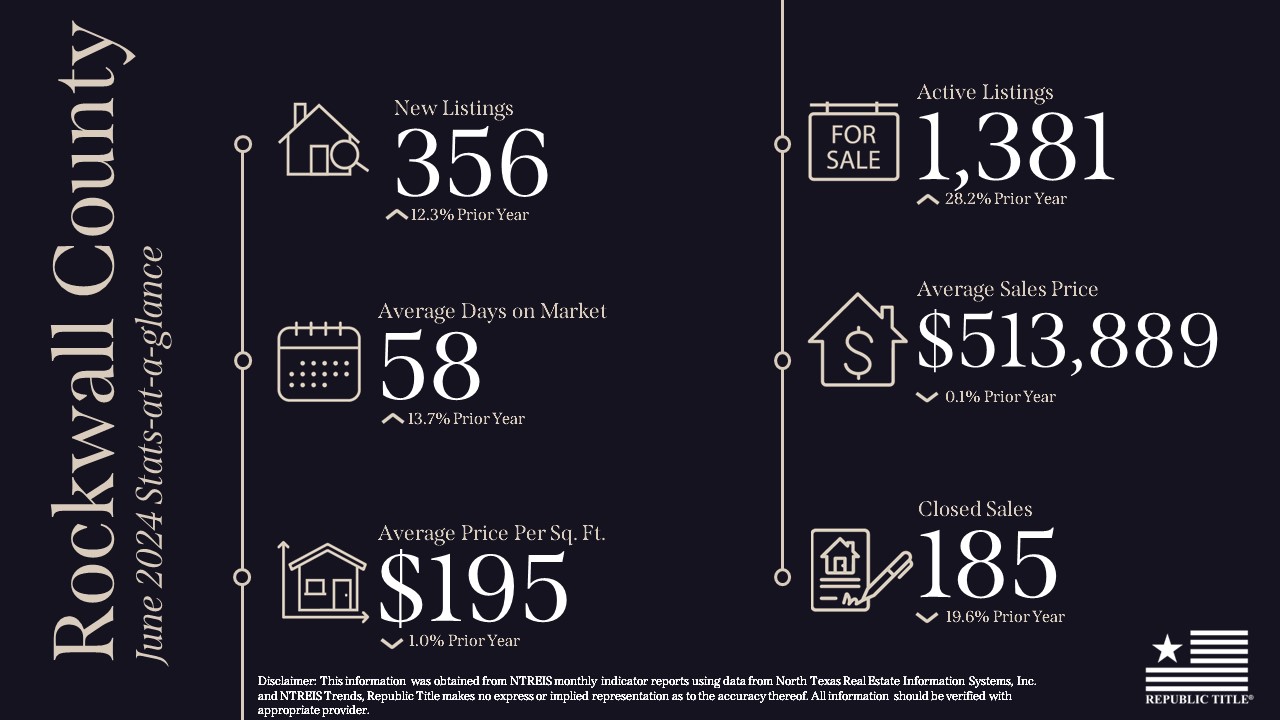
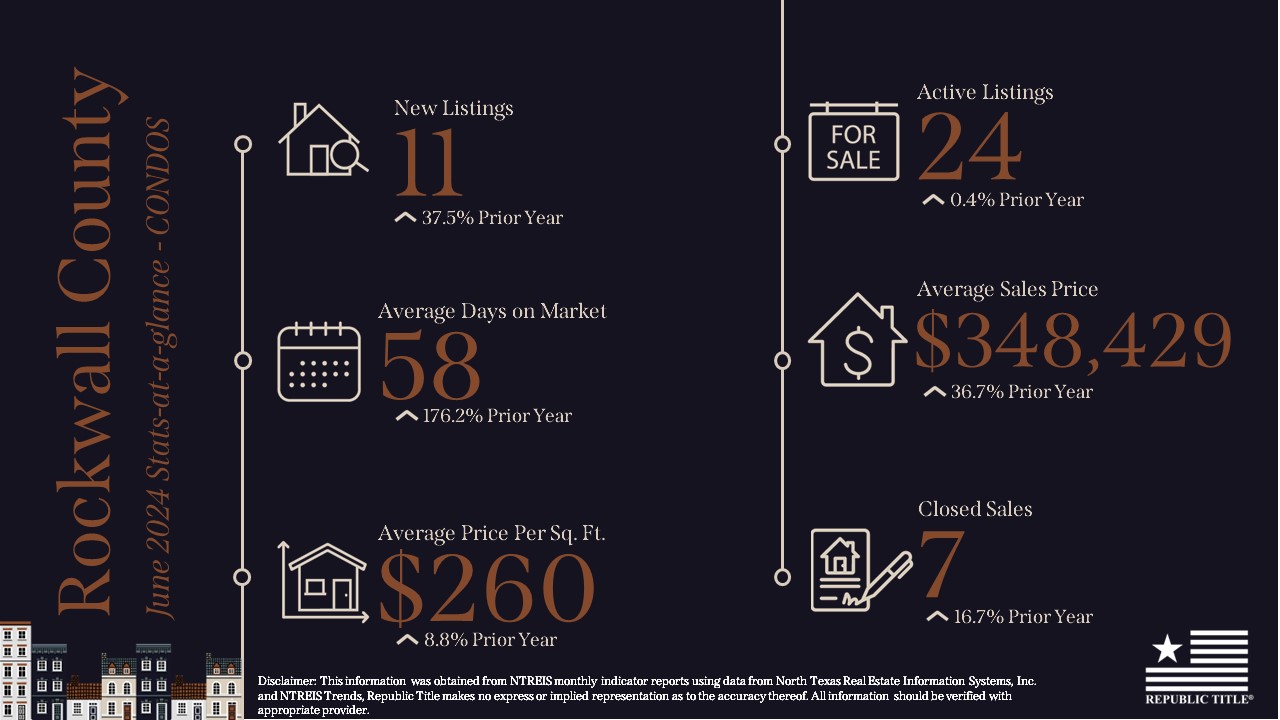
Rockwall County experienced a strong increase in both new listings (10%) and active listings (34.1%), with a 3.4% increase in the average sales price to $516,372. Closed sales rose by 21%.
In summary, the North Texas real estate market remained active in October 2024, with strong growth in new listings and active inventory across all counties. Historically, leading up to a presidential election, it’s common for real estate activity to slow slightly as buyers and sellers take a wait-and-see approach to economic uncertainties. As we finish up the final quarter of 2024, all eyes are on 2025, with expectations that the market will continue to evolve in response to both economic conditions and the shifting political landscape.
Our stats infographics include a year over year comparison and area highlights for single family homes broken down by county. We encourage you to share these infographics and video with your sphere.
For more stats information, pdfs and graphics of our stats including detailed information by county, visit the Resources section on our website at DFW Area Real Estate Statistics | Republic Title of Texas.
For the full report from the Texas A&M Real Estate Research Center and for NTREIS Local Market reports click here.