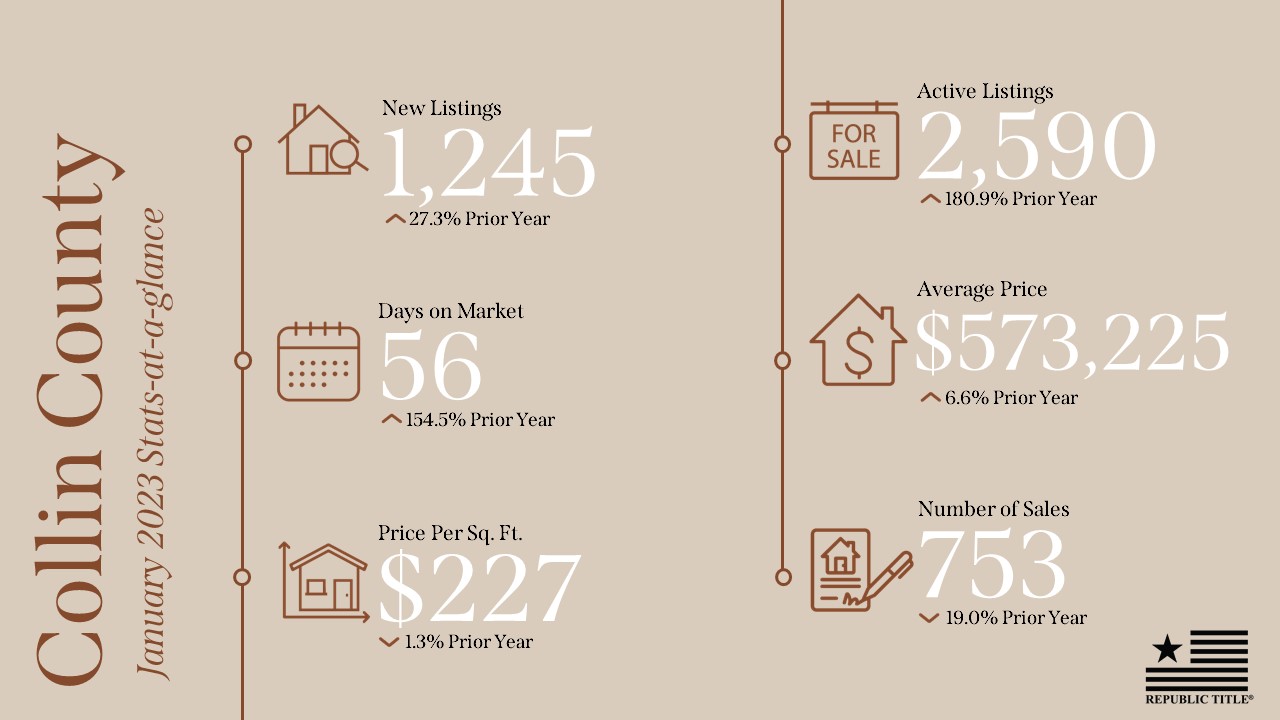
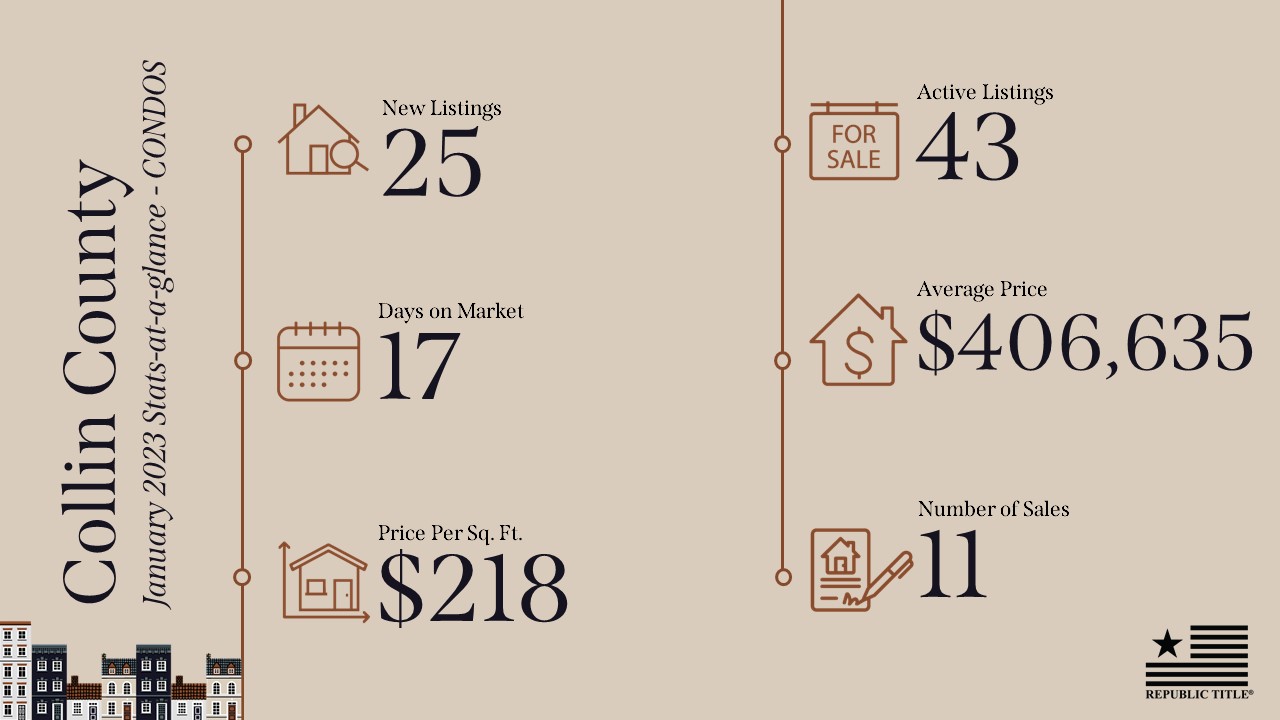
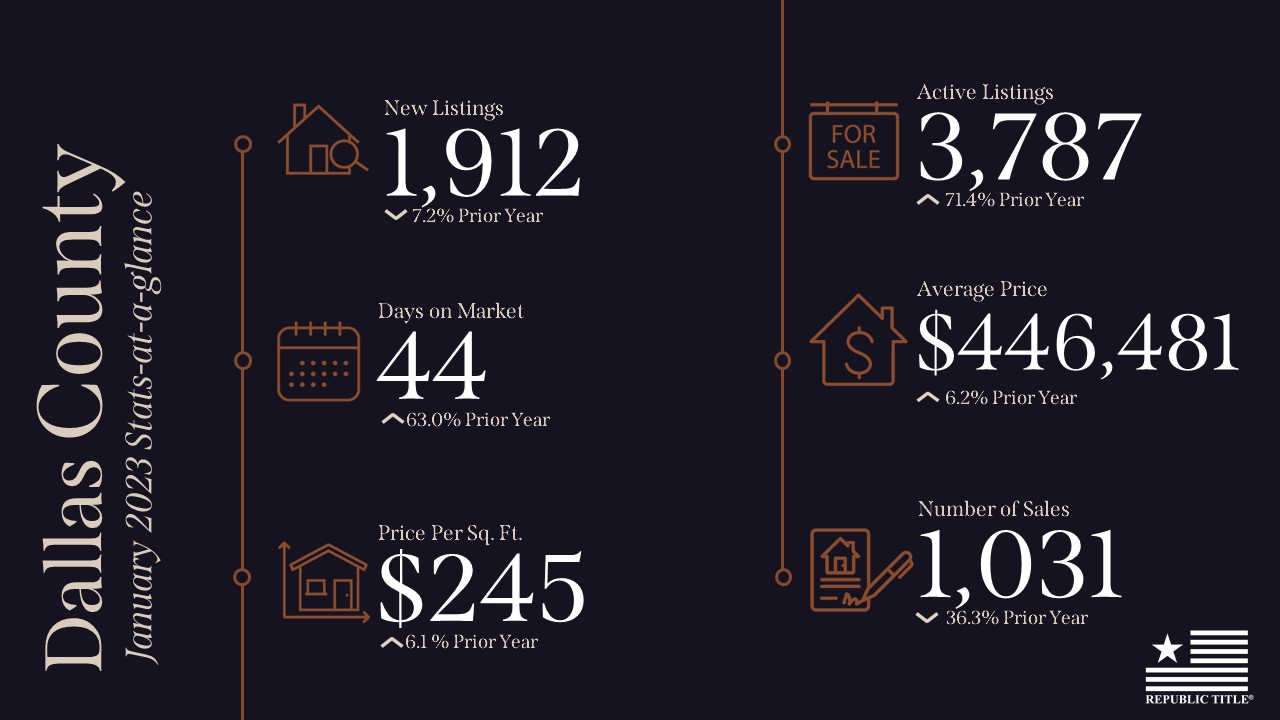
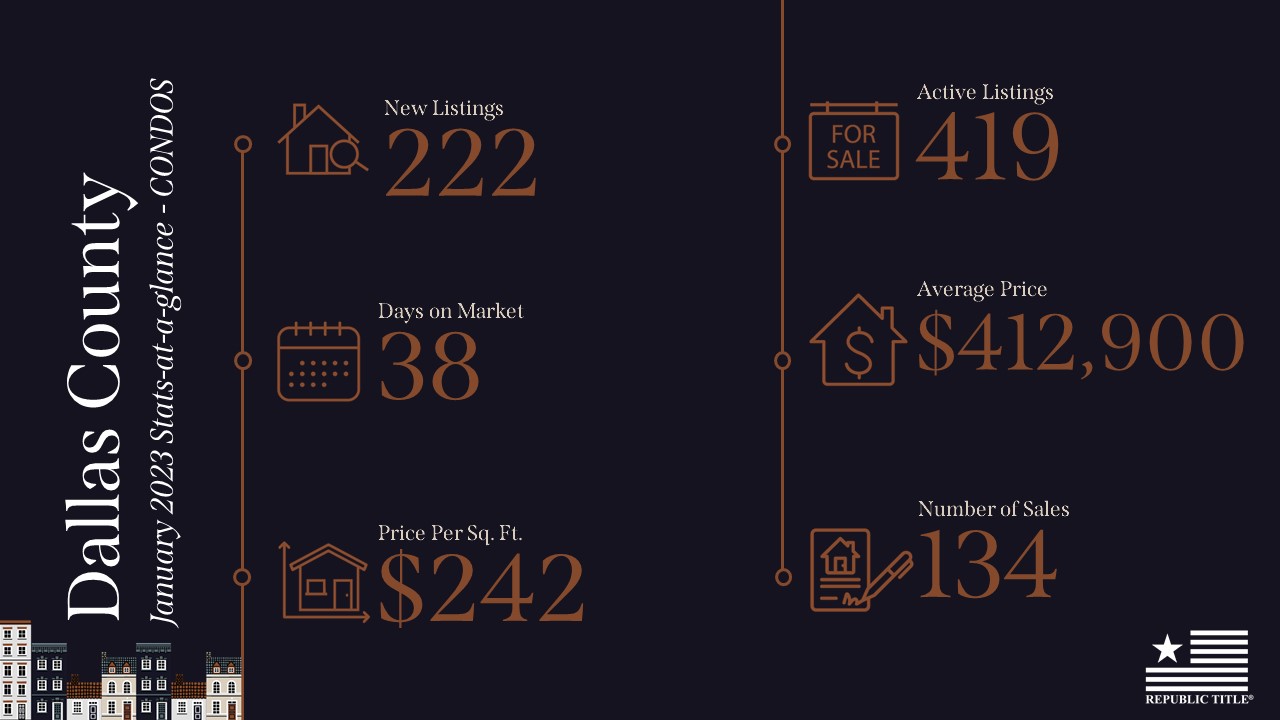
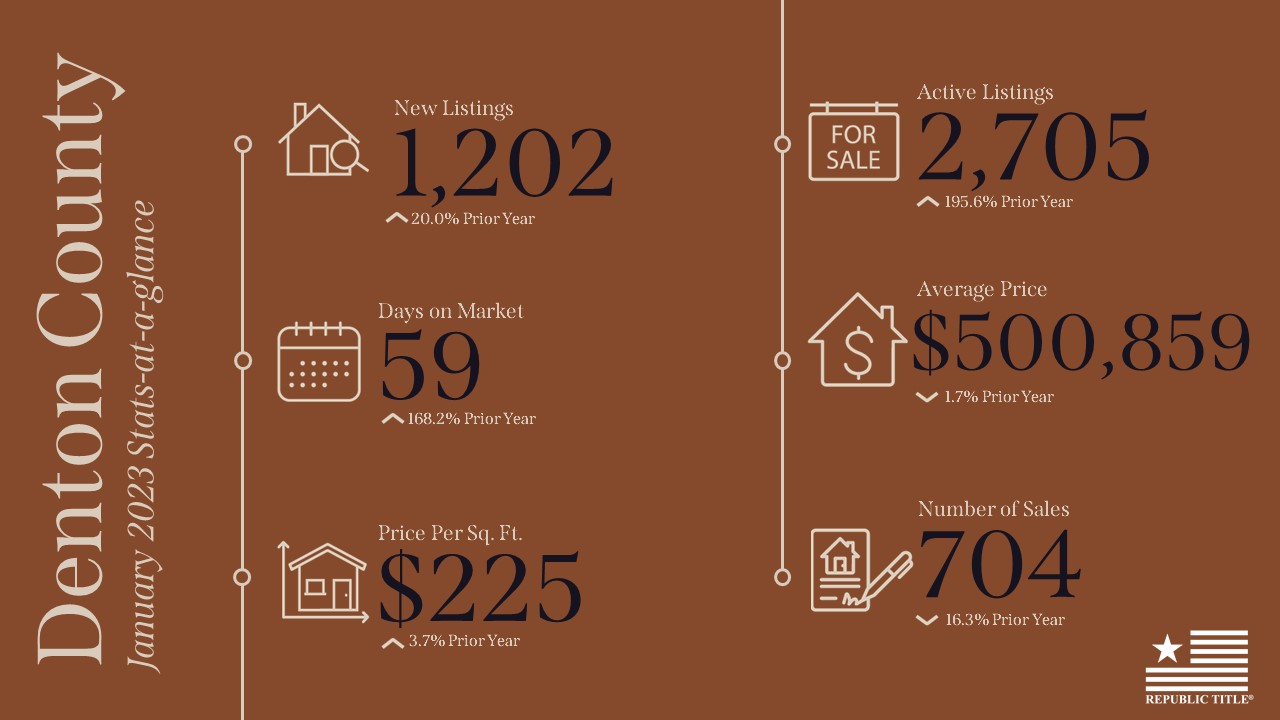
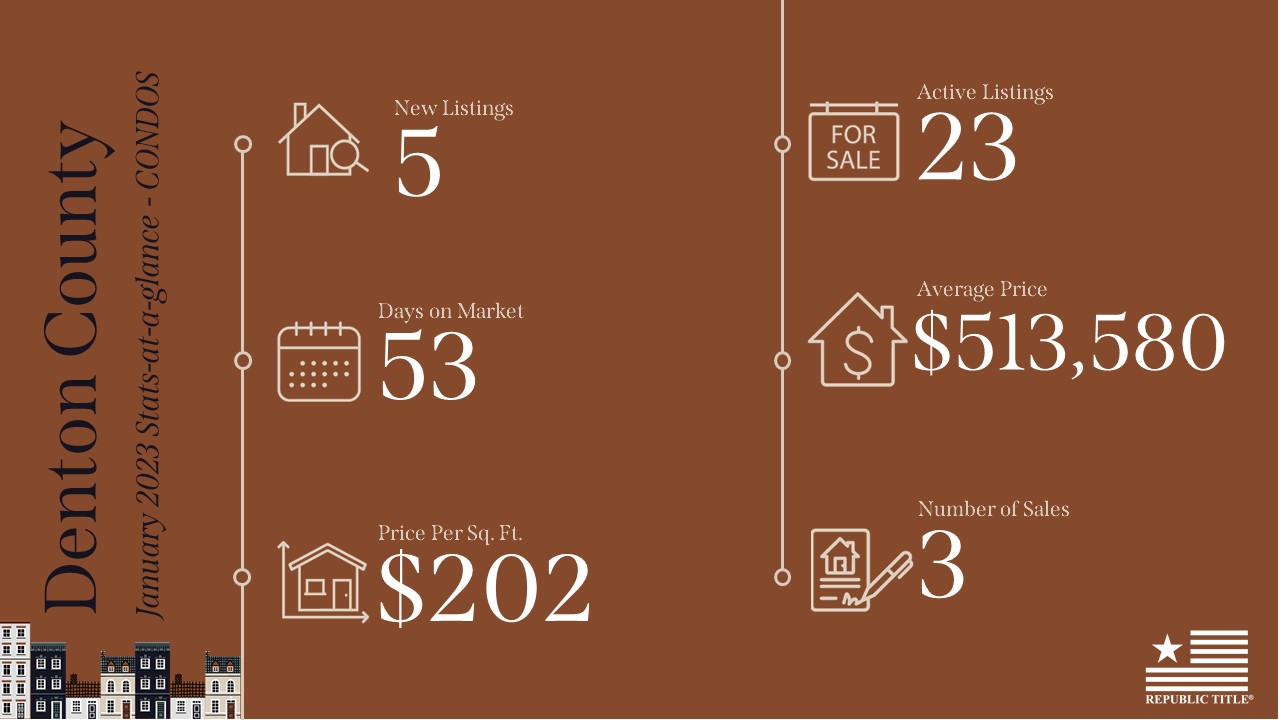
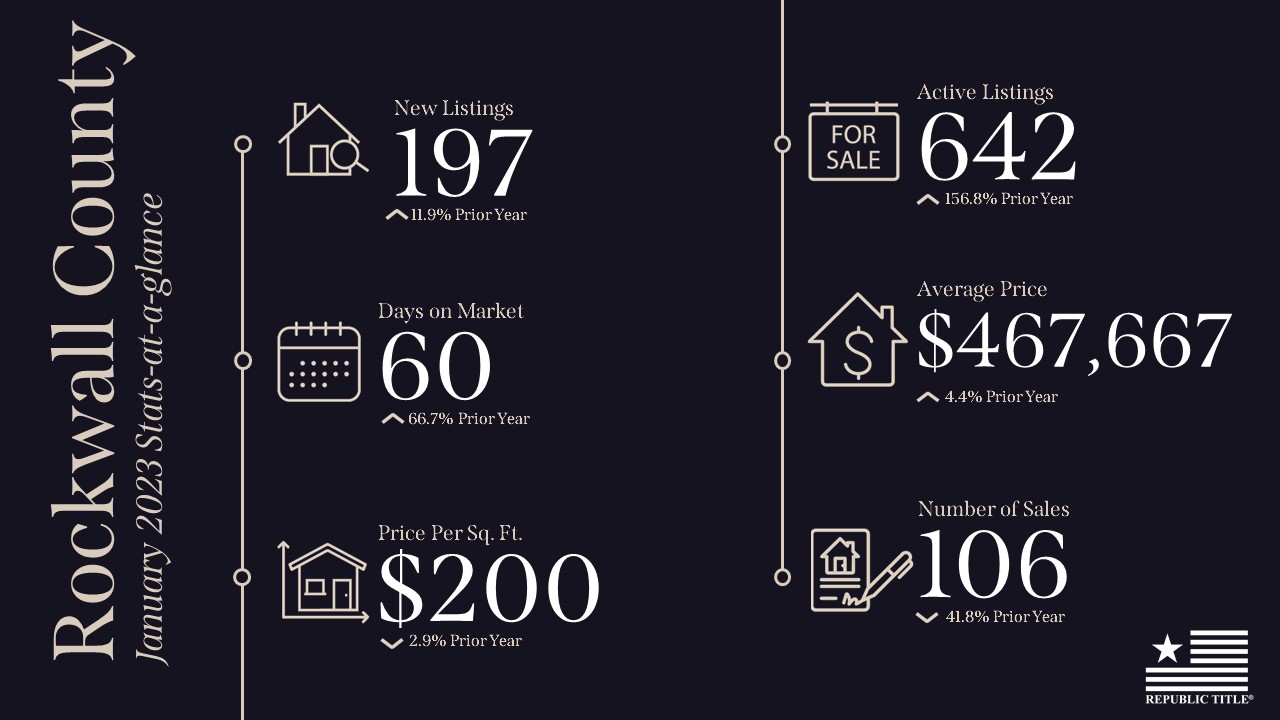
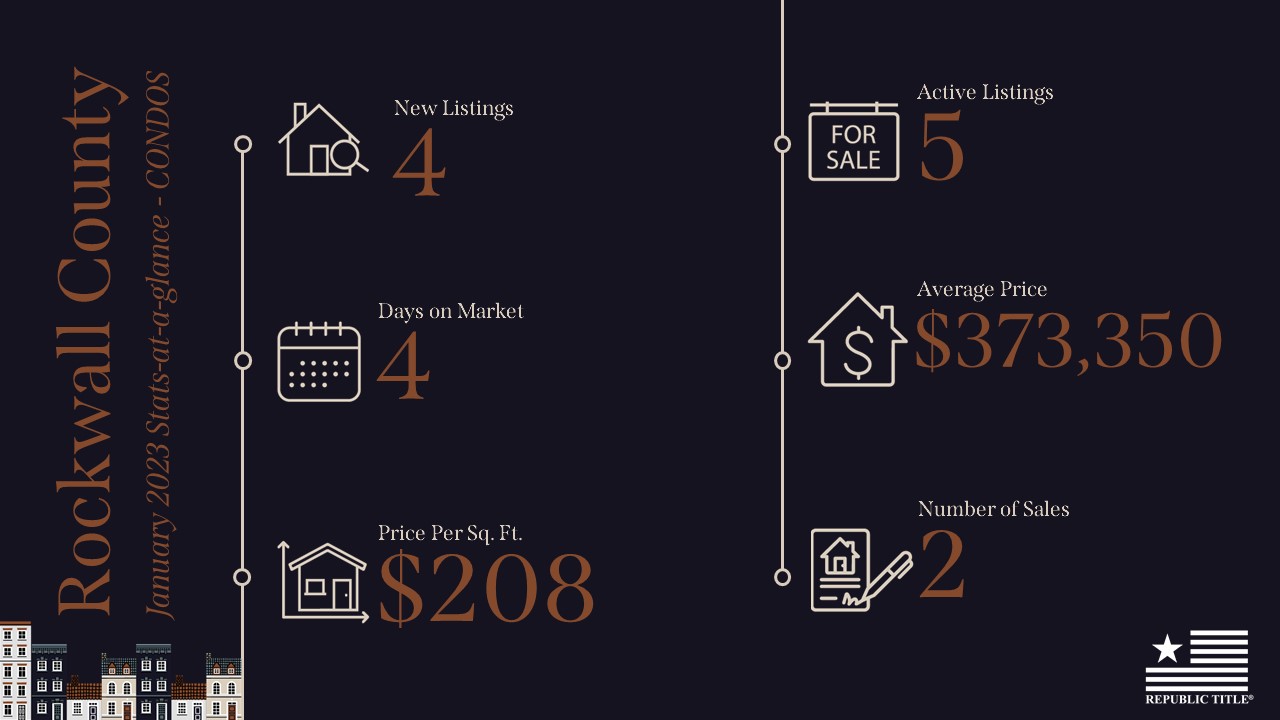
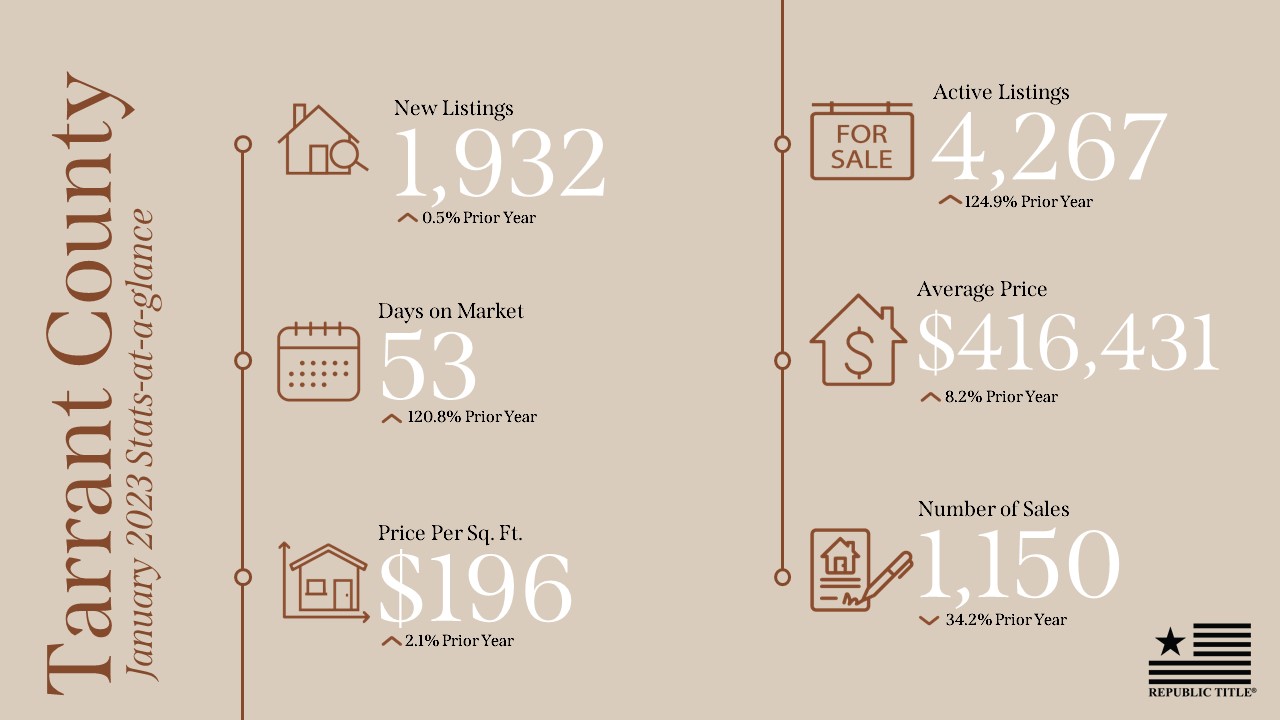
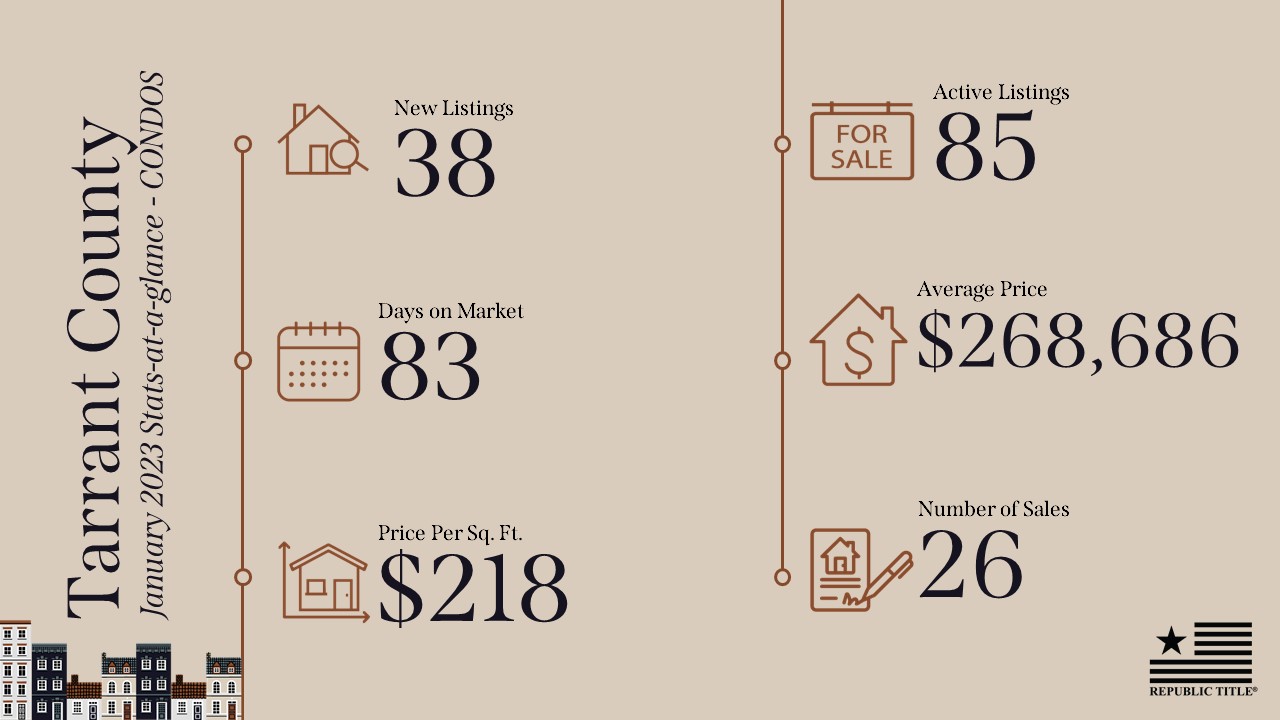
In January 2023, new listings are up in all North Texas counties that we report on over December 2022 so the much-needed inventory is coming to market.
Active listings are up across the board compared to this time last year ranging from 71% increase in Dallas County to 195% increase in Denton County. Compared to January 2022, average sales price has increased in each county except Denton which was down slightly.
Dallas is expected to be the top buyer’s market in the nation by year-end 2023 so all eyes are on the Spring selling season!
Our stats infographics include a year over year comparison and area highlights for single family homes broken down by county. We encourage you to share these infographics and video with your sphere.
Our second annual stats report of the DFW real estate market is here!
We’ve taken our monthly stats-at-a-glance reports from January through December of 2022, totaled, averaged, and compared the data to the numbers from 2021. The result is an annual report of the DFW real estate market in 2022.
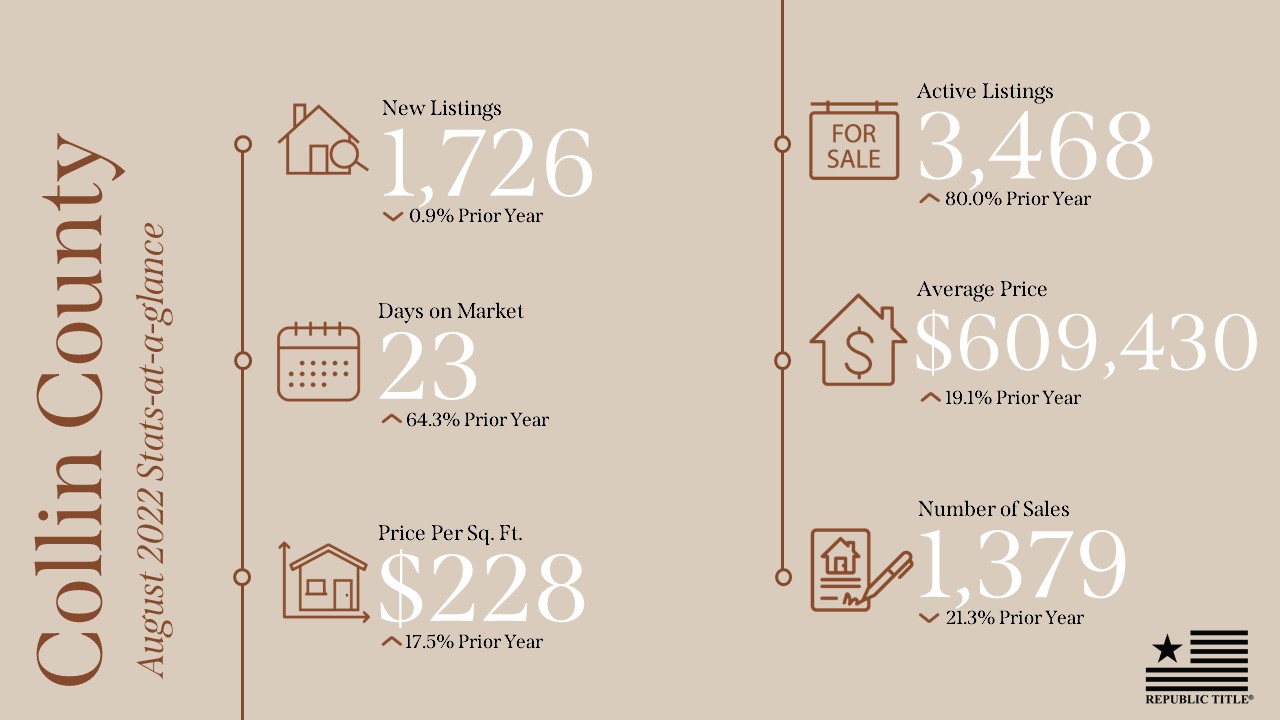
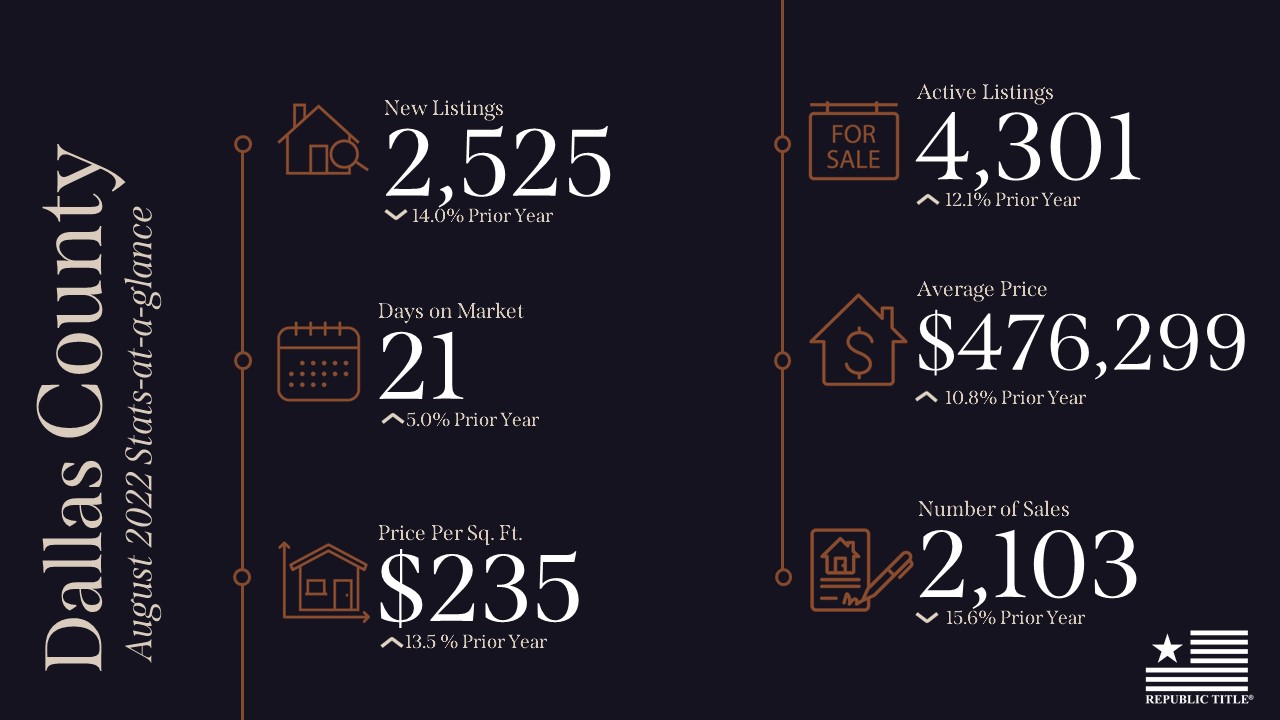
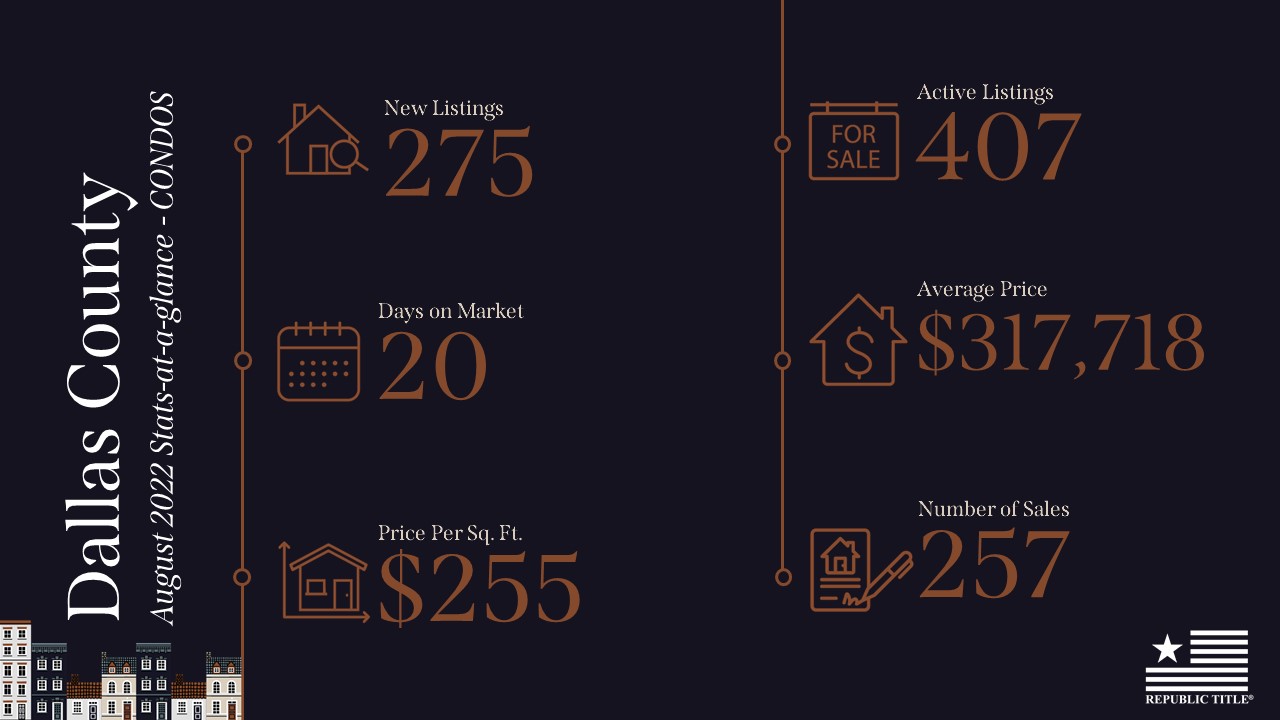
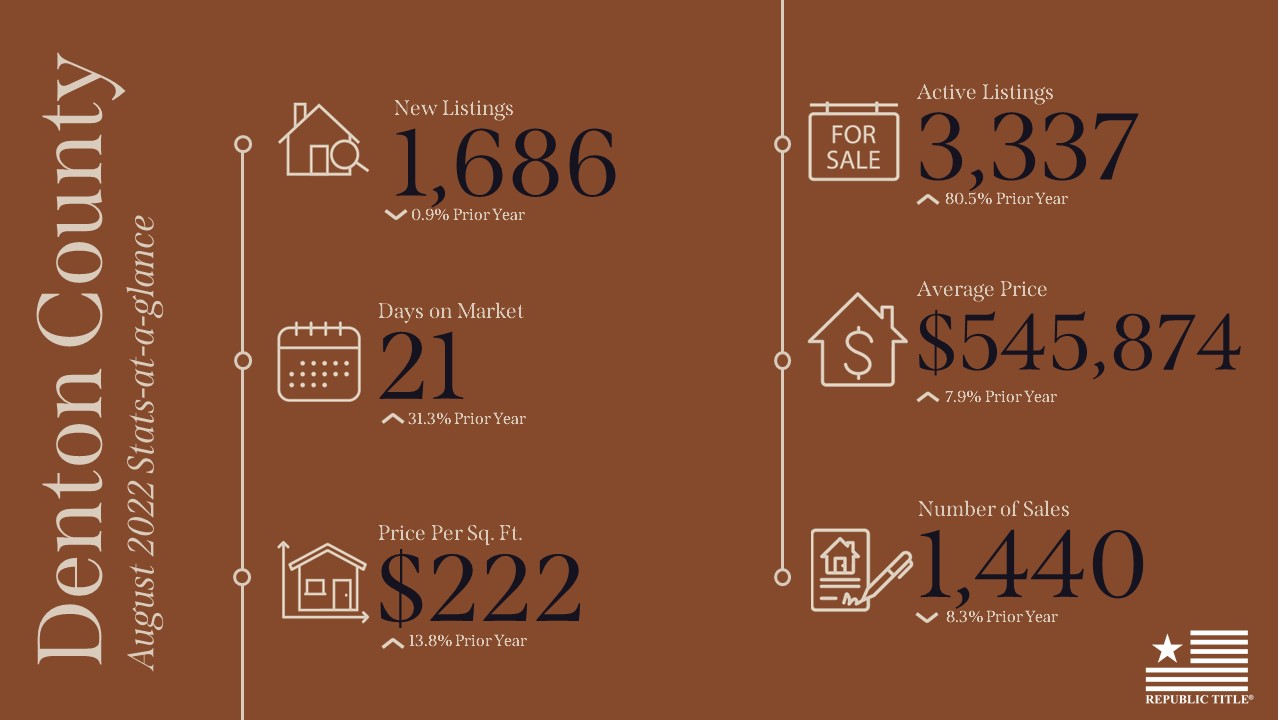
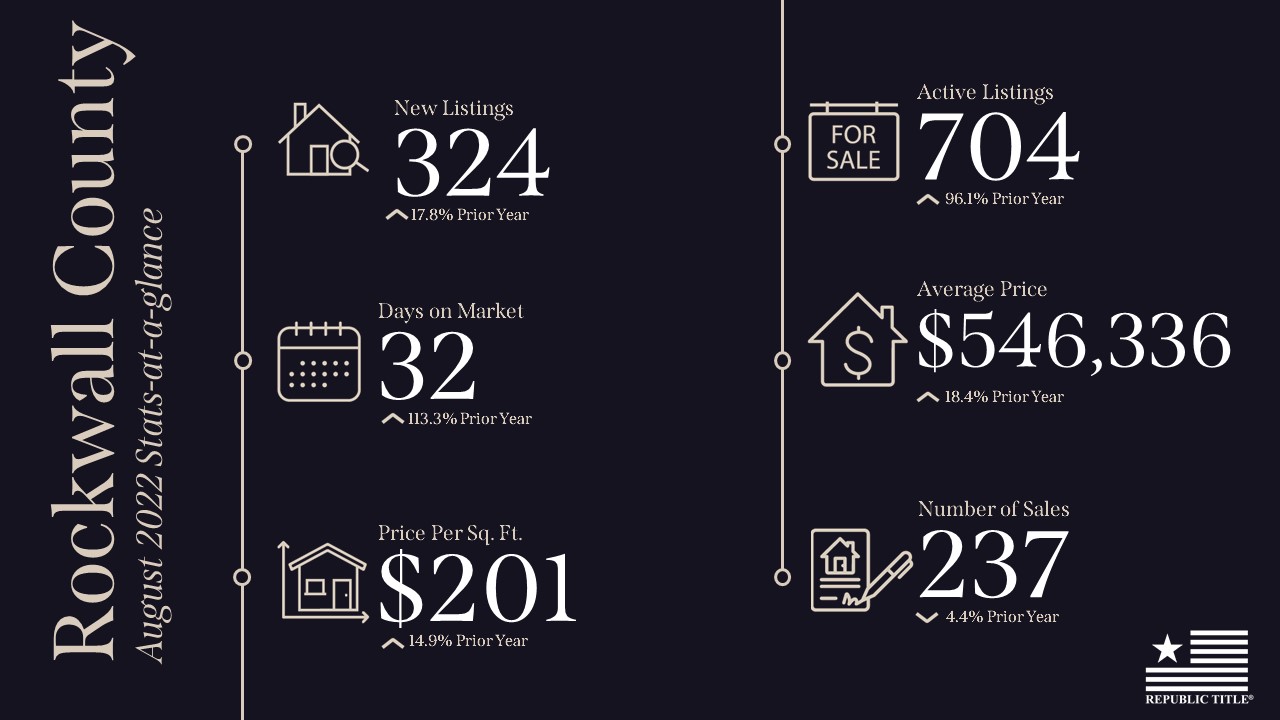
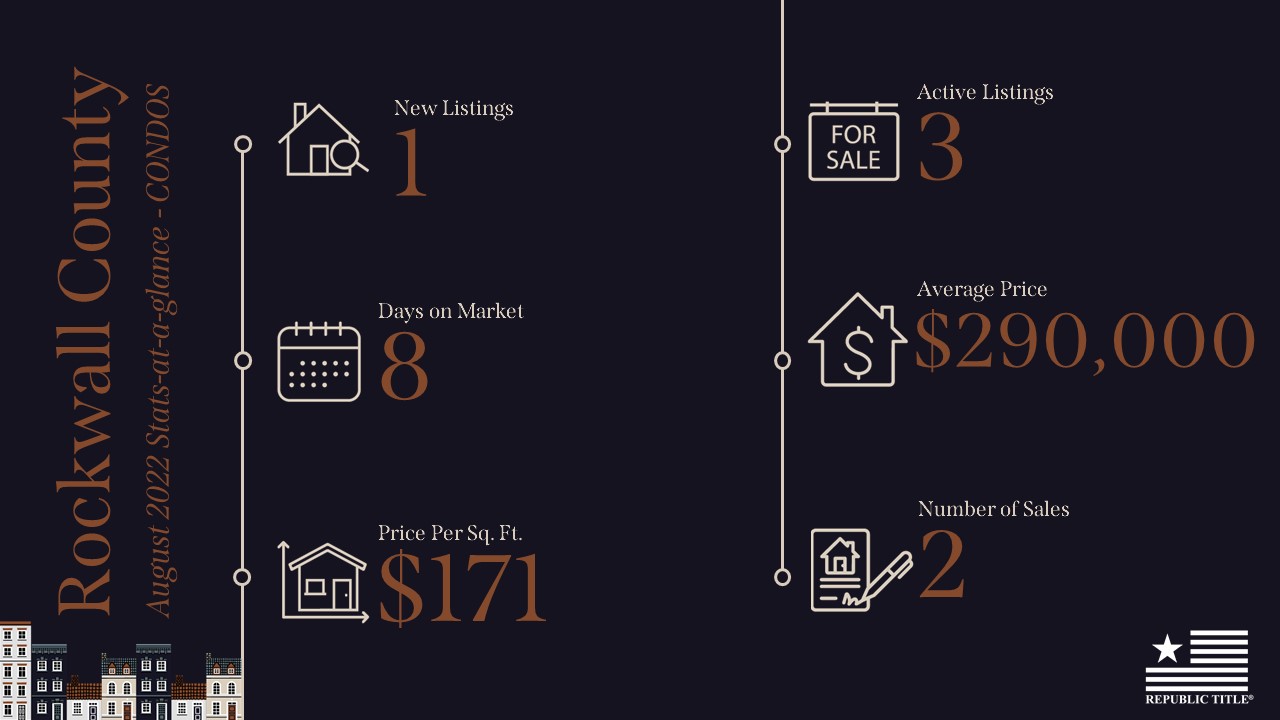
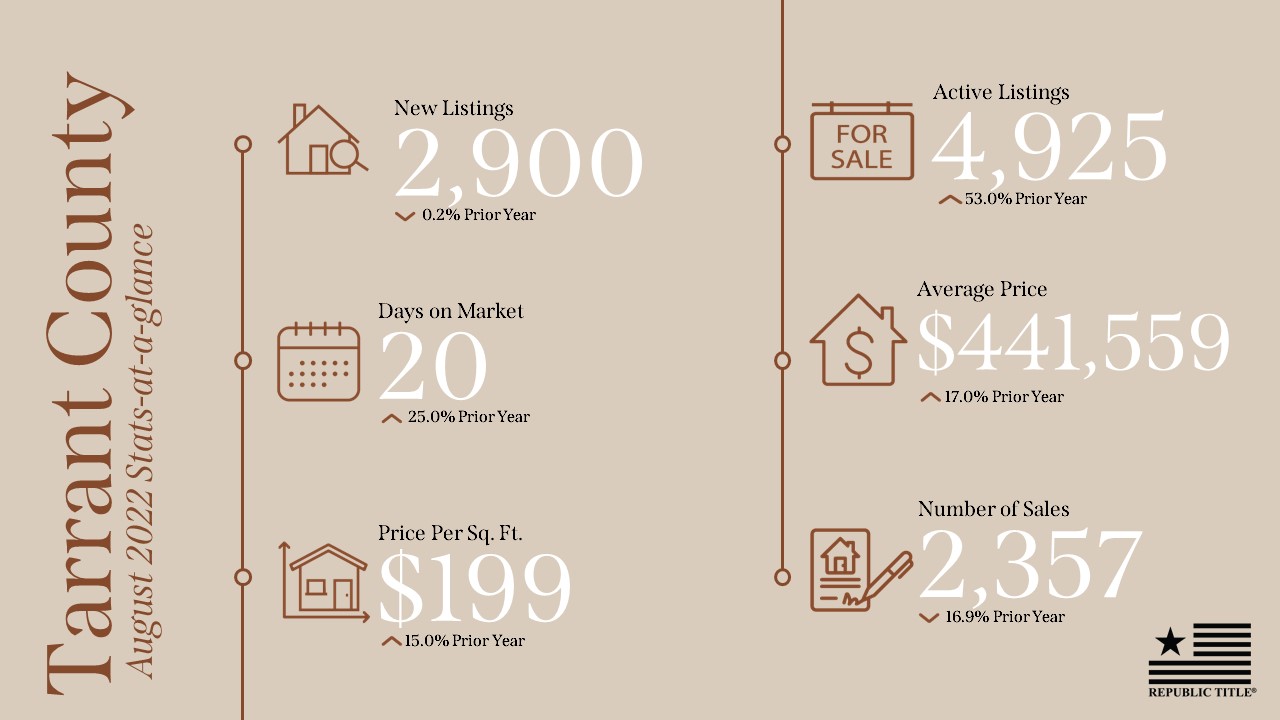
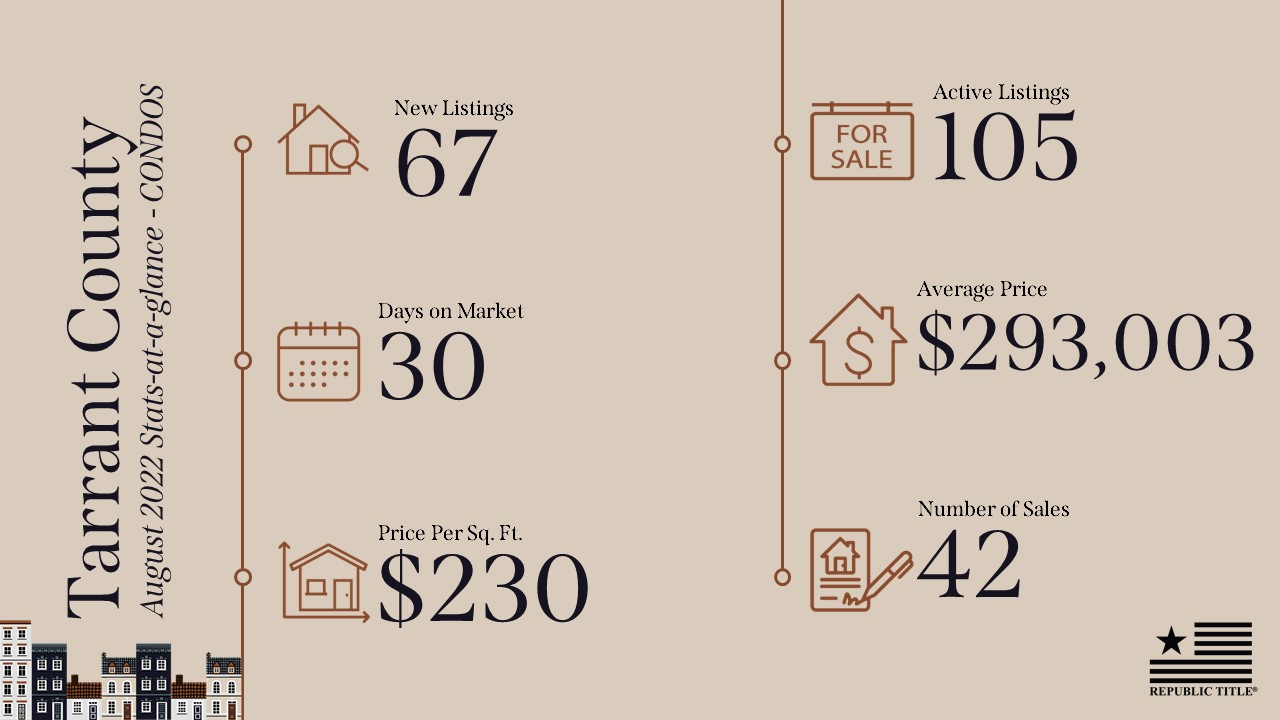
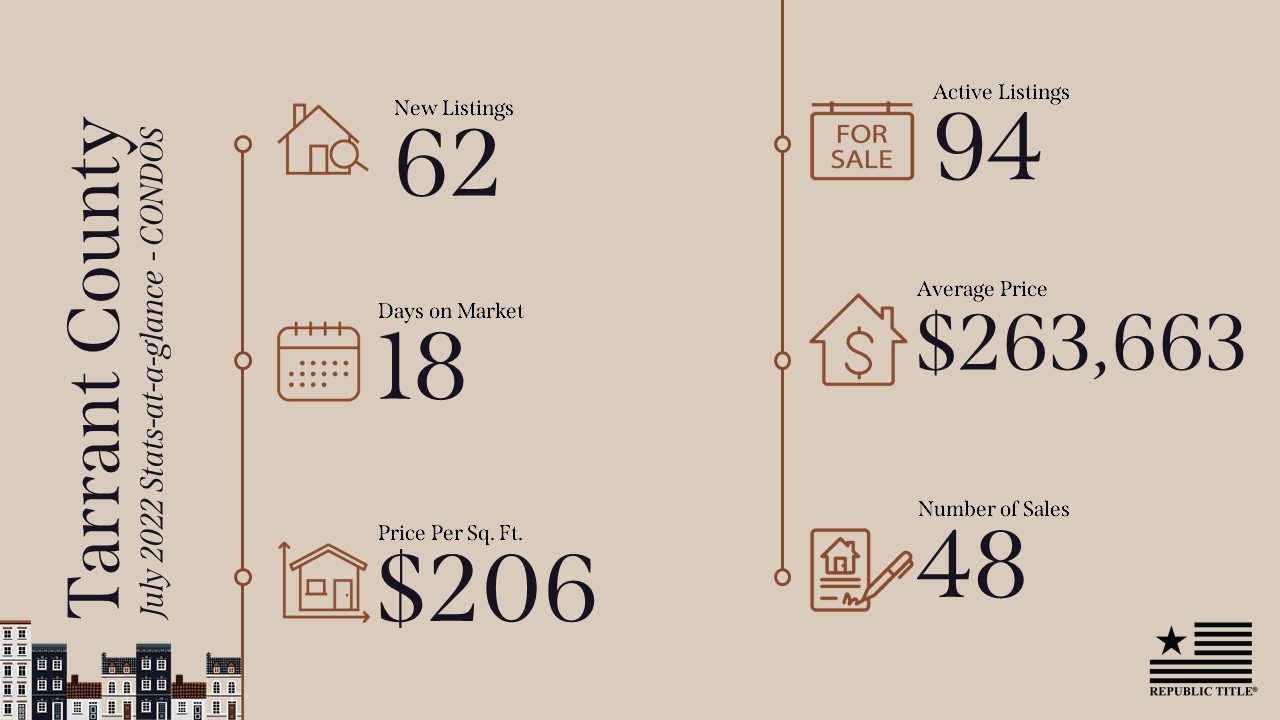
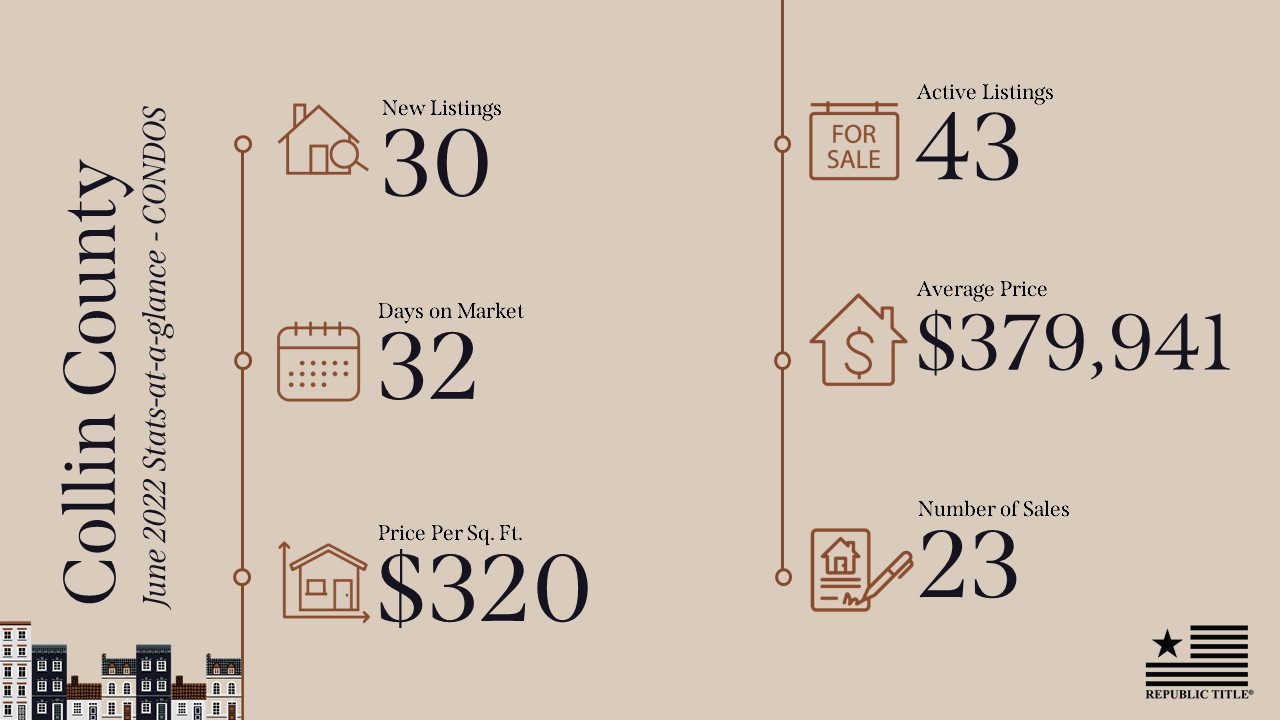
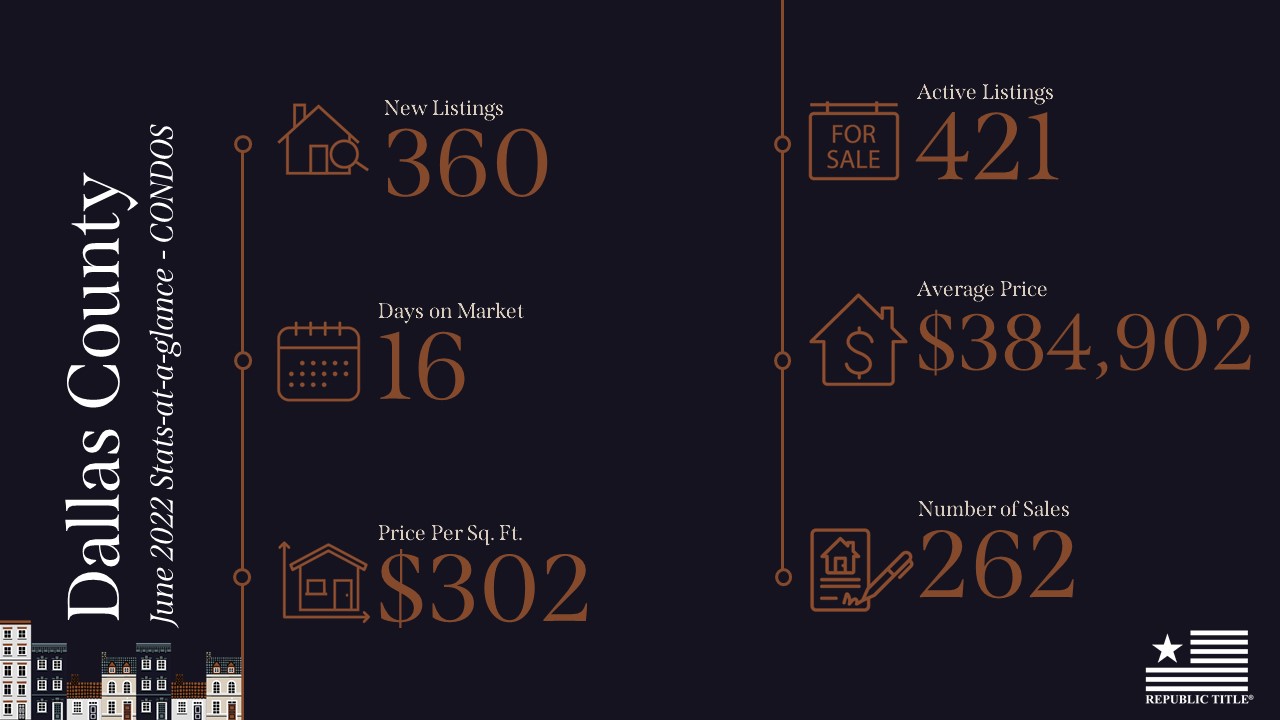
August 2022 Stats are IN! Here are the highlights! In Collin County New listings are slightly down, while Active listings are up quite a bit from last year. The days on market, average sales price and price per square foot are also up as we are all aware, with the actual number of sales down about 21% from 2021. In Dallas County, the new listings are also down slightly with Active listings up with similar percentages to Collin County. The days on market, average sales price and price per square foot are also up in Dallas with the number of sales down about 15% from last year. The statistics are about the same in Denton and Rockwall counites as you can see. In summary, while the market is definitely slower than 2021, we are still experiencing a shortage of homes for sale in the entire metroplex which makes it a great time be in the business in North Texas! Happy sharing and selling!
Our stats infographics include a year over year comparison and area highlights for single family homes broken down by county. We encourage you to share these infographics and video with your sphere.
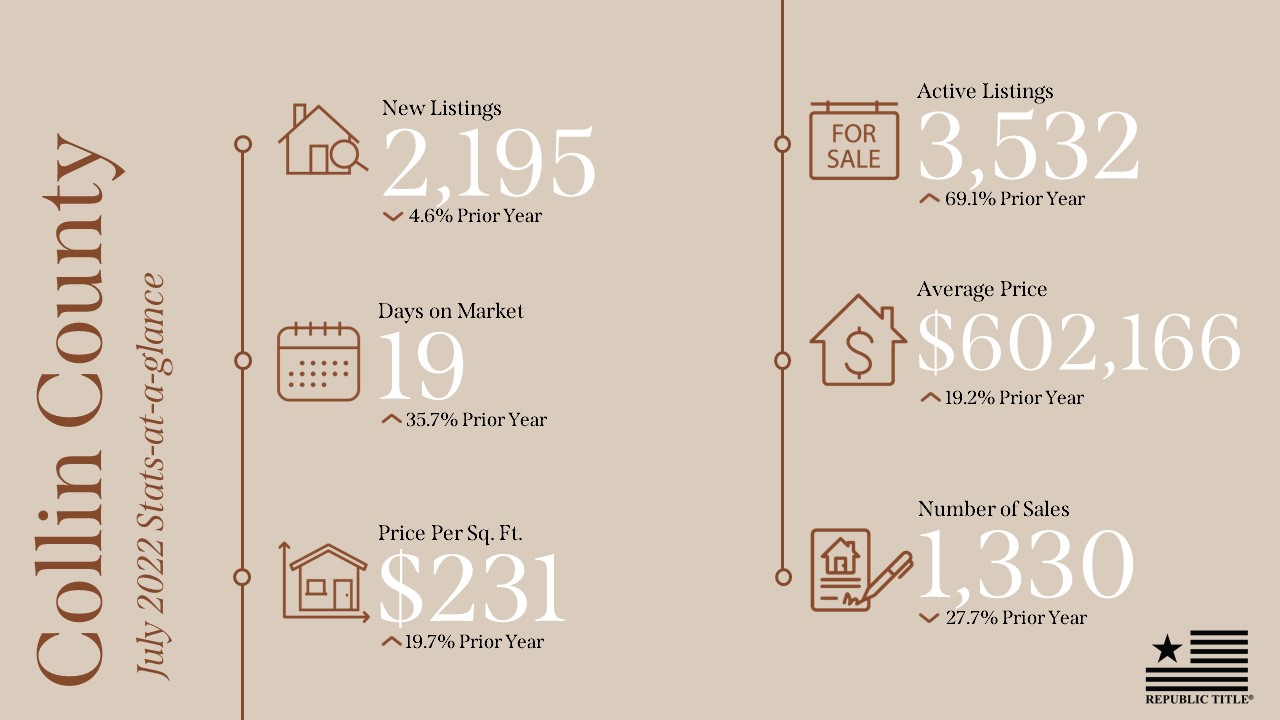
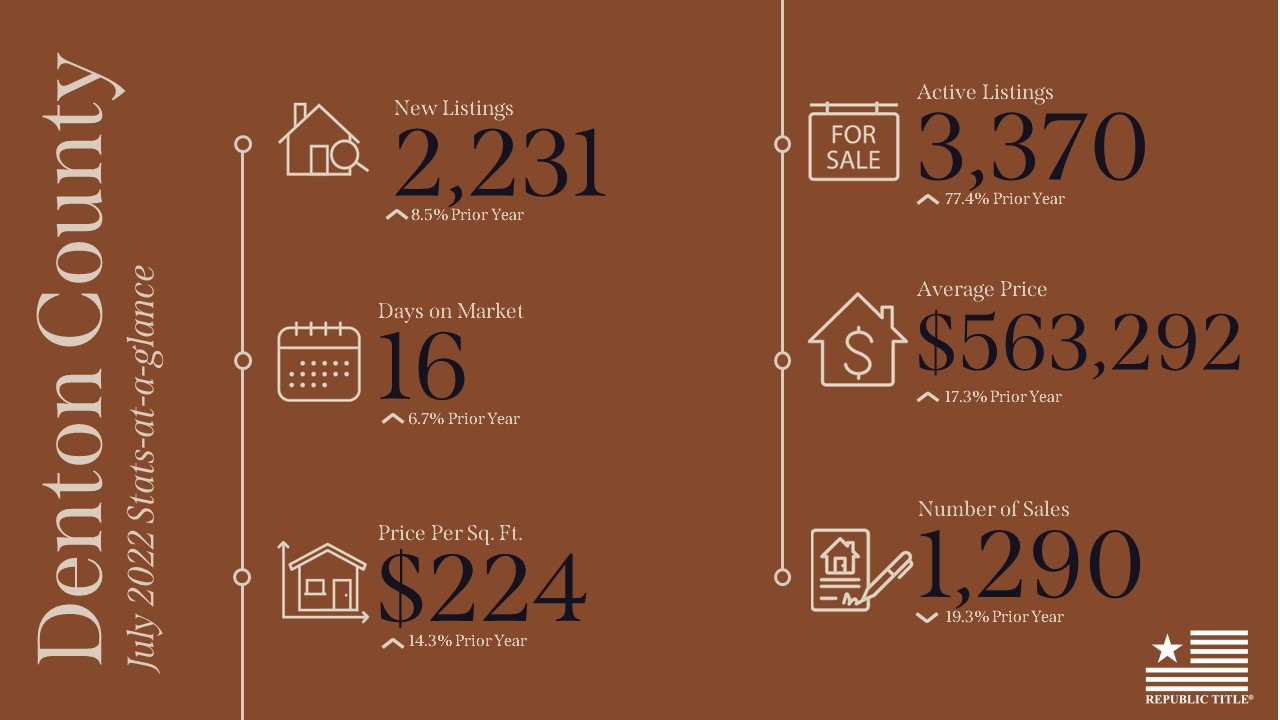
Home prices continue to increase in North Texas! Collin County leads the pack with an average price of $602,166 which is up 19.2% over July 2021. According to a report from Texas Realtors, house prices are climbing faster in North Texas than they are in any other Texas metro area. The good news is that active listings are also up in each county including 3,532 active listings in Collin County (up 69.1% over July 2021) to 3,370 active listings in Denton County (up 77.4% over July 2021).
Our stats infographics include a year over year comparison and area highlights for single family homes broken down by county. We encourage you to share these infographics and video with your sphere.
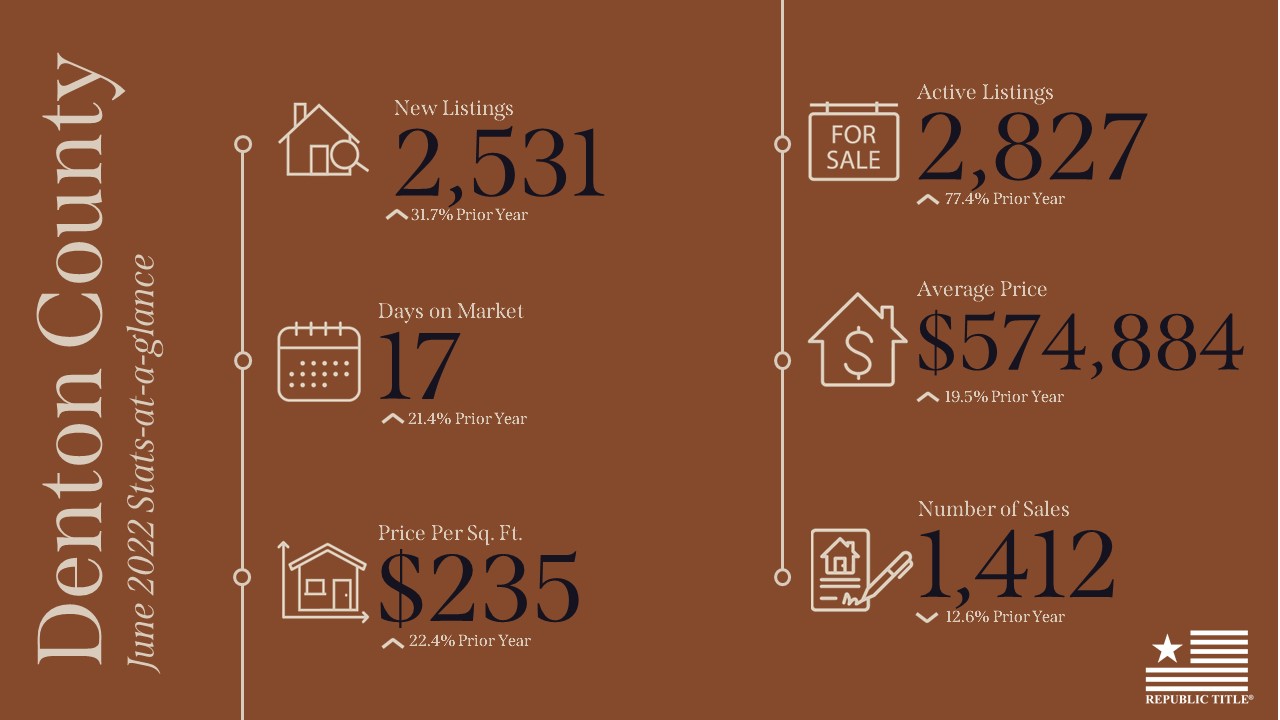
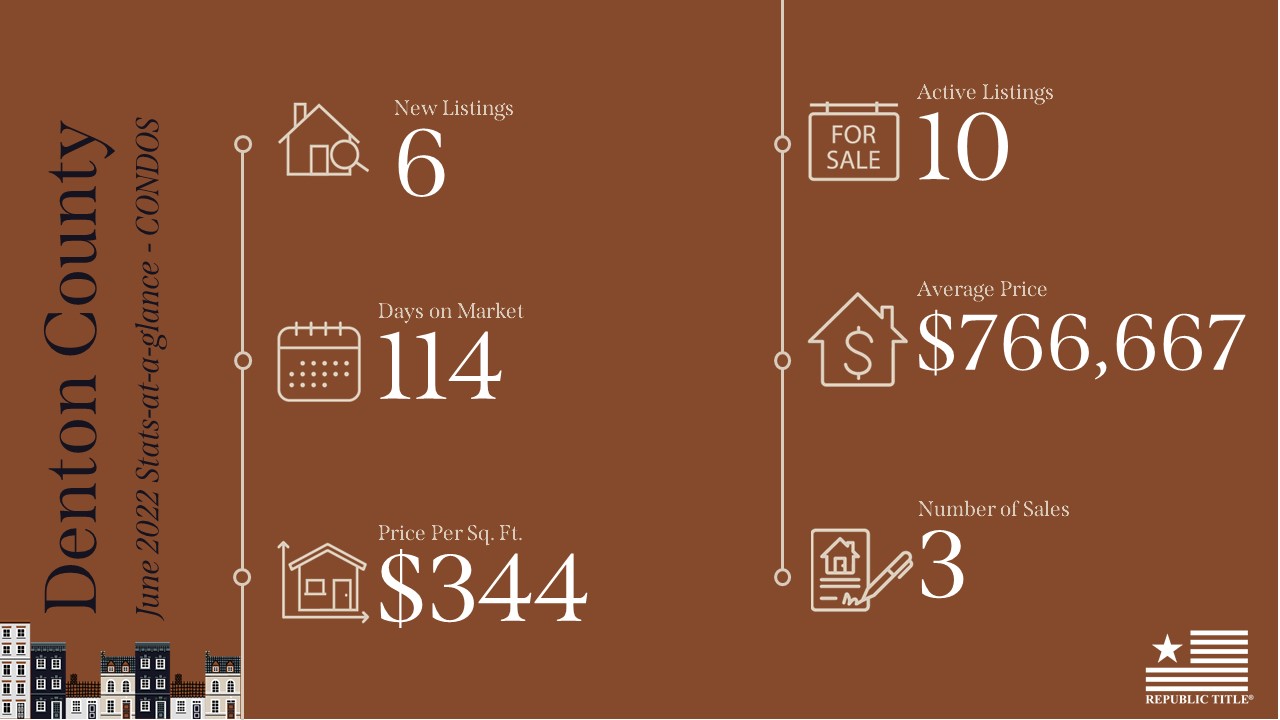
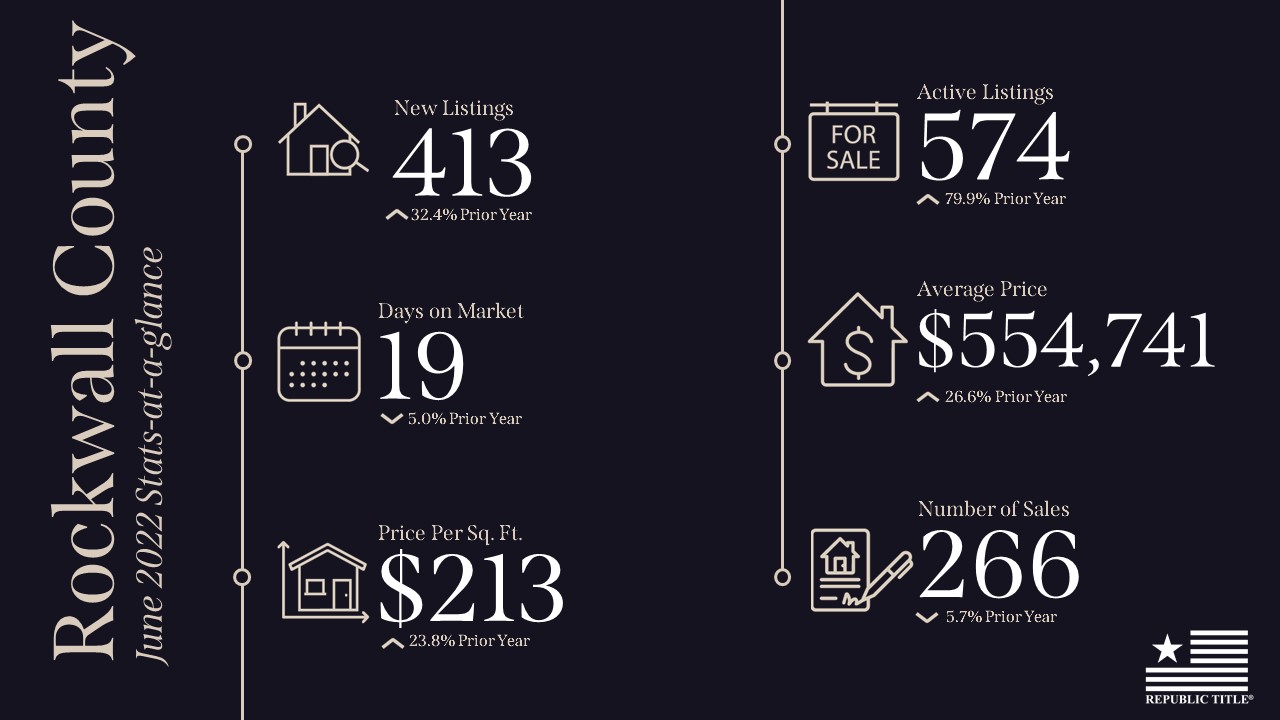
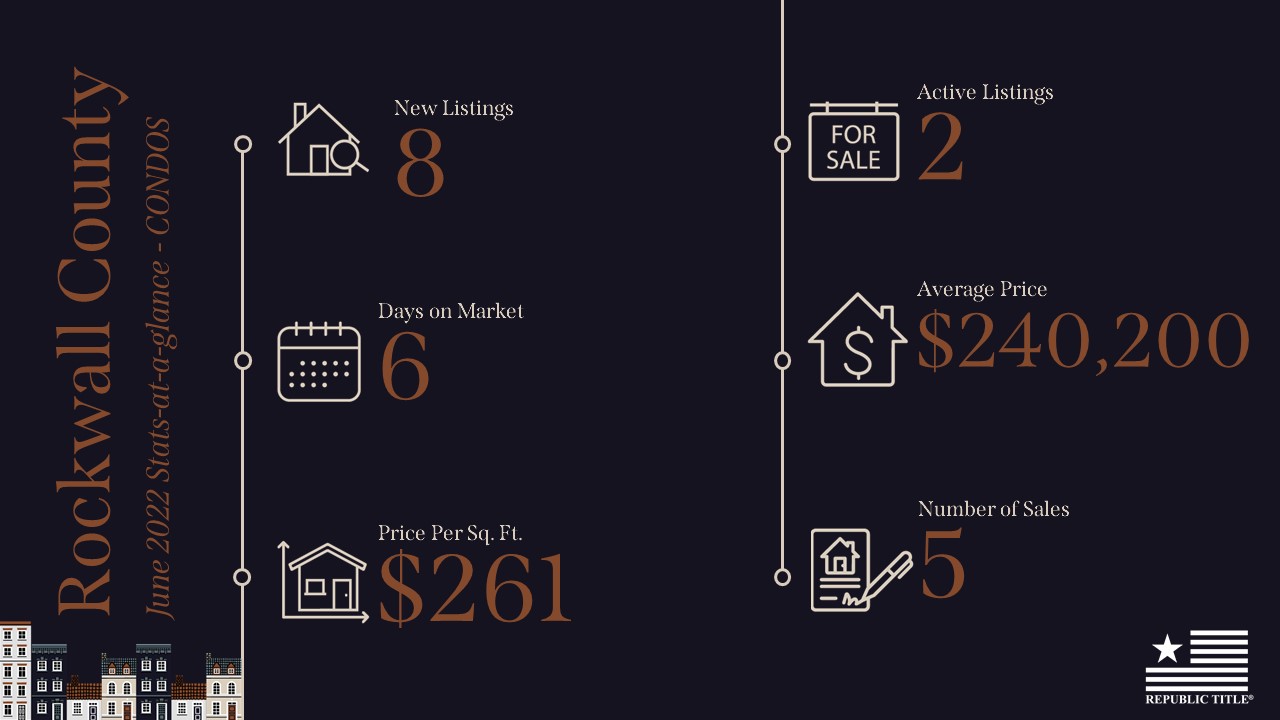
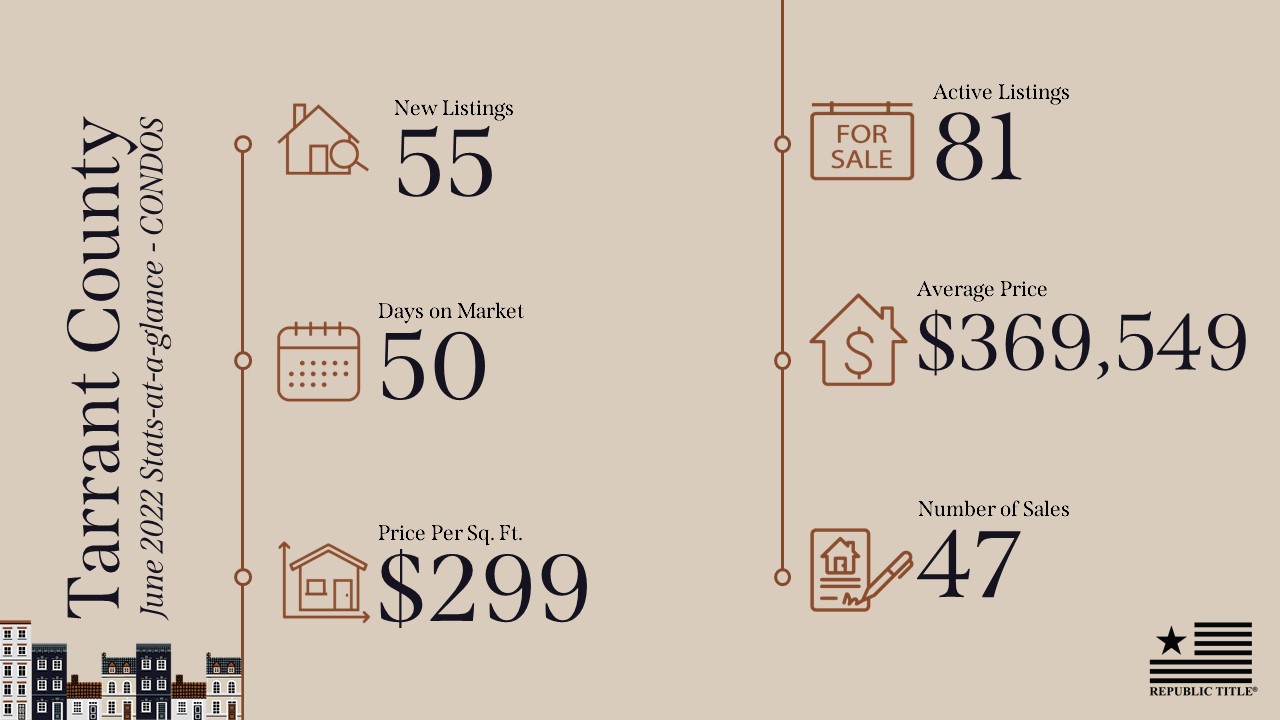
In June, home inventory increased in each county with new listings up ranging from 6% to 32% over June 2021. There is also an increase in inventory compared to last month in each county which is welcome as the DFW housing market has experienced tight supply conditions for some time. Average sales prices are up ranging from 15% in Dallas County to 27.9% in Collin County compared to June 2021. According to the Home Buying Institute, we are still in a seller’s market, but “these recent trends should make things a bit easier for buyers going forward”.
Our stats infographics include a year over year comparison and area highlights for single family homes broken down by county. We encourage you to share these infographics and video with your sphere.
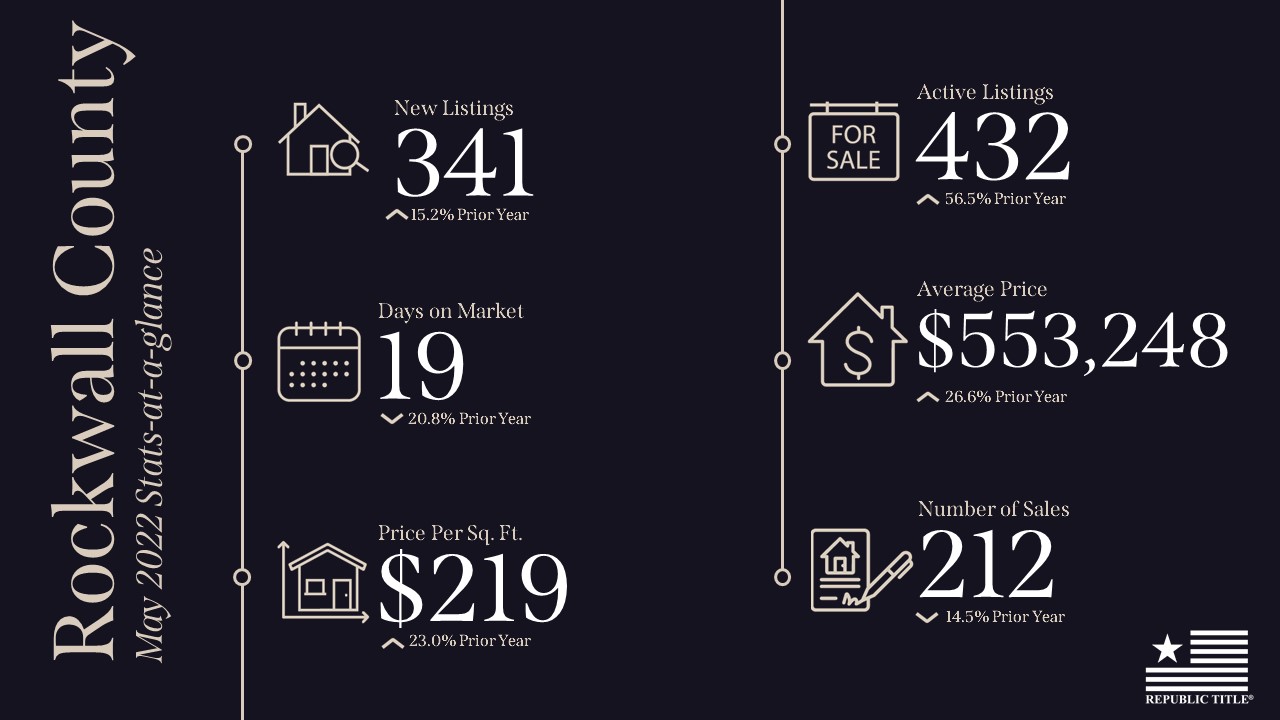
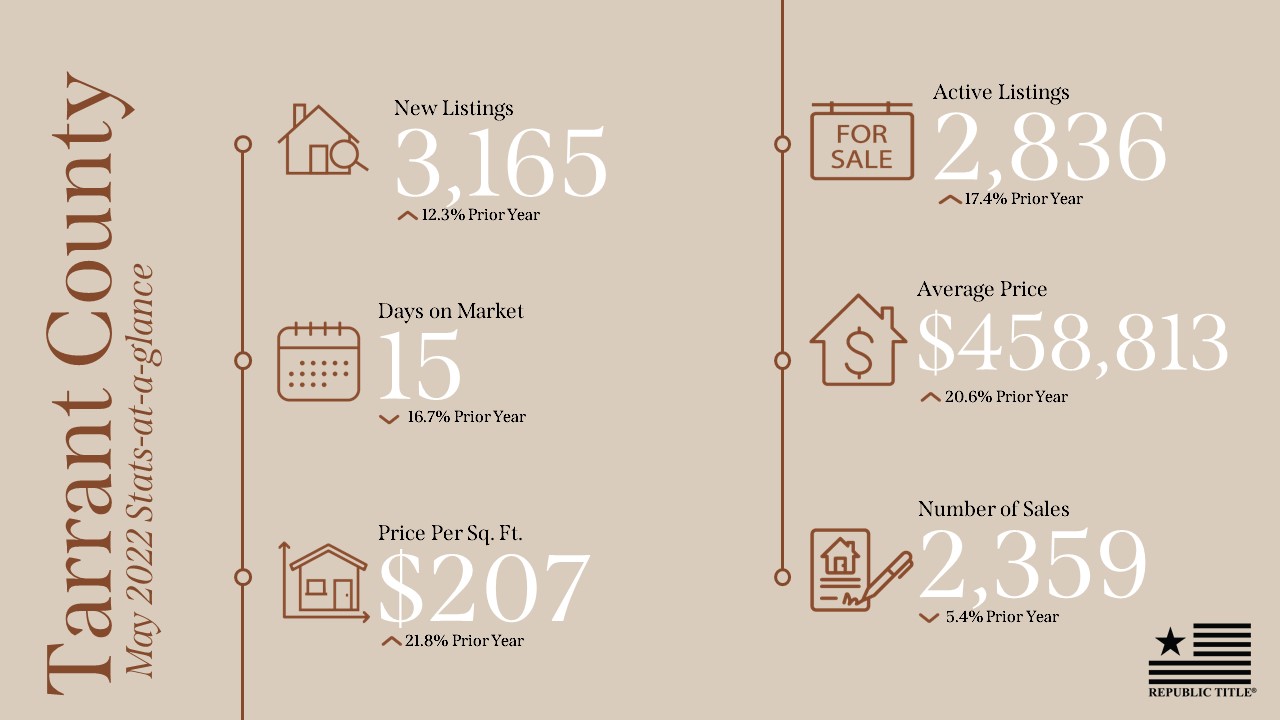
Inventory is increasing with new listings up in Collin, Dallas, Denton, and Tarrant Counties over April 2022. Average sales prices are up ranging from 14% in Dallas County to 26% in Rockwall County compared to May 2021. Average days on market across the five counties in North Texas was 18 days which is down in each county over 2021. According to the Dallas Business Journal, the DFW housing market had the largest increase in the close-to-list price ratio (average value of the sales price divided by the list price for each transaction) in the U.S. year-over-year with a close-to-list ratio of 104.7% compared to 98.4% in May 2021.
Our stats infographics include a year over year comparison and area highlights for single family homes broken down by county. We encourage you to share these infographics and video with your sphere.
A title insurance policy is an insurance policy that insures you against liens or other claims against your property. Unlike other types of insurance, you pay the premium one time and the policy generally insures you for as long as you own the property. In Texas, Title Insurance rates are regulated by the Texas Department of Insurance and the rate is based on the amount of coverage provided by the policy. There are two basic types of title insurance, an owner’s title policy and a loan title policy. Most financial lenders require a loan title policy as security for their investment in your property just as they require homeowners insurance or other types of coverage for their protection. Owner’s title insurance lets the new homeowner feel safe and confident there are no other claims as to the ownership of the insured property. Among other matters, it ensures access to the property, gives the homeowner the right to occupy the property, and provides indefeasible title.
For more information, go to Blog for videos like this and other helpful information. Blog | REPUBLIC TITLE
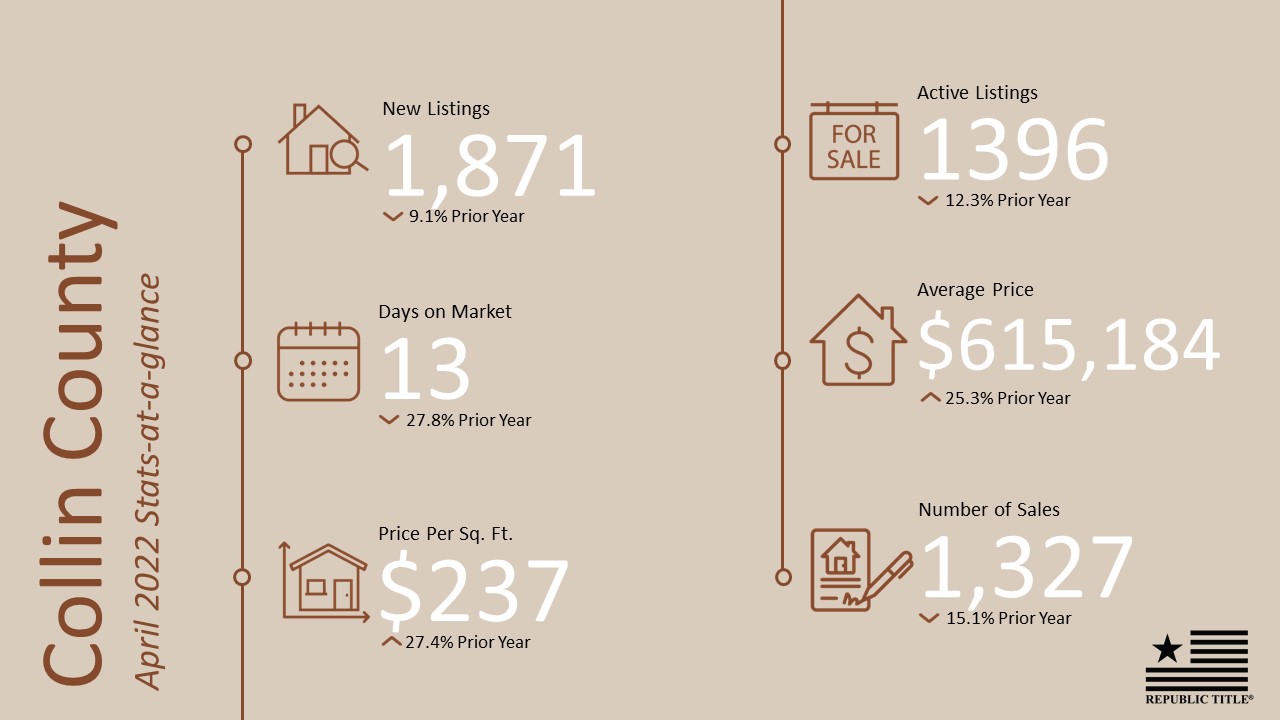
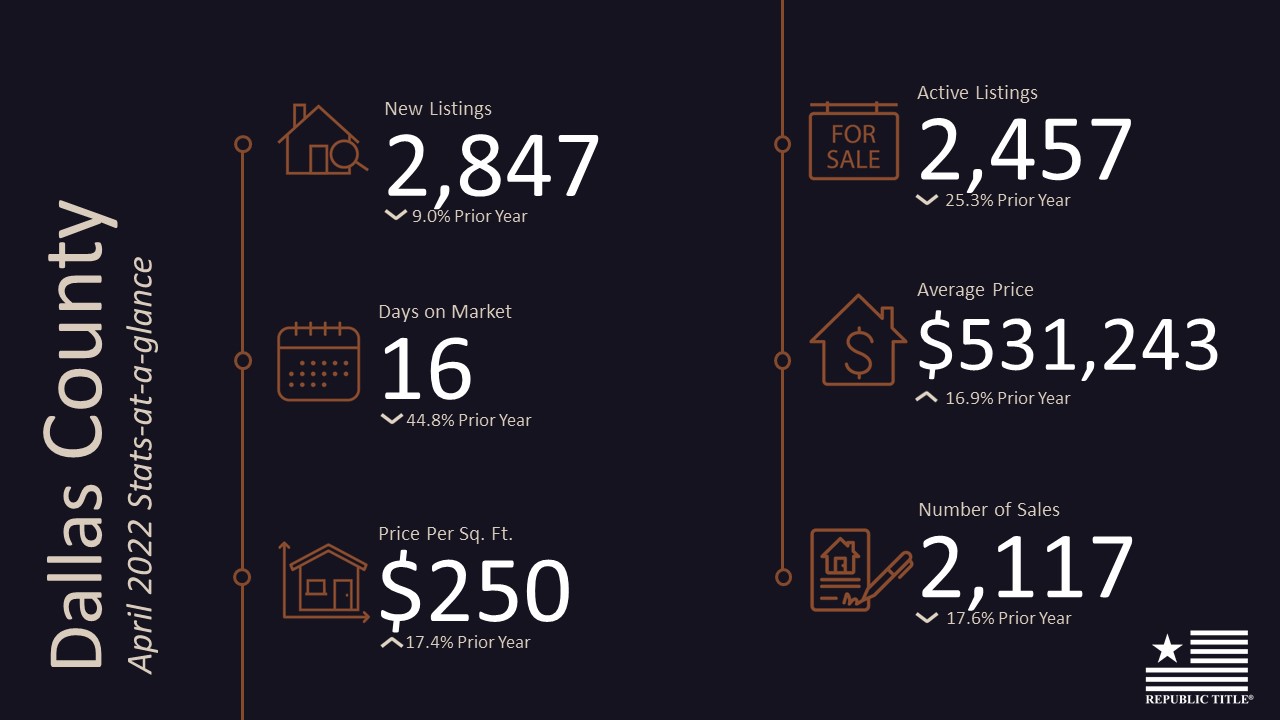
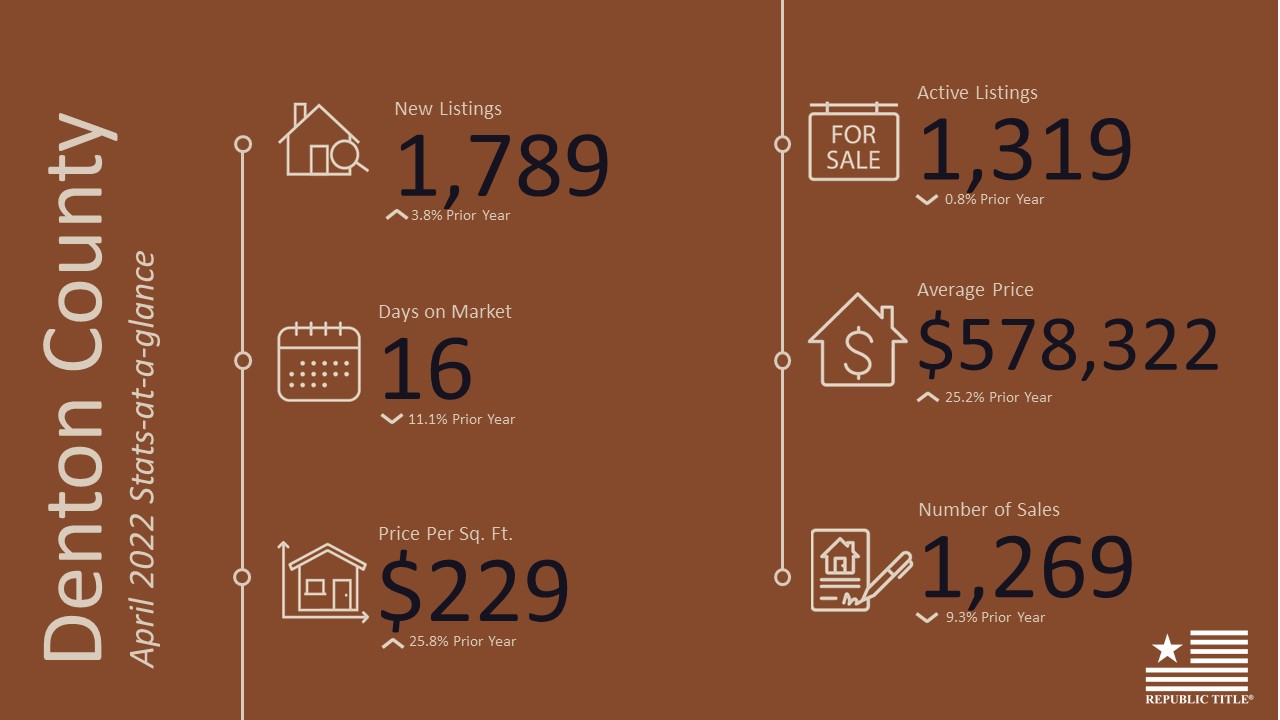
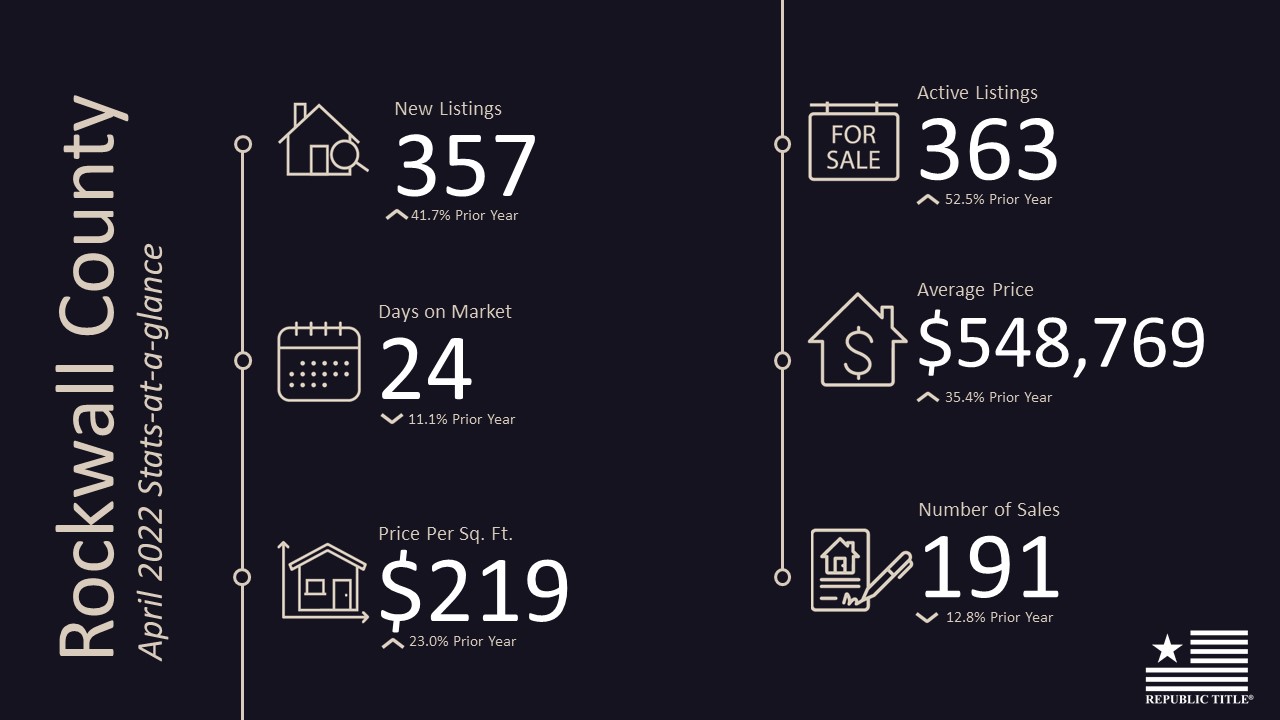
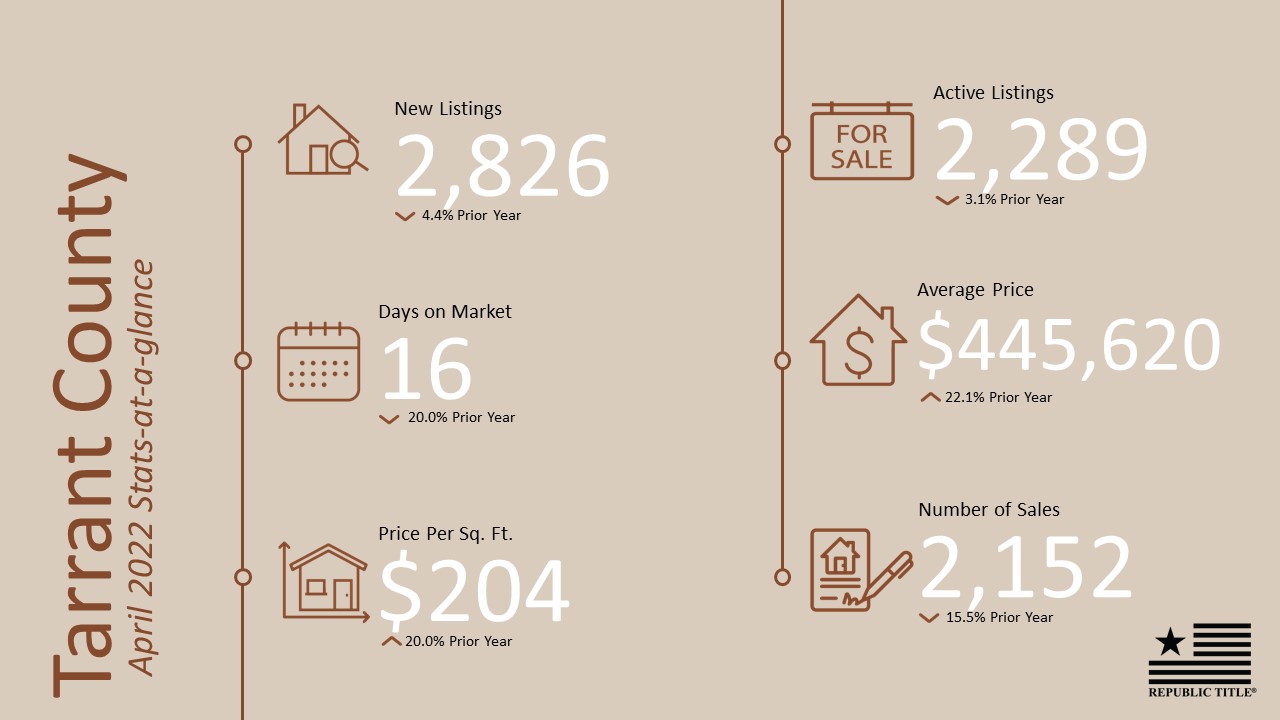
The housing market in North Texas continues to be hot! New listings are up consistently in all five counties over March 2022 as the Spring market continues to heat up. Despite higher mortgage rates, demand remains strong in North Texas. Average sales prices are up ranging from 16% in Dallas County to 35% in Rockwall County compared to April 2021.
Our stats infographics include a year over year comparison and area highlights for single family homes broken down by county. We encourage you to share these infographics and video with your sphere.
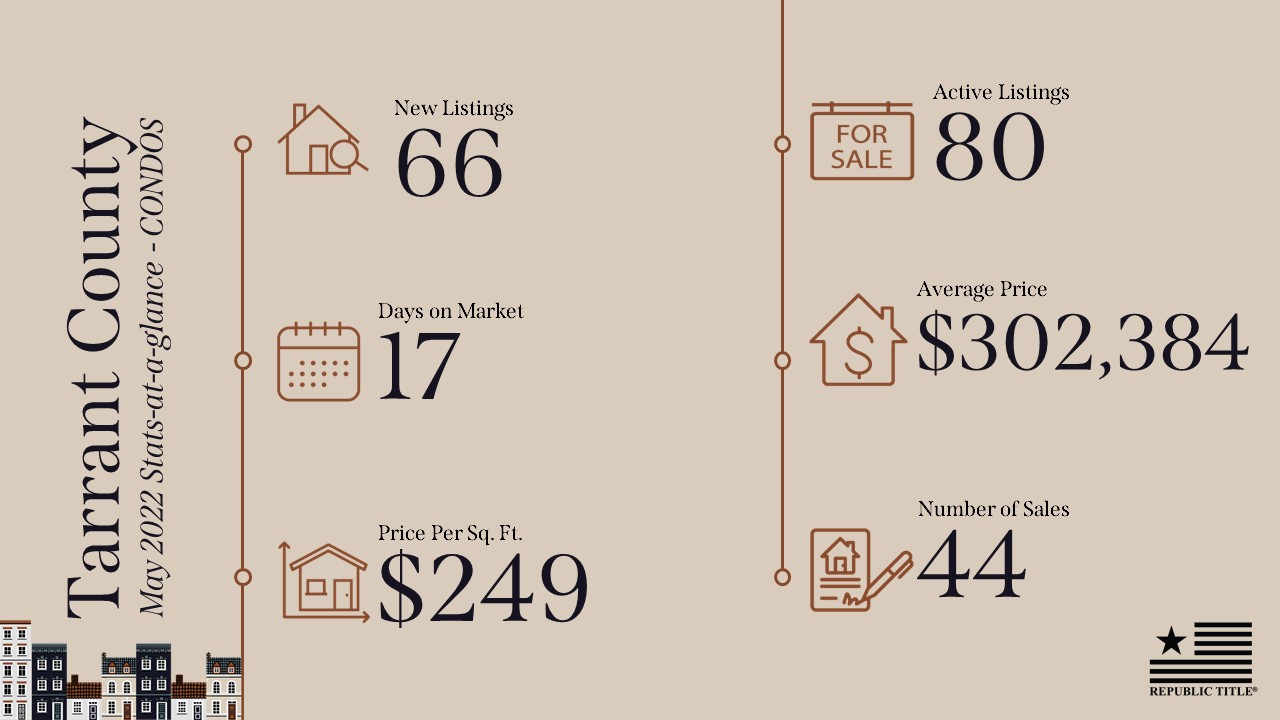
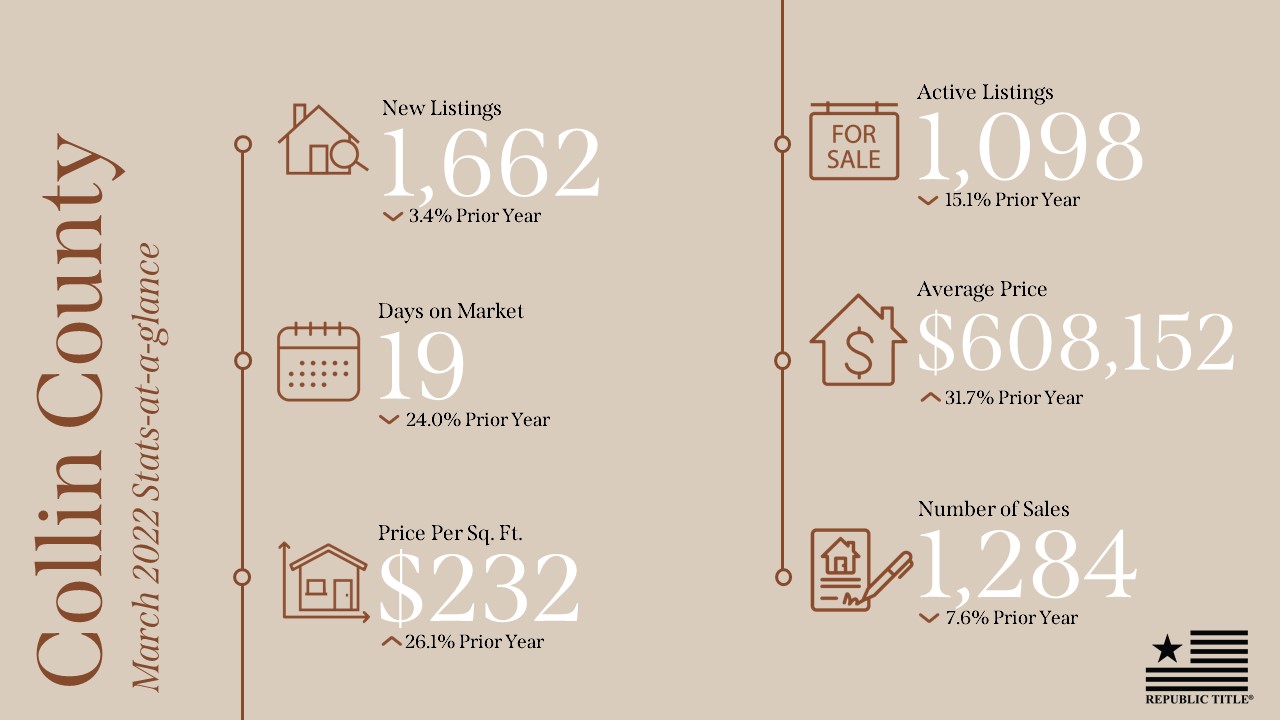
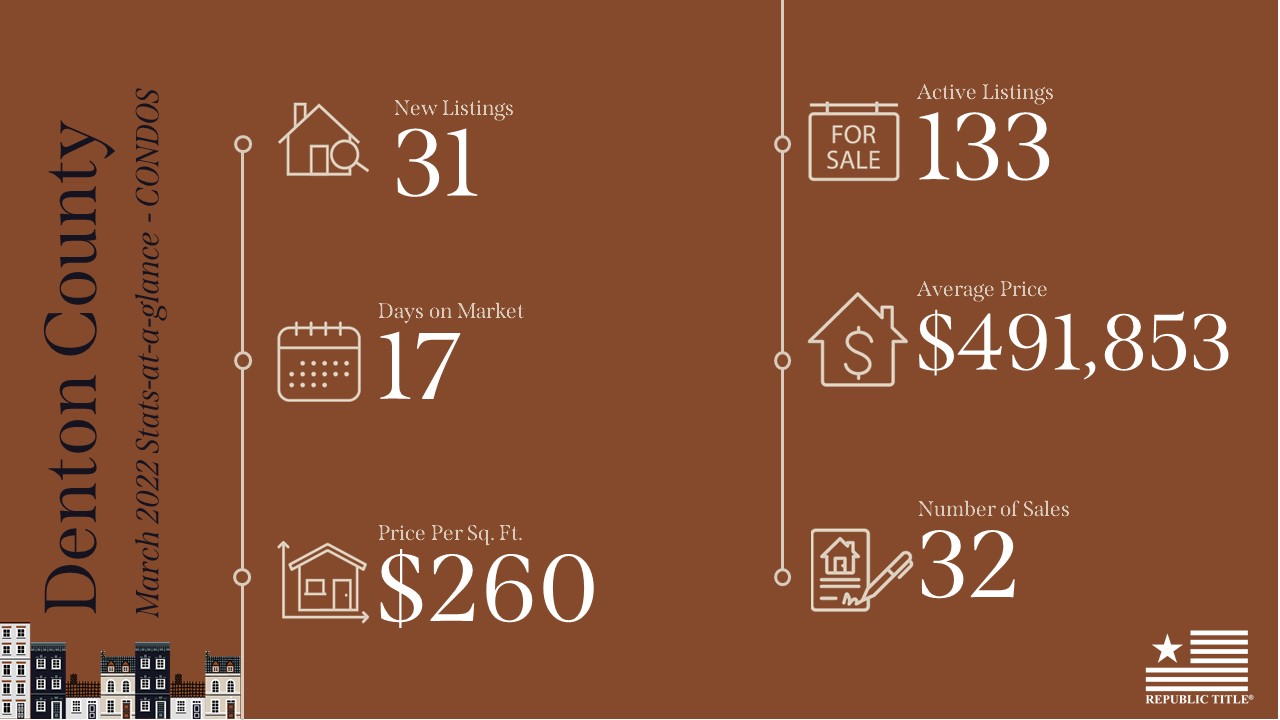
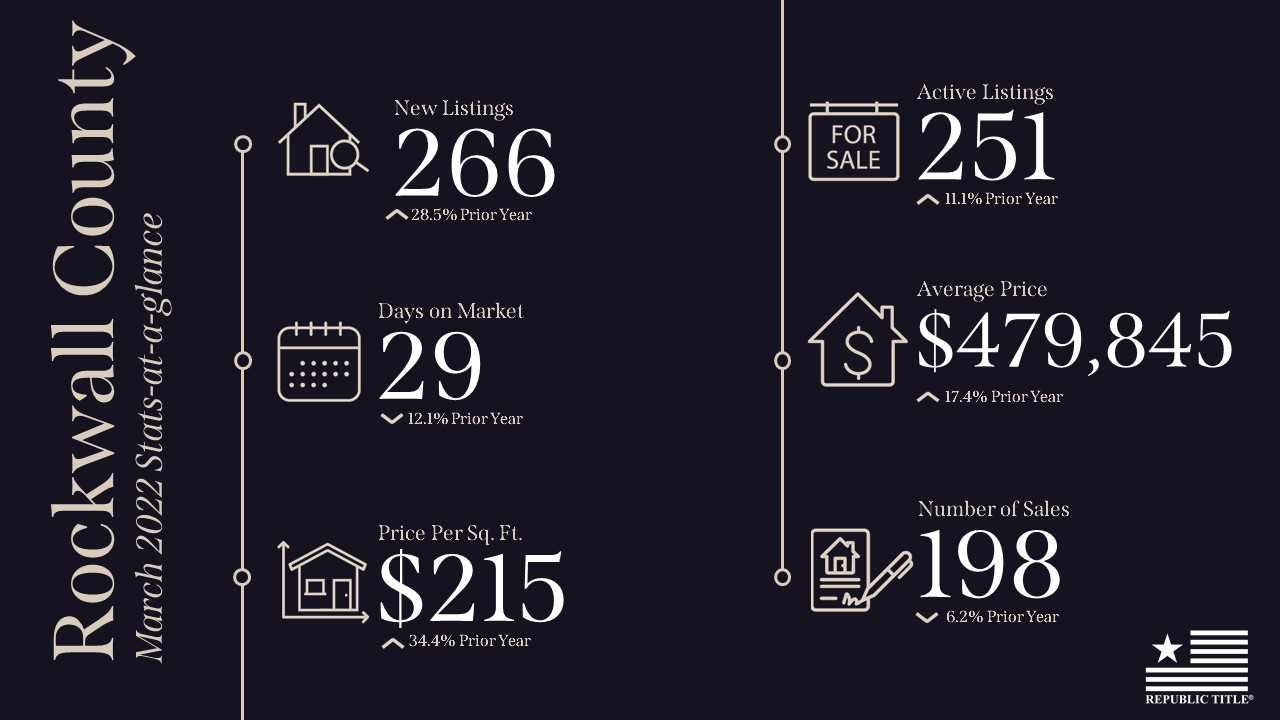
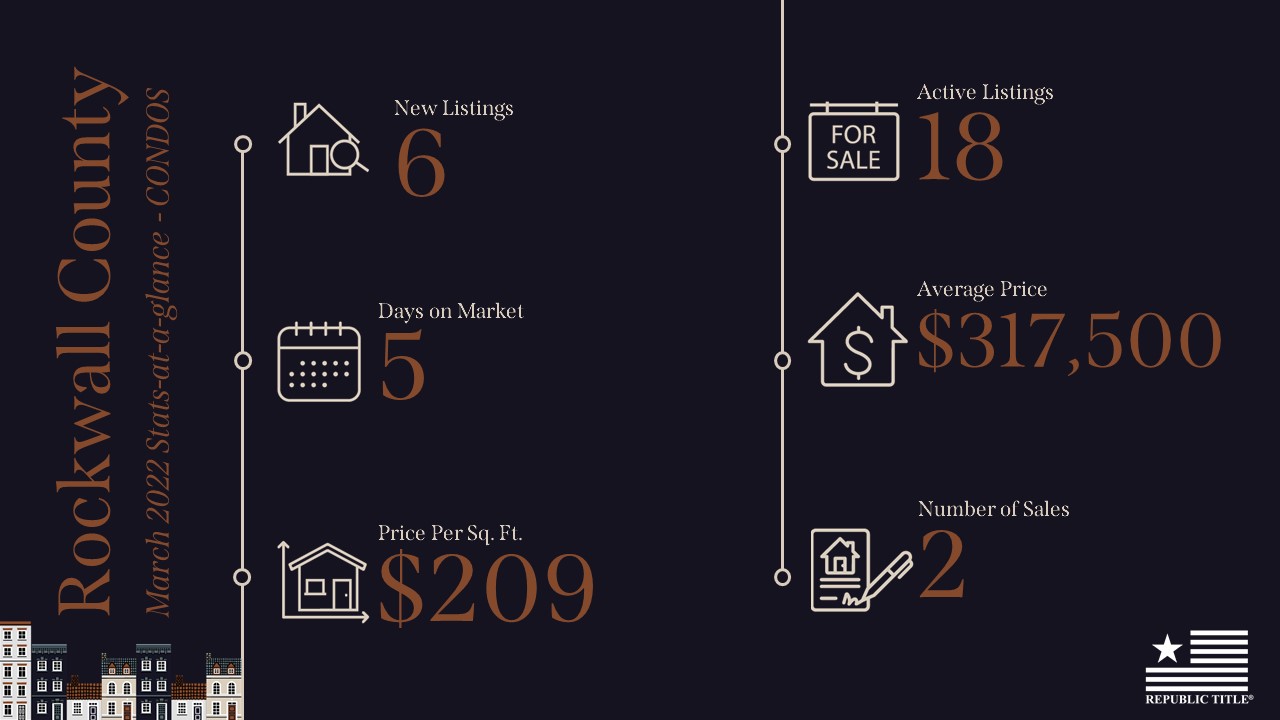
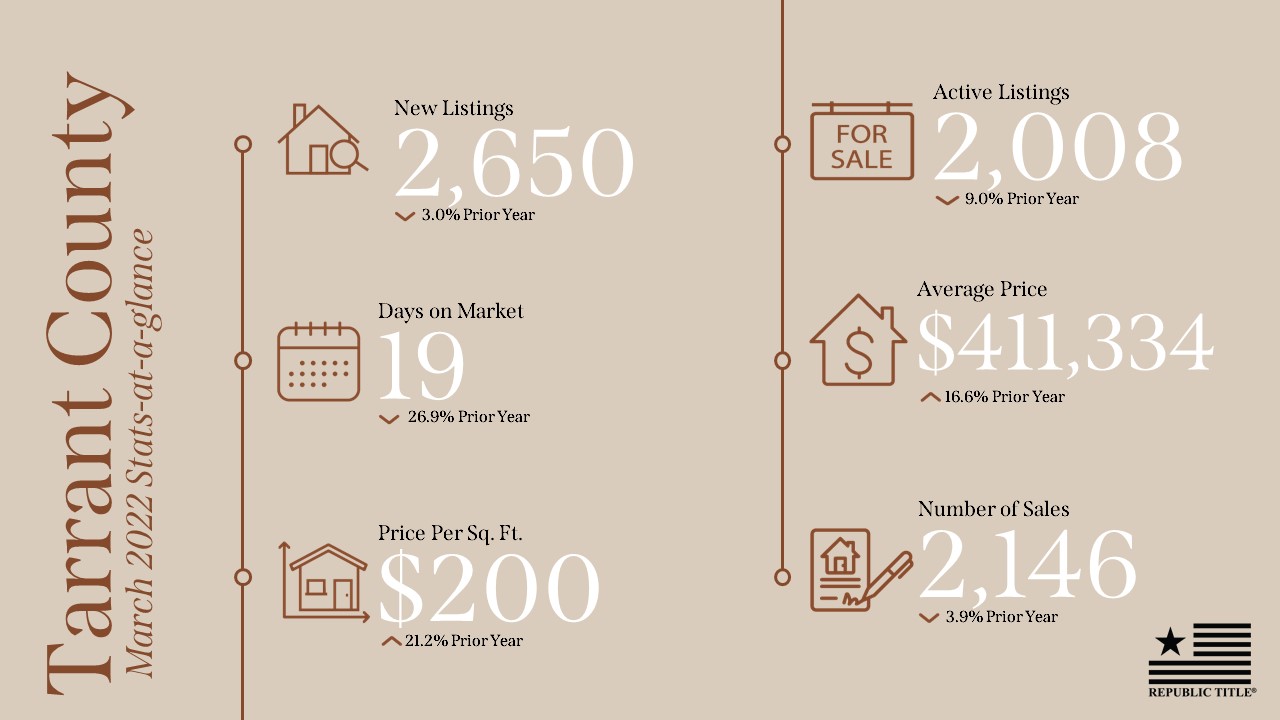
The Spring selling season is underway, and the market reflects that with new listings up in all five counties, though they are just slightly down from March 2021. The average days on market continues to drop each month and averages 21 days in Collin, Dallas, Denton, Rockwall, and Tarrant Counties. While the prices for single family homes continues to climb to staggering highs; with the highest average being Collin County, coming in at over $600k, up from $462k in 2021, and $386k in 2020. WOW! (please note that March 2022 is the first month of the NTREIS reporting area change, so the data with MLS area information is no longer available for reporting. For more information on the change, visit here: https://www.republictitle.com/ntreis-…)
Our stats infographics include a year over year comparison and area highlights for single family homes and condos broken down by MLS area. We encourage you to share these infographics and video with your sphere.
At closing, a seller or a buyer might be caught off guard by all the fees that are not part of the sales price but they are part of the contract. It is important to set your clients expectations from the beginning of the transaction and highlight the additional fees they will likely incur at closing.
There is often a lot of confusion about the owner title policy and the loan title policy. When paragraph 6 reflects that the seller will pay for the owner title policy, the buyer might show concern when they see all these title charges on their closing disclosure or settlement statement. It is their understanding that the seller is paying for the title charges. Well these title charges, however, are actually reflected in the contract which the buyer has presumably read, understood, and agreed to. In Paragraph 12, the buyer has agreed to pay for the loan policy with all the endorsements required by the lender along with other charges and fees most of which are lender fees. Paragraph 12 also informs the seller of their obligation to pay for releases of existing liens, possible prepayment penalties, recording fees, release of seller’s loan liability, tax statement certificates, preparation of the deed, and one half of the escrow fee and other expenses that the seller is obligated to pay under the contract.
Remember when you sit down with your clients and you’re about to accept or make an offer, point out paragraph 12 to inform them about the additional expenses.