Our stats infographics include a year over year comparison and area highlights for single family homes and condos broken down by MLS area. We encourage you to share these infographics and video with your sphere.
Our stats infographics include a year over year comparison and area highlights for single family homes and condos broken down by MLS area. We encourage you to share these infographics and video with your sphere.
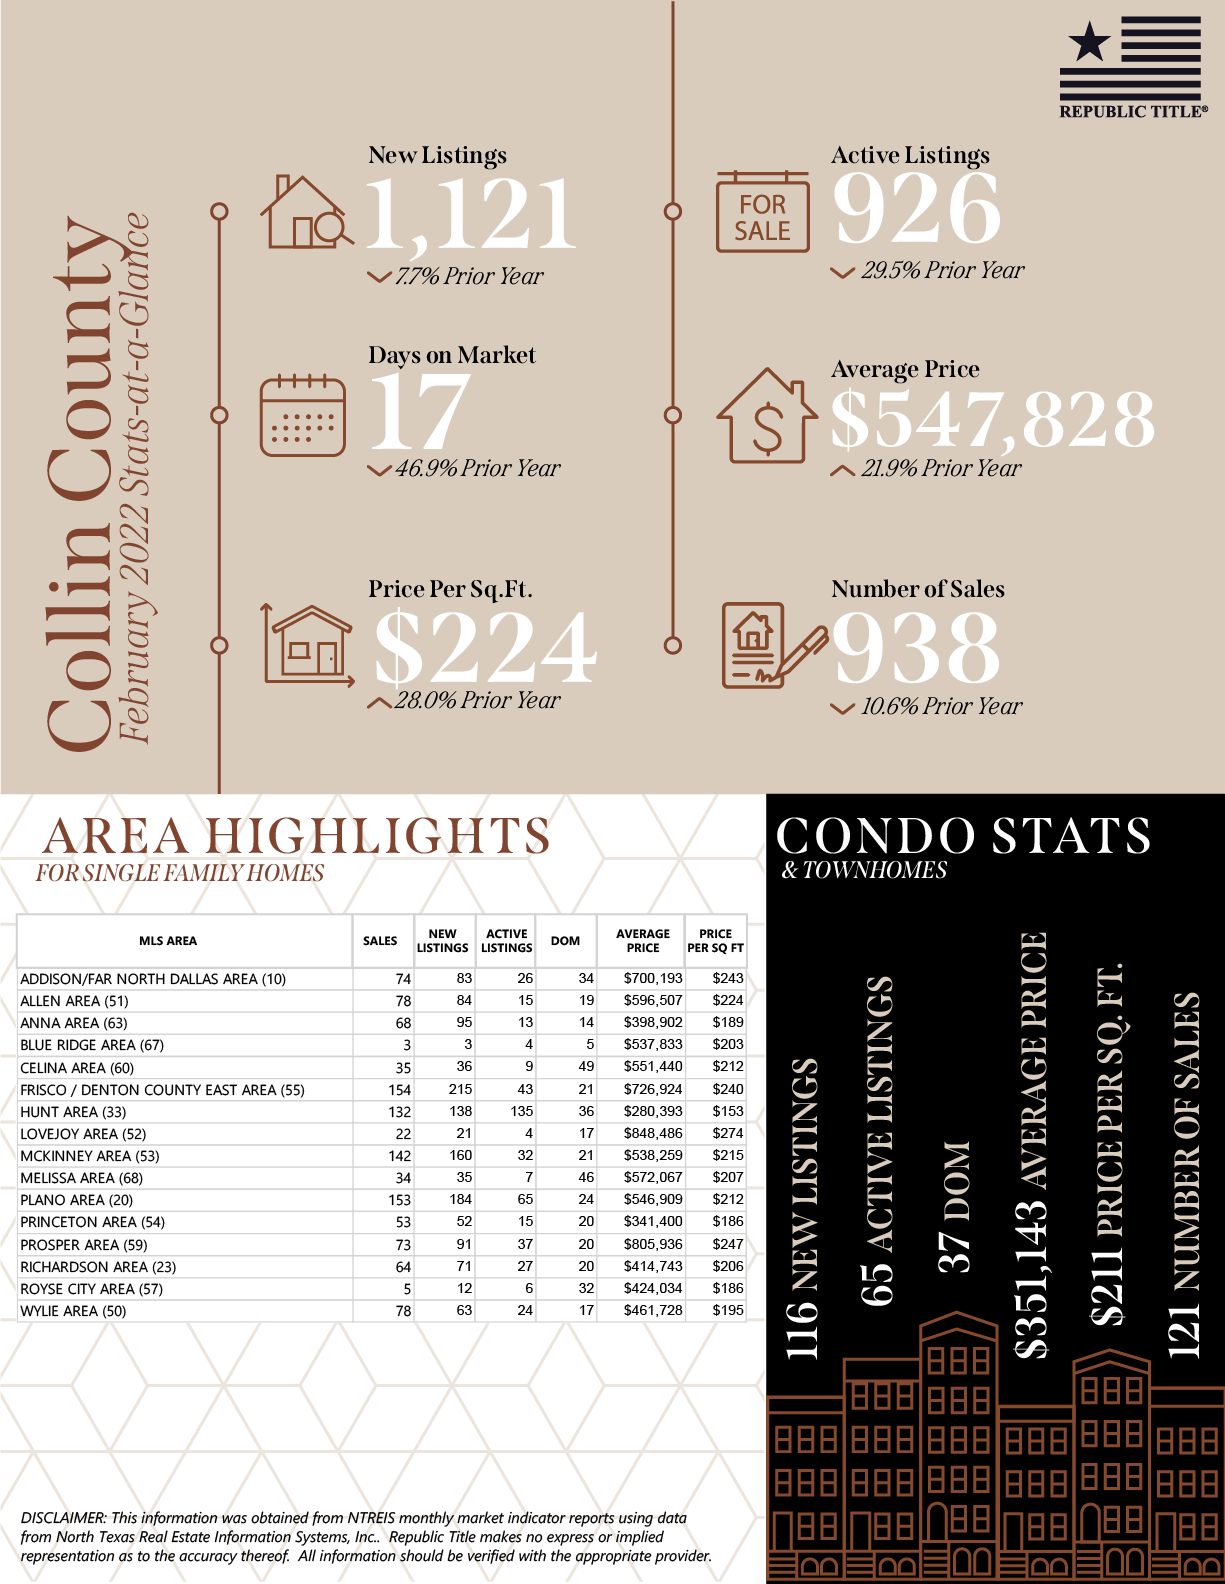
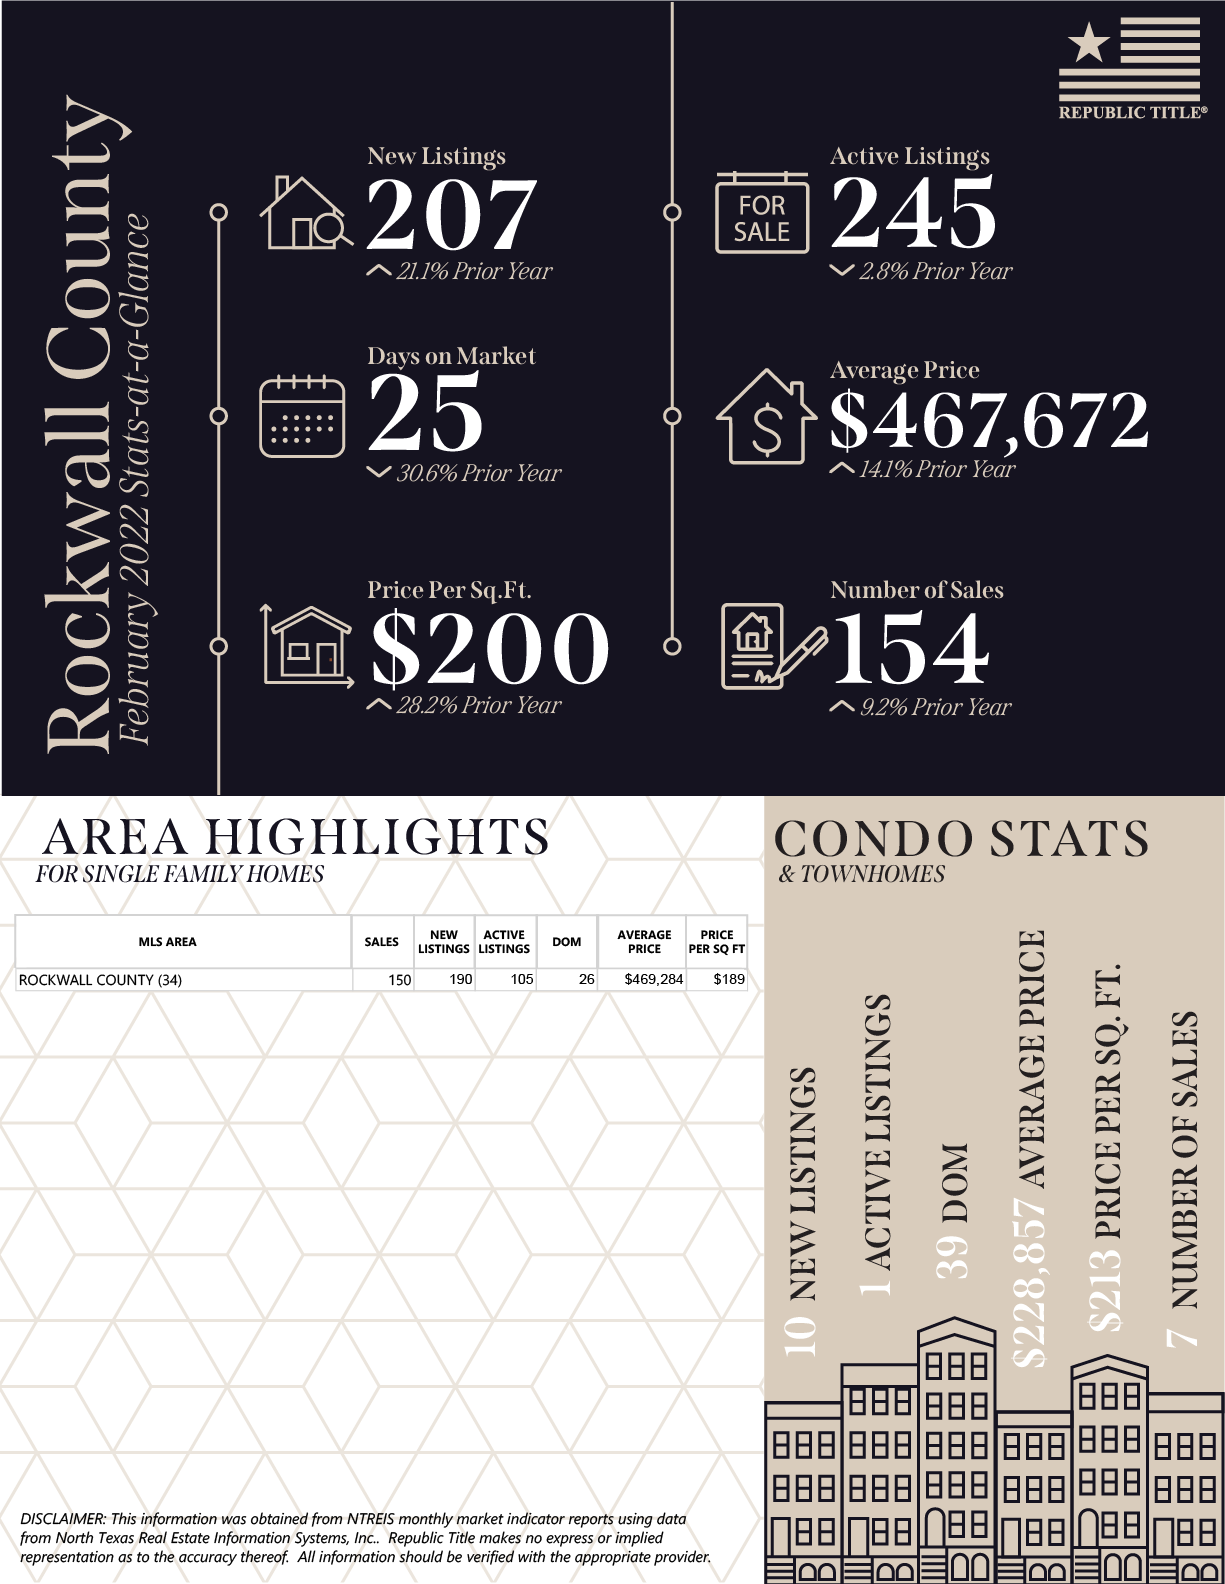
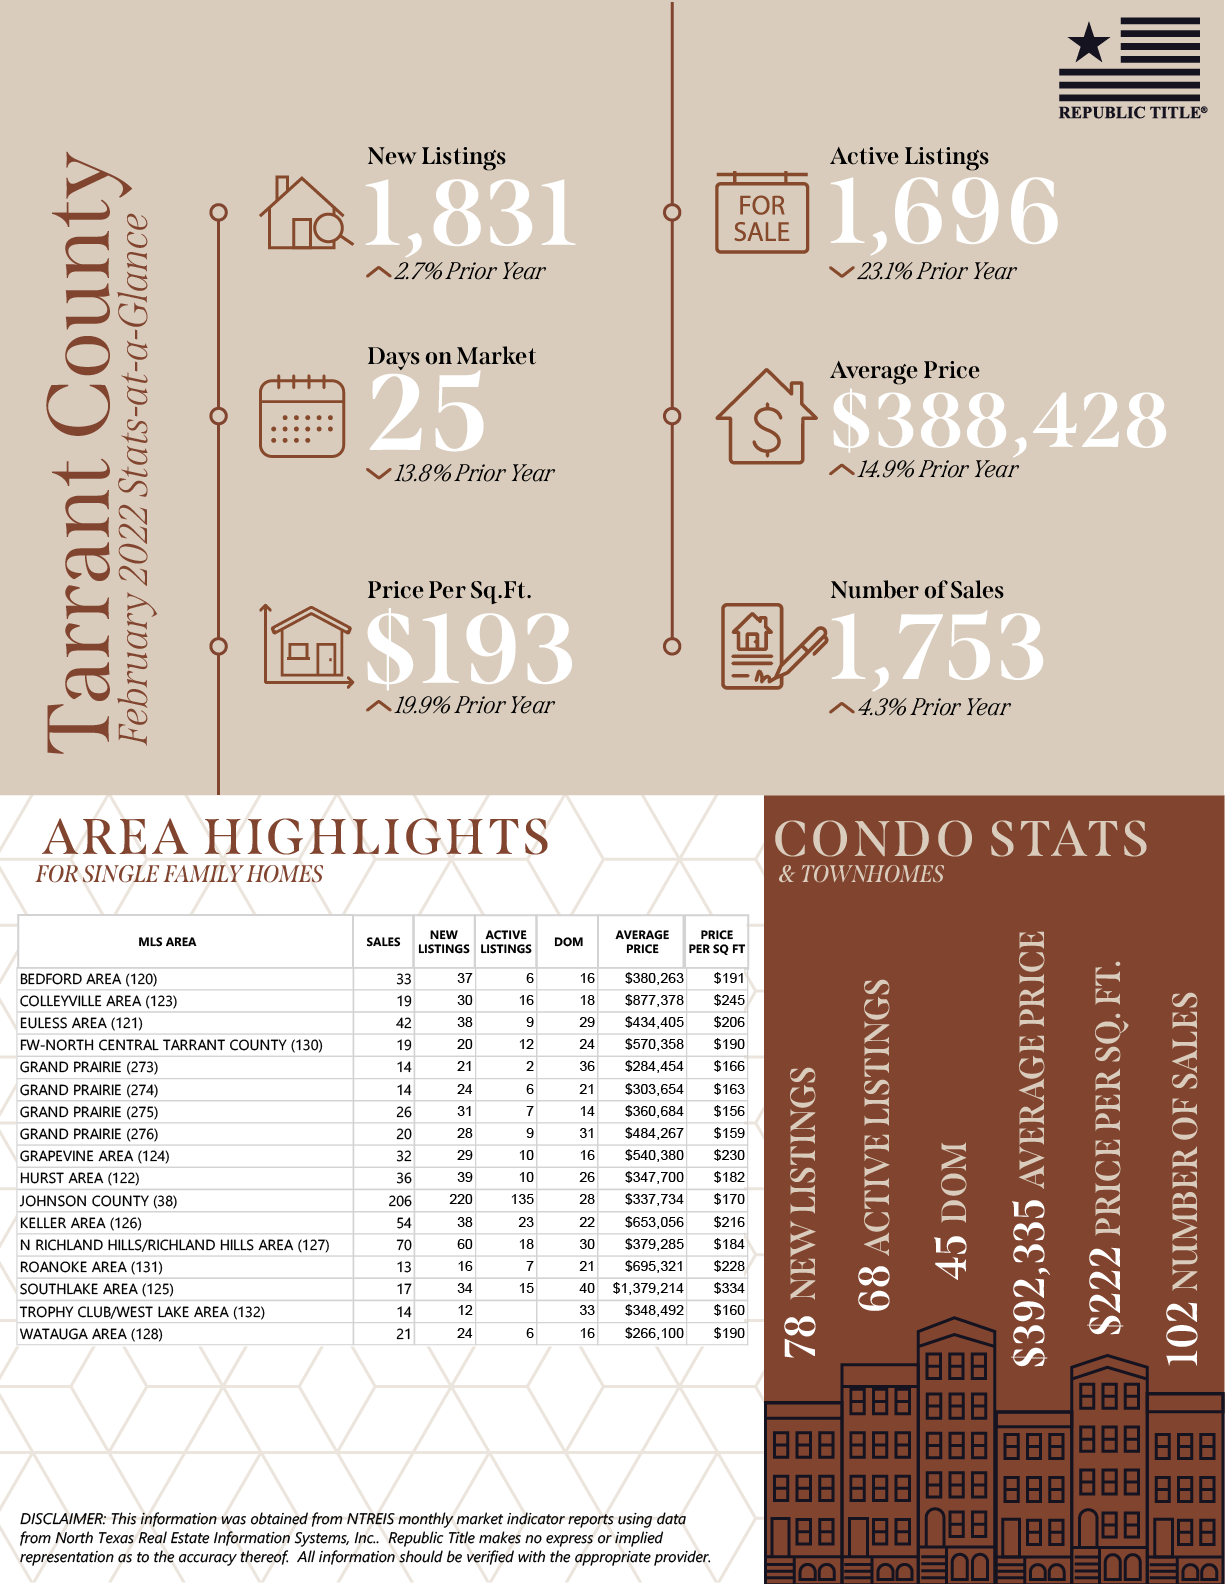
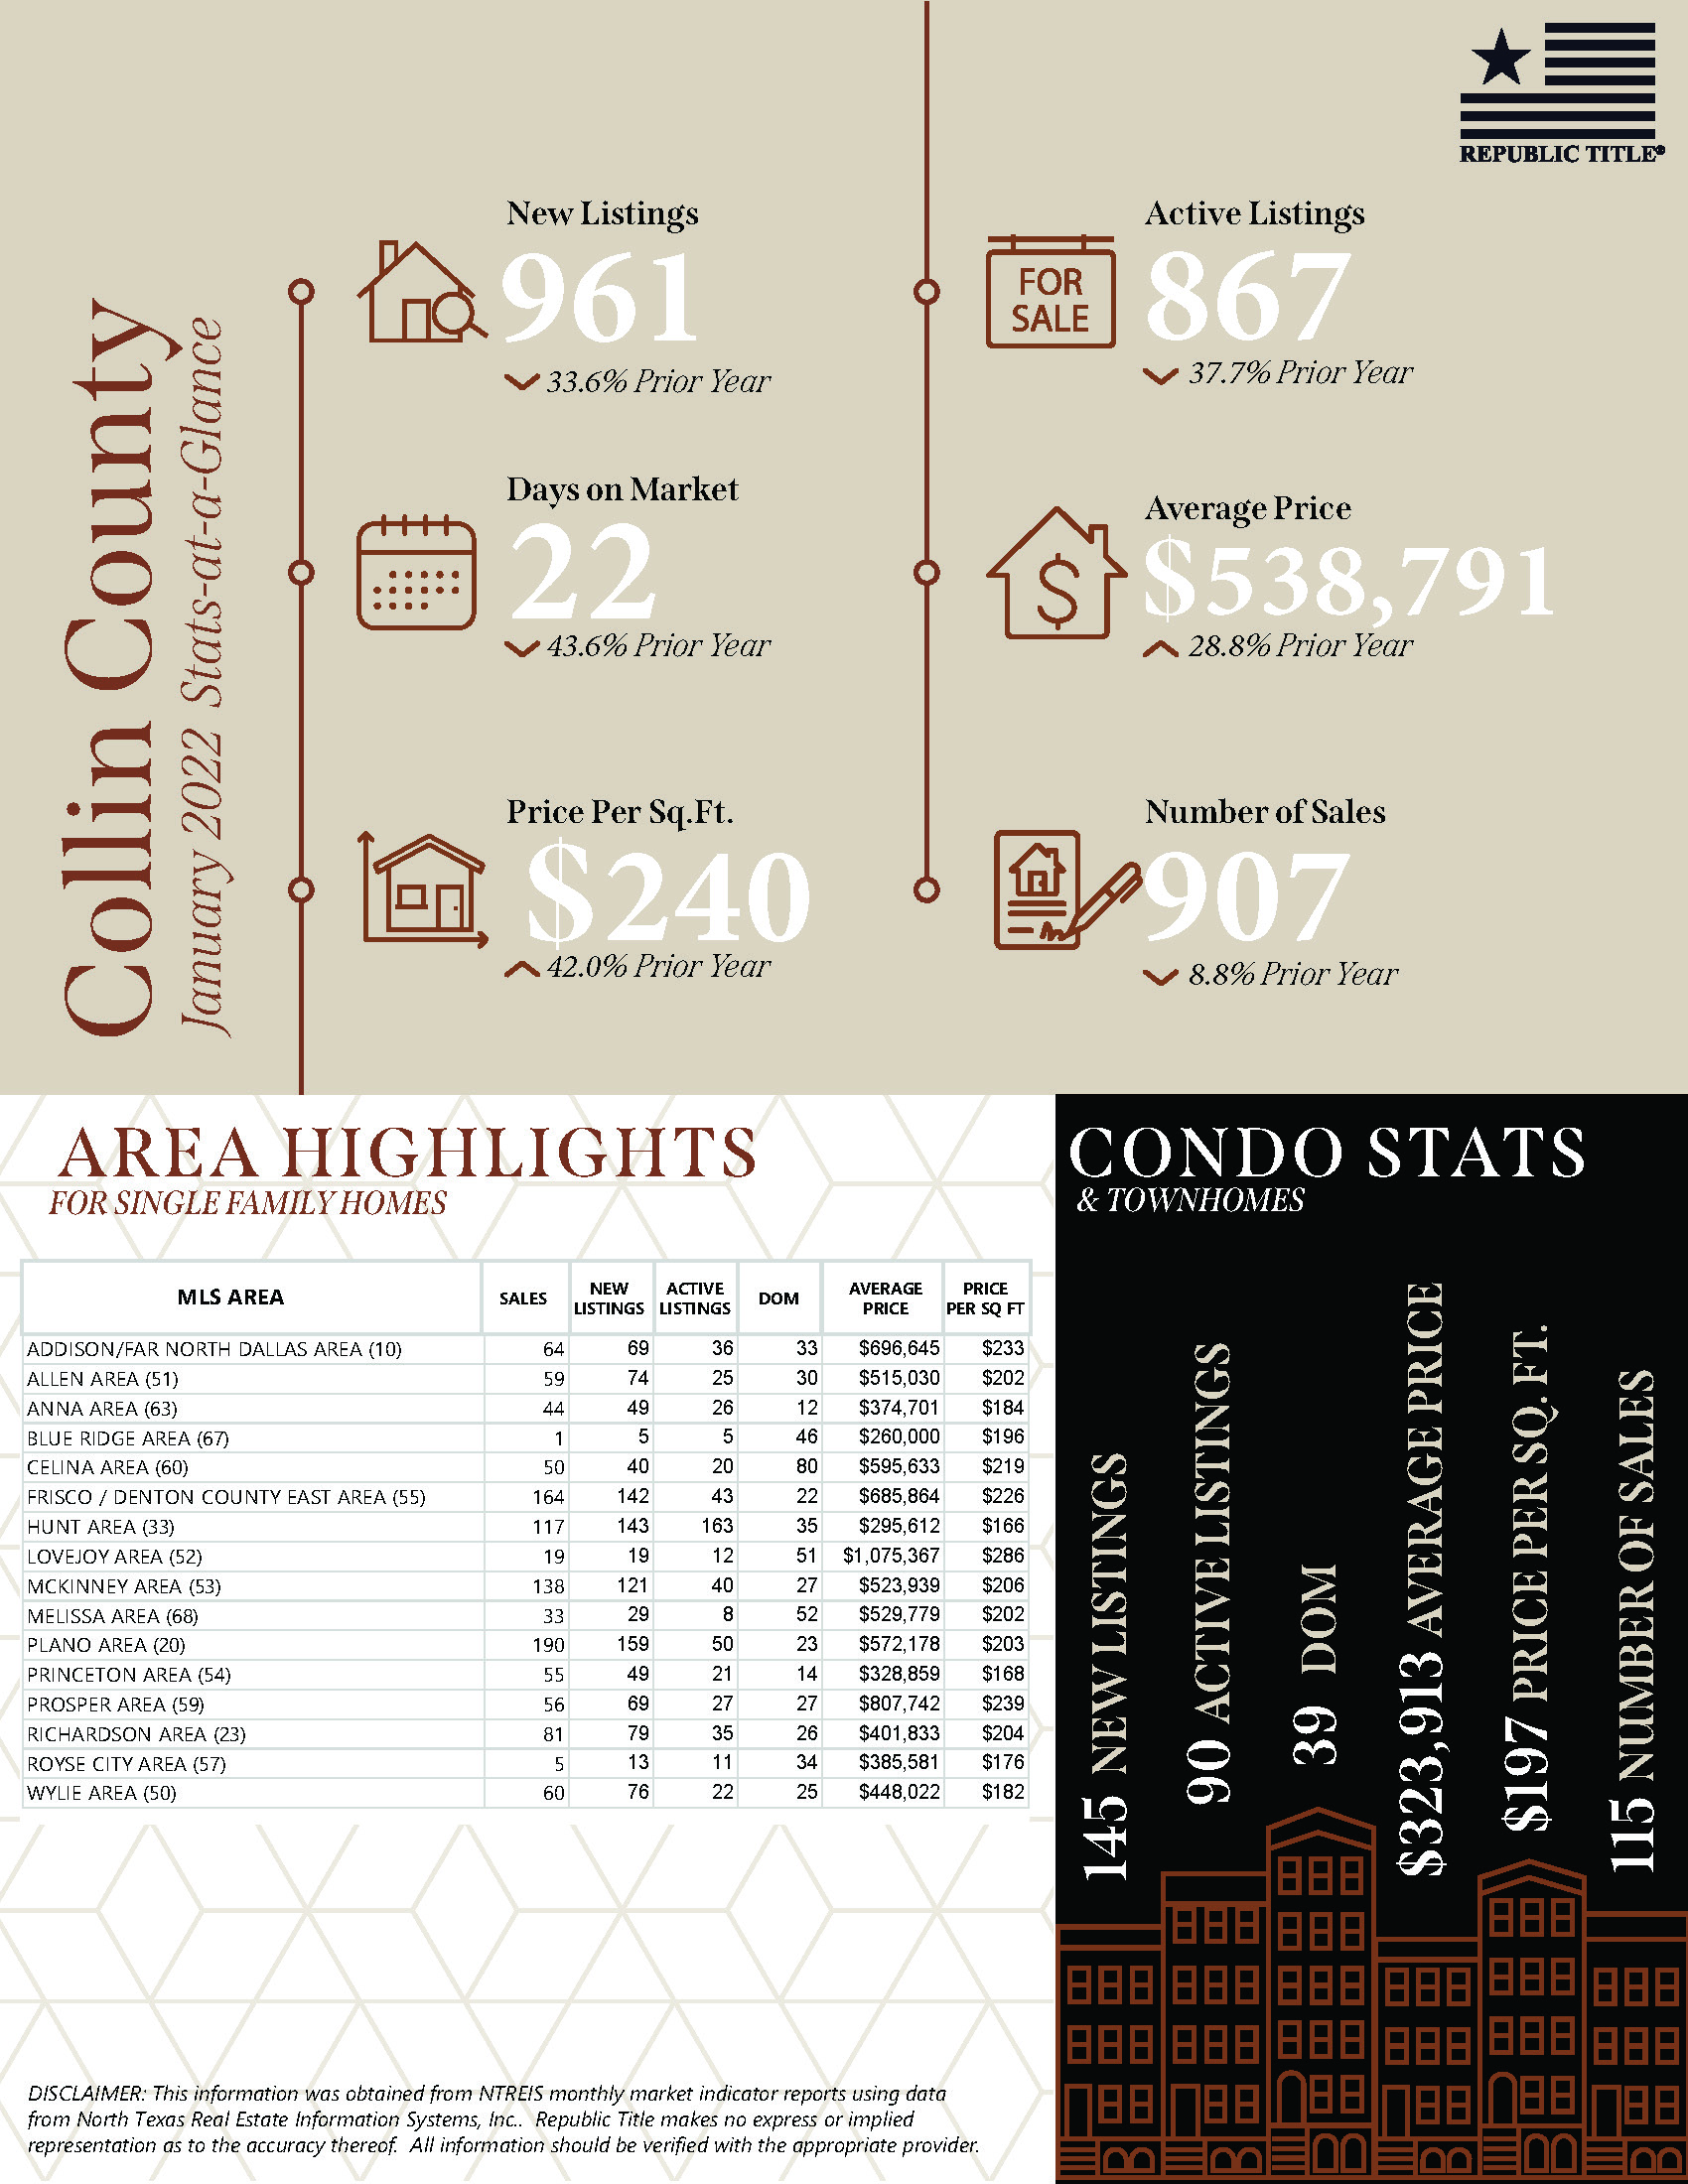
December 2021 stats are here and we have the numbers! Let’s see how the DFW real estate market ending 2021. Active listing fell slightly from November, but that is to be expected over the holiday season. As expected due to the lack of inventory, the overall number of sales is down in all counties while the days on market continues to drop. Not surprisingly, the price per square foot in the metroplex continues to rise in all five counties with Collin County seeing the biggest increase up 33% over last year, followed by Denton county at 26%.
Our stats infographics include a year over year comparison and area highlights for single family homes and condos broken down by MLS area. We encourage you to share these infographics and video with your sphere.
November 2021 North Texas real estate stats are out and we’ve got the numbers! Our stats infographics include a year over year comparison and area highlights for single family homes and condos broken down by MLS area. We encourage you to share these infographics and video with your sphere.
October 2021 North Texas real estate stats are out and we’ve got the numbers! Our stats infographics include a year over year comparison and area highlights for single family homes and condos broken down by MLS area. We encourage you to share these infographics and video with your sphere.
October 2021 stats alert! The third quarter of 2021 resembles much of the same across Collin, Dallas, Denton, Tarrant and Rockwall counties with active listings down about 30% and new listings down about 10%. The shortage of inventory remains here in North Texas. The number of sales in Dallas County was down 5.6% over last year, while in the other four counties they were down an average of 15% from 2020. Not surprisingly, the price per square foot in the metroplex continues to rise in all five counties with Collin County seeing the biggest increase up 29.1% over last year. It is a great time to be in the market in North Texas and we are thankful!
September 2021 North Texas real estate stats are out and we’ve got the numbers! Our stats infographics include a year over year comparison and area highlights for single family homes and condos broken down by MLS area. We encourage you to share these infographics and video with your sphere.
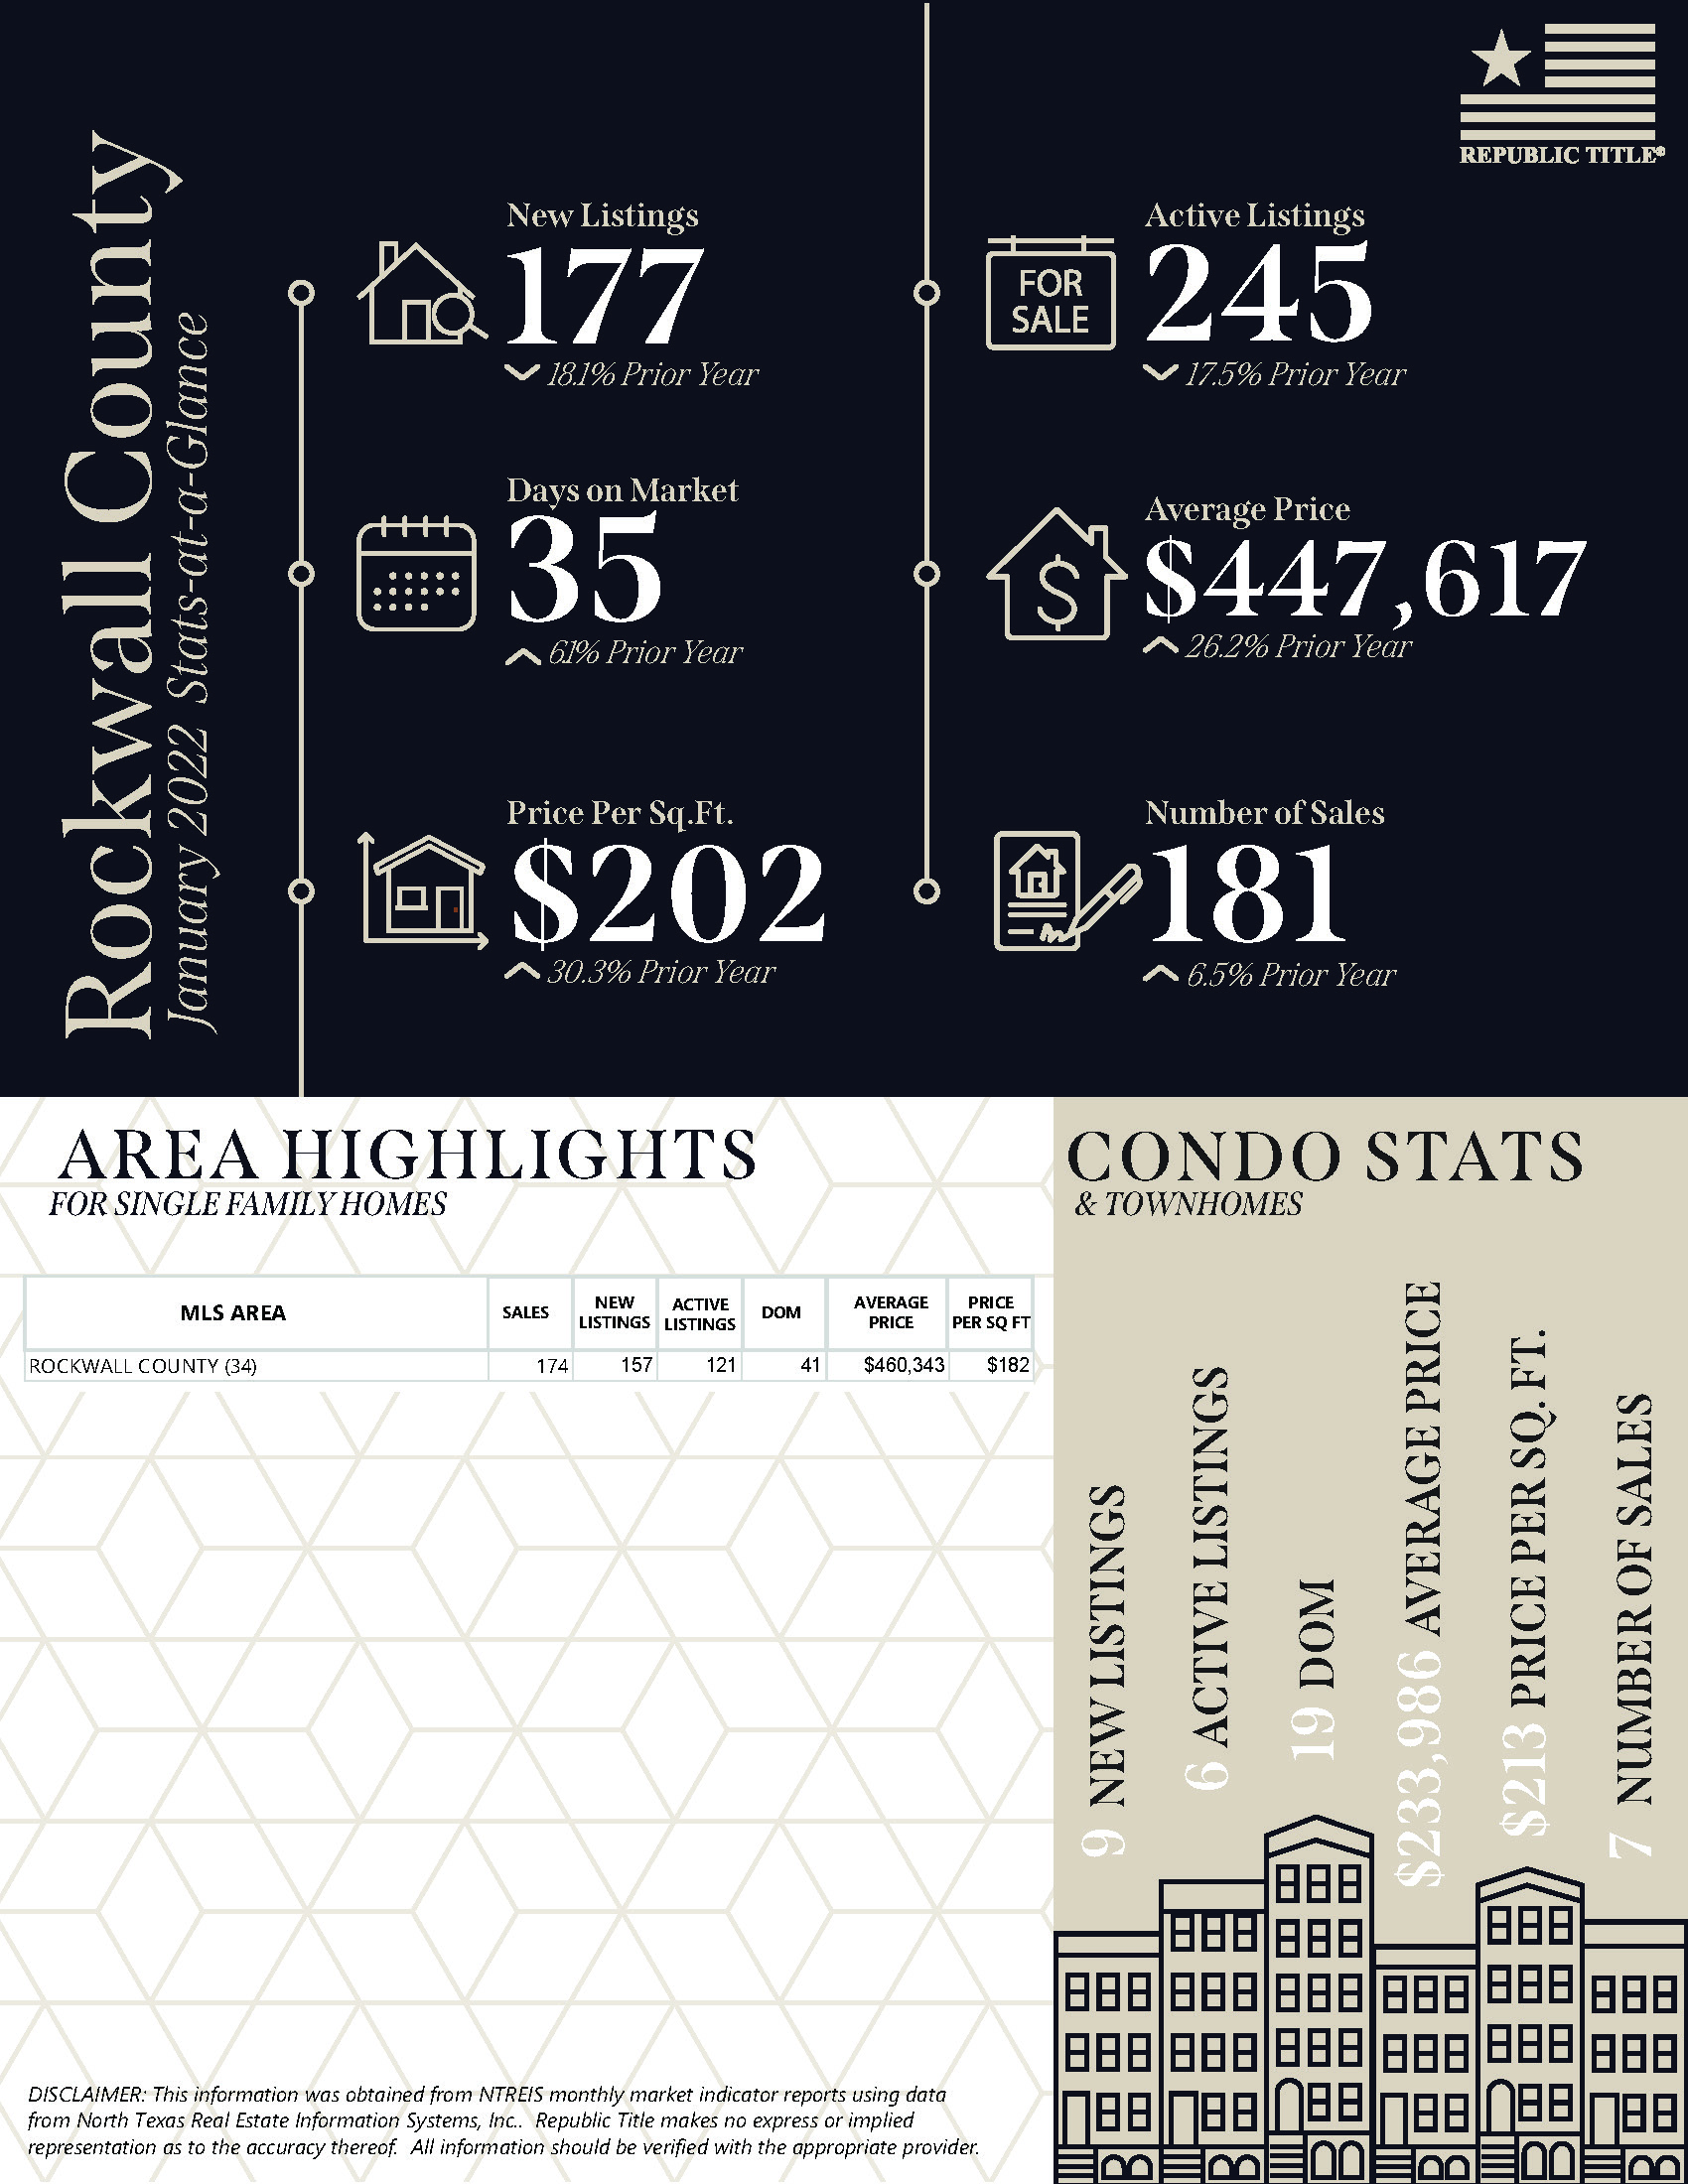
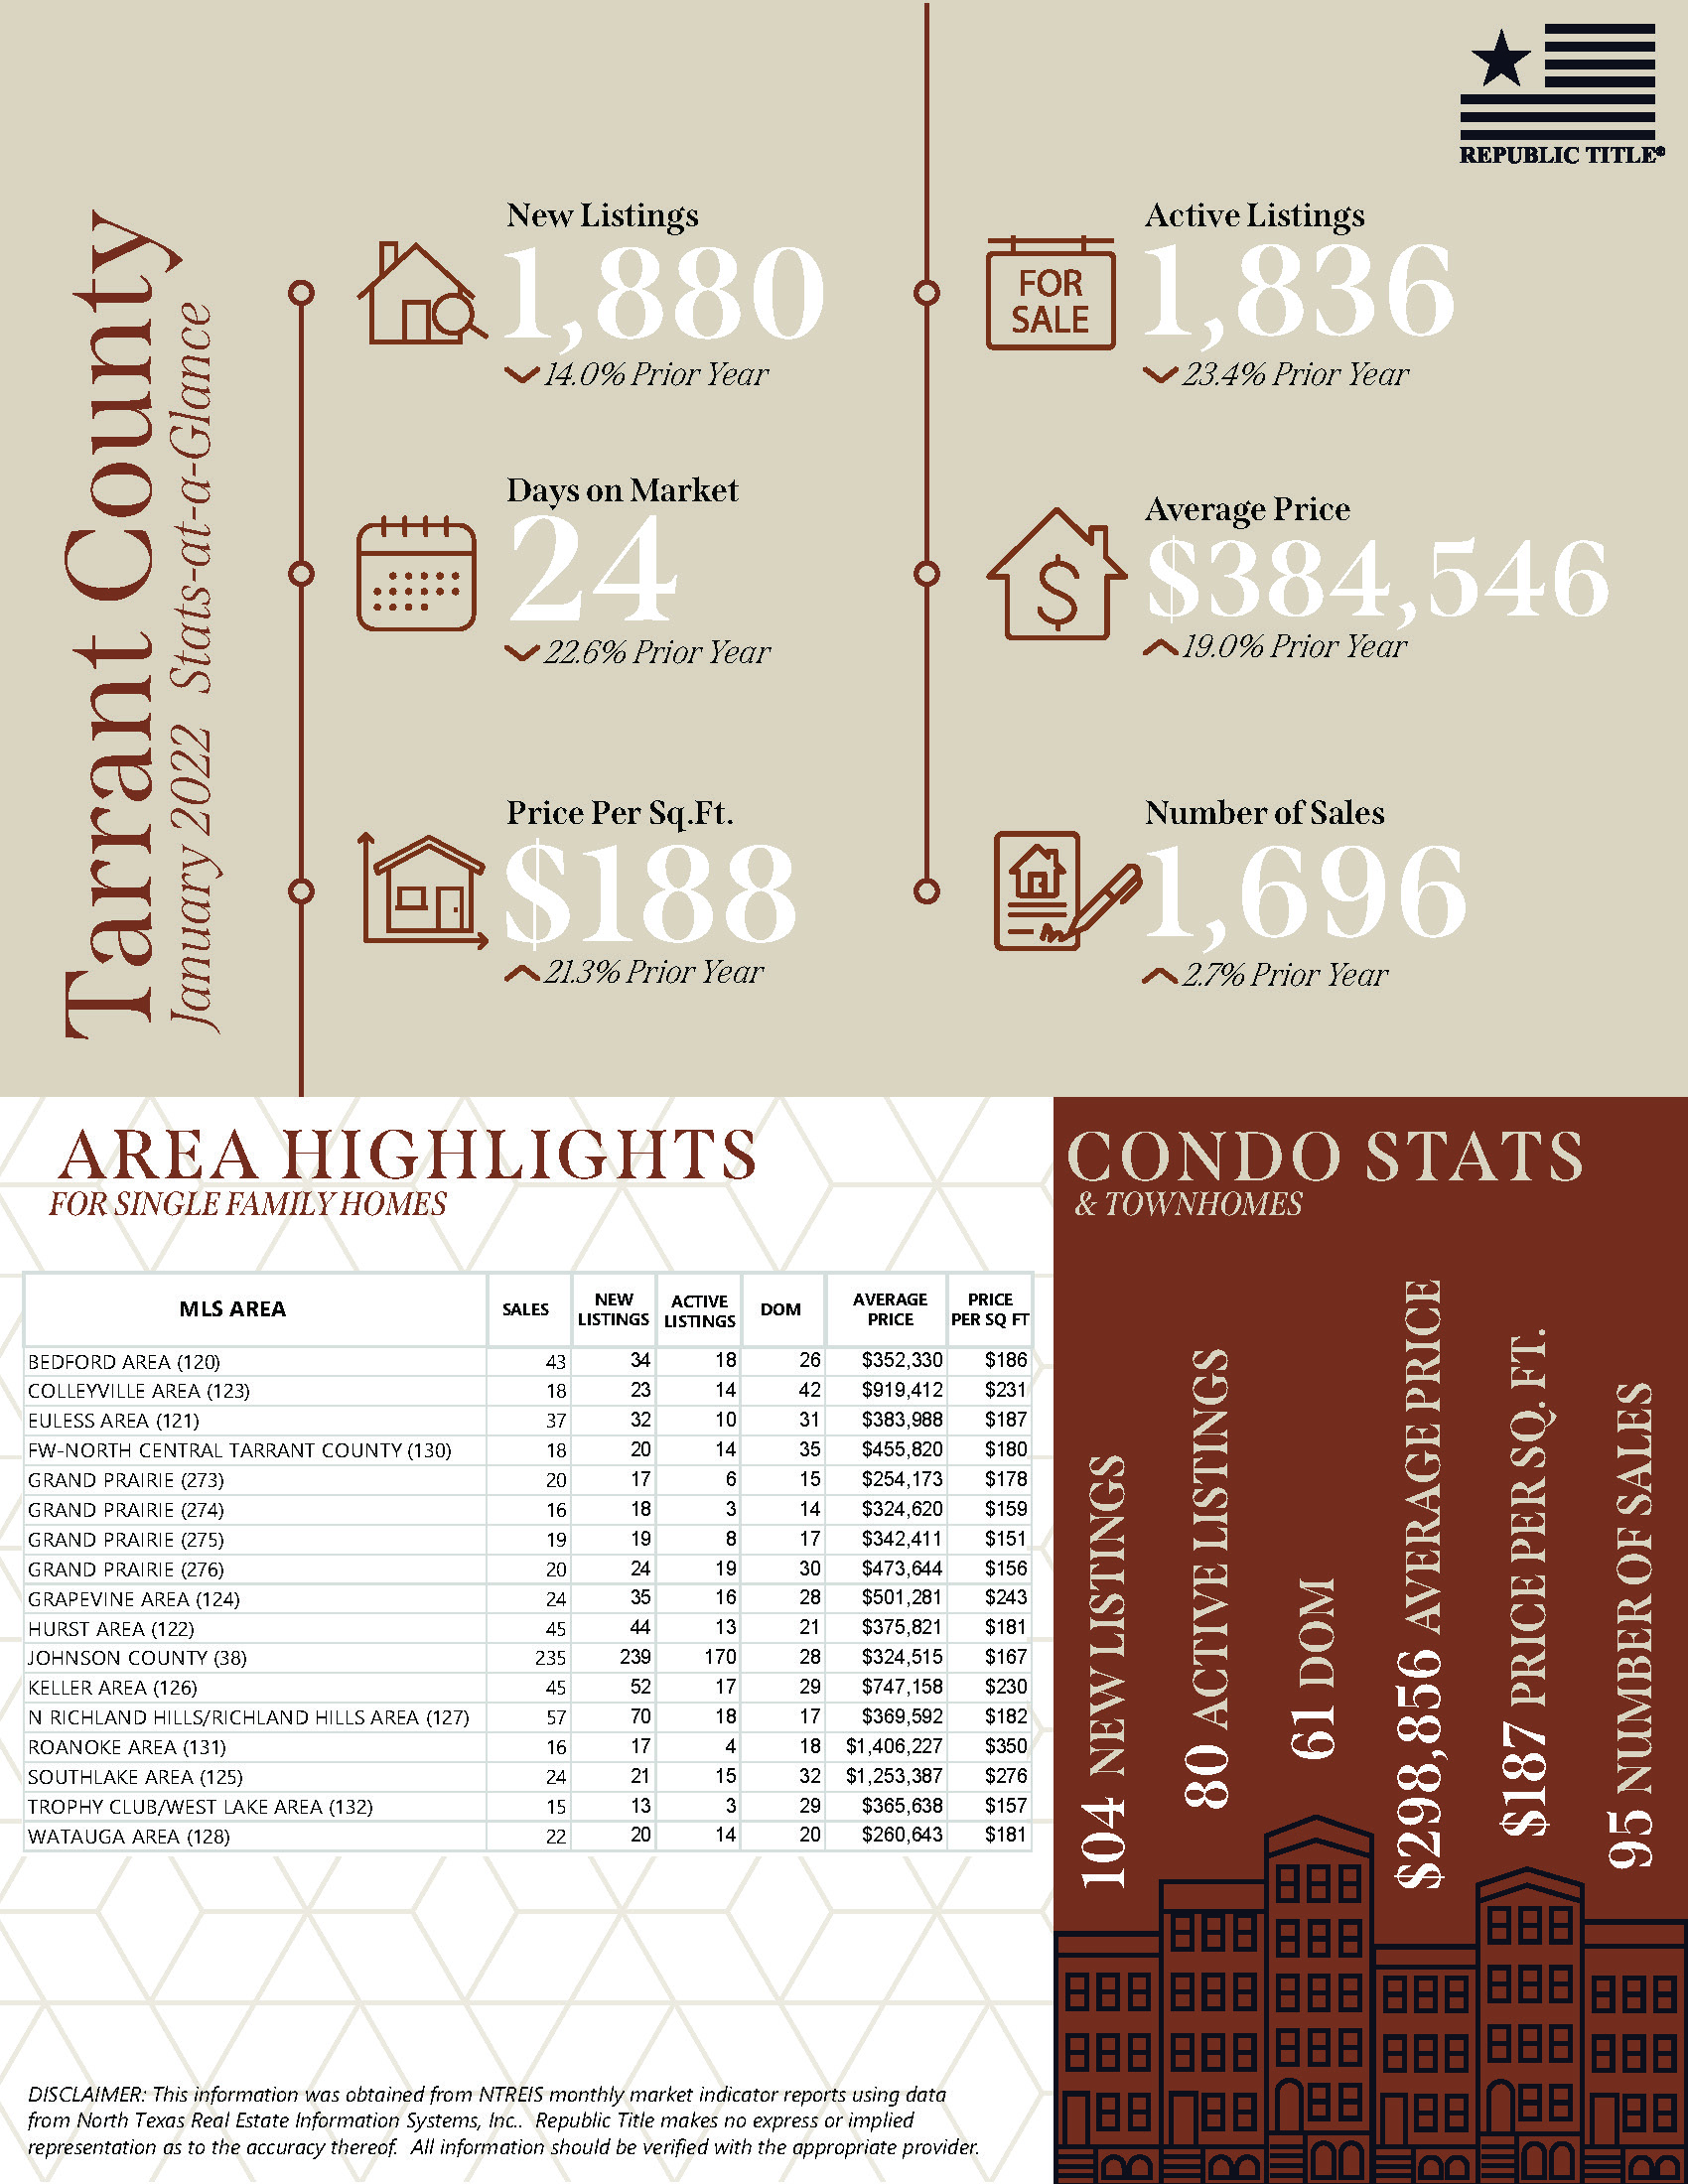
In reviewing Collin, Dallas, Denton, Rockwall, and Tarrant Counties, new listings were down in all counties except Rockwall. In Rockwall County, new listings were up by almost 10% over the same time last year. Active listings were down in September by almost 30%, which is slightly better than it was last month. The average days on market was 20 days, proving that lack of inventory is still a major factor for the real estate market in North Texas. However, the average sales prices and price per square foot are still up from last year. We are still enjoying a strong seller’s market in the DFW Metroplex! Happy Selling!
August 2021 North Texas real estate stats are out and we’ve got the numbers! Our stats infographics include a year over year comparison and area highlights for single family homes and condos broken down by MLS area. We encourage you to share these infographics and video with your sphere.
August 2021 is a wrap and the stats are out! In reviewing the five counties of Collin, Dallas, Denton, Rockwall and Tarrant, new listings were down an average of 4.48% compared to 2020, while active listings were down almost 33%. The days on market averaged out to 16, proving once again that the lack of inventory is still a factor in North Texas. What is up are the average sales prices and thus the price per square foot with the highest gain in Dallas county, up 58.2% from last year. The numbers don’t lie, we are still enjoying a strong seller’s market in the DFW Metroplex! Happy Selling!
July 2021 North Texas real estate stats are out and we’ve got the numbers! Our stats infographics include a year over year comparison and area highlights for single family homes and condos broken down by MLS area. We encourage you to share these infographics and video with your sphere.
New listings are staying on par with where they were in July 2020, in Collin, Dallas, and Denton counties, down just slightly. However, in Rockwall and Tarrant listings are up an average of about 10%. The average sales prices across all five counties have risen to an average of about 20% above last years’ listing prices. The numbers don’t lie, the summertime market in North Texas is still hot!
For more stats information, pdfs and graphics of our stats including detailed information by MLS area and condo stats, visit the Resources section on our website at https://www.republictitle.com/residential-resources/
For the full report from the Texas A&M Real Estate Research Center, click here. For NTREIS County reports click here.
June 2021 North Texas real estate stats are out and we’ve got the numbers! Our stats infographics include a year over year comparison and area highlights for single family homes and condos broken down by MLS area. We encourage you to share these infographics and video with your sphere.
New listings are almost exactly where they were in June 2020 and down an average of just 3% in all five counties. Interestingly, the number of sales are up in only Collin and Dallas counties and down an average of 8% in Denton, Rockwall and Tarrant counties. The average sales price has risen to an average of over 25% across all counties. As it’s been all summer long, it is a great time to be a seller in the North Texas real estate market, so now is the time to list if you’ve been on the fence.
For more stats information, pdfs and graphics of our stats including detailed information by MLS area and condo stats, visit the Resources section on our website at https://www.republictitle.com/residential-resources/
For the full report from the Texas A&M Real Estate Research Center, click here. For NTREIS County reports click here.
What does a vault have to do with an eClosing? Plenty. As eClosings become more common, fundamental elements of the mortgage process will change. For example, instead of a paper promissory note, you may have an eNote and eVault. The note is one of the key lender documents within a loan package that borrowers sign at closing. It’s the borrower’s written promise to repay the loan within the specified term. The note is also very important to investors who buy and sell them on the secondary market. The note plays an important part in a mortgage backed security. Think of an eNote as the electronic version of a paper note. The eNote gets electronically signed instead of wet signed at closing. You must be able to identify the original version of the eNote. Think of the electronic version as a PDF. There could be infinite versions of it floating around. How do investors know the version they are buying is the original? To solve this, the mortgage industry got smart and did two things:
They created the MERS eRegistry, the legal system of record for identifying the controller and location of the authoritative copy of the eNote.
Created standards for how to store eNotes in something called an eVault.
eVaults are technology platforms that are built to support the handling, status, and storage of eNotes. They always have integrations to the MERS eRegistry and often have integrations to other eVaults and trading partners. The MERS eRegistry is the librarian of the eNote world. It tracks who controls each eNote and in which eVault it is stored. When a lender creates an eNote, they register it with the MERS eRegistry which notifies the librarian of the controller and location of the eNote. If you are exposed to an eNote, now you know what a vault has to do with it.