All measurements are calculated using seasonally adjusted data, and percentage changes are calculated month-over-month, unless stated otherwise.

August saw a fall in home sales and a continued rise in building permits. New listings increased almost 14 percent, driven largely by the Houston metro recovering after Hurricane Beryl. The storm did not have the same degree of impact on sales. Home prices fell slightly to $335,494.
Sales Dip, New Listings Bounce Back
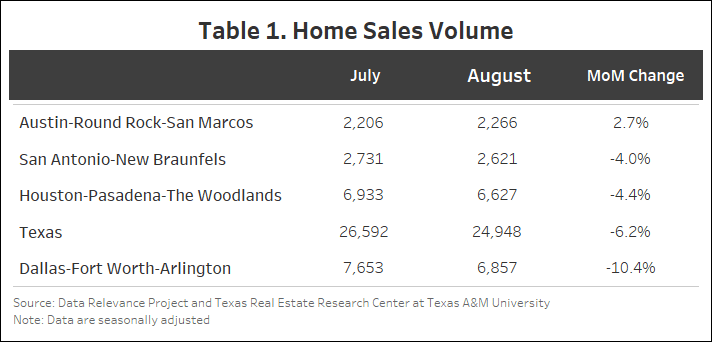
After bouncing back in July, statewide seasonally adjusted home sales dropped 6.2 percent month-over-month (MOM), resulting in 24,948 homes sold (Table 1). Dallas had the largest decrease among the Big Four at 10.4 percent (6,858), followed by Houston at 4.4 percent (6,628) and San Antonio at 4 percent (2,622). Austin was the only one among the Big Four to have an increase in August (2.7 percent), resulting in 2,267 homes sold.
The number of new listings increased by over 5,500, marking a 13.8 percent rise from July, in large part due to Hurricane Beryl. New listings plummeted the week of Hurricane Beryl with the following weeks making up for the decline. This increase spilled over into August, when new listings normally are in decline following the peak months of June and July. Houston saw a substantial increase of 44.9 percent (14,098), followed by Austin at 27 percent (3,543) and Dallas at 12.5 percent (11,349). San Antonio had the smallest addition among the Big Four, with a 5.8 percent increase (4,060).
The state’s average days on market (DOM) increased by one day to 61 days. Dallas had the largest increase—from 52 to 55 days, a 7 percent increase. Similarly, Austin increased from 68 to 70 days. Houston and San Antonio both rose by one day and are currently at 52 and 74 days on market, respectively.
Texas’ number of active listings increased from 116,294 to 120,129 (3.3 percent). Active listings across the Big Four rose in August with Dallas, San Antonio, and Houston increasing by 4.3 percent (26,835), 1.5 percent (14,093), and 3.5 percent (28,456), respectively, while Austin rose by 0.1 percent (11,519).
Statewide pending listings have begun increasing with 1,368 additional pending listings in August. The pending listings across the Big Four have been mixed with Houston (7,294) and Austin (2,616) increasing by 18.6 and 15 percent, respectively. Meanwhile, San Antonio (2,235) and Dallas (6,170) declined by 20 percent and 14.7 percent, respectively.
Interest Rates on the Decline
Treasury and mortgage rates both declined in August but at a much faster rate than the month before. The average ten-year U.S. Treasury Bond yield fell 38 basis points to 3.87 percent. The Federal Home Loan Mortgage Corporation’s 30-year fixed-rate fell by 35 basis points to 6.5 percent.
Single-Family Permits Grow at a Slower Pace
Statewide, building permits increased at a lower rate in August, up 1.59 percent MOM after a 29 percent increase in July. Houston grew by 7.3 percent and Dallas by 2.2 percent. Austin and San Antonio, on the other hand, fell by 8.1 and 7.3 percent, respectively.
Single-family construction starts grew after monthly declines since March 2024. Seasonally adjusted statewide single-family starts increased by 8 percent MOM to 13,564 units. Houston and Austin rose by 20 and 17 percent, respectively, while San Antonio increased by comparatively less (2.5 percent). Meanwhile, Dallas decreased by 0.6 percent.
The state’s total value of single-family starts climbed from $20.28 billion in August 2023 to $26.13 billion in August 2024. Houston accounted for 35.7 percent of the state’s total starts value followed by Dallas with 27.1 percent.
Home Price Dip Slightly
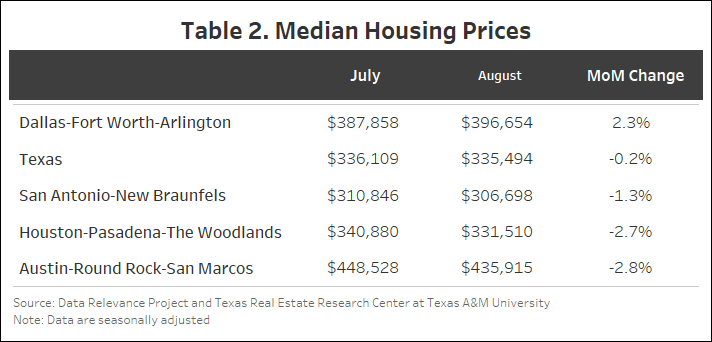
Texas’ median home price fell 0.2 percent MOM in August from $336,109 to $335,494 (Table 2). Houston fell by 2.7 percent to $331,510 while Dallas rose by 2.2 percent to $396,654. Austin fell the most among the Big Four, by 2.8 percent to $435,915. San Antonio fell by 1.3 percent to $306,698.
The Texas Repeat Sales Home Price Index (Jan 2005=100), which is a more accurate reflection of home price changes, fell 0.5 percent MOM in August but increased 1.1 percent year over year (YOY). Austin’s annual appreciation remains below the state’s average and fell by 3.9 percent YOY in August.
Source: Texas Housing Insight | Texas Real Estate Research Center (tamu.edu)
BY JOSHUA ROBERSON, RHUTU KALLURJunqing Wu (October 9, 2024)