Total Texas housing sales plummeted 16.1 percent in February as Winter Storm Uri swept across the state, causing widespread power and water outages. Before the freeze, however, sales were at record levels and should rebound in March as indicated by the Texas Real Estate Research Center’s single-family sales forecast. The number of new homes added to the Multiple Listings Service (MLS) was also negatively affected by the wintery weather, exacerbating the limited supply issue. Building permits and housing starts decreased on a monthly basis but remained elevated overall, which bodes well for construction activity this year. Additionally, improved economic growth and inflation expectations contributed to rising mortgage interest rates, the continuation of which may slow the current breakneck pace of sales. Depleted inventory is the greatest challenge to Texas’ housing market, assuming the pandemic remains contained.
Supply1
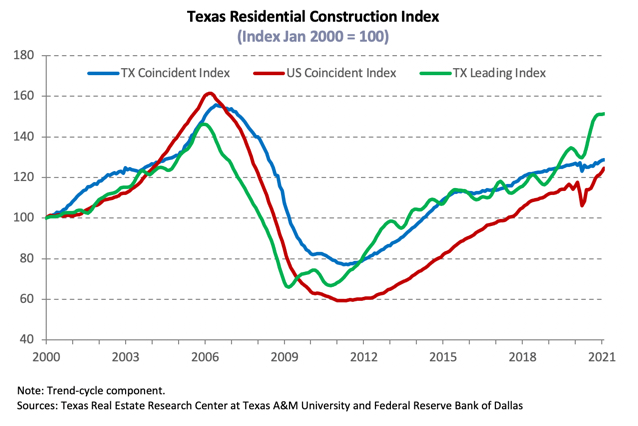
The Texas Residential Construction Cycle (Coincident) Index, which measures current construction levels, ticked up as industry employment and wages improved. The Residential Construction Leading Index also continued its upward trajectory due to overall elevated building permits and housing starts despite monthly contractions, pointing toward increased construction in the coming months. Similarly, the metropolitan leading indexes suggested future activity to be favorable. Only in Houston, where permits and starts fell significantly, did the metric indicate an impending slowdown in building.
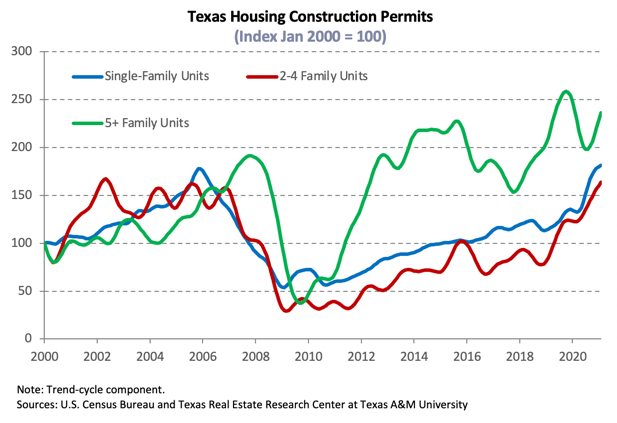
Single-family construction permits declined for the second straight month in February, dropping 12.4 percent. Nevertheless, issuance exceeded its 2006 average and elevated 20.8 percent compared with last year on a year-to-date (YTD) basis. Dallas-Fort Worth continued to lead the nation with 3,796 nonseasonally adjusted permits, followed by Houston at 3,395 permits. Issuance in Austin decreased to 1,862 permits but still remained well above pre-Great Recession levels. Although San Antonio’s metric ticked down to 1,000 permits, the overall trend persisted upward. Similarly, Texas’ multifamily permits sank 11.5 percent; year-over-year comparisons, however, were largely positive.
Amid rising lumber prices and utility outages across the state, total Texas housing starts fell 6.2 percent. Single-family private construction values decreased 13.3 percent in real terms after flattening the previous month. Monthly fluctuations in Houston construction values reflected broader movements in the statewide metric, while Austin and Dallas values normalized from record activity. San Antonio values also corrected downward in February after increasing by a third of December levels, flattening at its year-long average.
Although sales declined, the number of new MLS listings plunged to its lowest measure since the economic shutdown last spring, pushing Texas’ months of inventory (MOI) down to an all-time low of 1.5 months. A total MOI around six months is considered a balanced housing market. Inventory for homes priced less than $300,000 was even more constrained, dropping below 1.2 months. Even the MOI for luxury homes (homes priced more than $500,000) slid to 2.7 months compared with 5.8 months a year ago.
The supply situation in Austin and North Texas was even more critical than the statewide metric. Inventory expanded minimally in Austin’s mid-range price cohorts, but the overall MOI flattened at 0.5 months. Meanwhile, Dallas and Fort Worth’s metric fell to 1.1 and 1.0 months, respectively. On the other hand, the Houston MOI remained highest out of the major metros despite ticking down to 1.9 months. Fluctuations in San Antonio inventory matched the state average.
Demand
After a solid start to the year, total housing sales decreased 16.1 percent in February during severe disruptions to the state’s power grid due to the winter storm. Activity declined across the price spectrum from record transactions the month prior for all but the bottom price cohort (less than $200,000). Still, luxury home sales remained in positive YTD growth territory. The sales composition continued with shift toward homes priced more than $300,000 due to depleted inventory and rising building costs.
Luxury home transactions remained positive YTD in the major Metropolitan Statistical Areas (MSAs). Nevertheless, total sales fell 18.3 and 19.7 percent in San Antonio and Houston, respectively, and trended downward in Austin and North Texas. Austin sales plummeted 23.6 percent, but the list-to-sale-price ratio climbed above 1.0 for the fourth consecutive month, indicating especially robust demand. Dallas sales sank 13.1 percent on top of revisions to January data that revealed only modest improvement at the start the year after a sluggish fourth quarter. Fort Worth was the exception, with activity down from year-end levels across the price spectrum. Moreover, total sales declined for the second straight month, registering a 15.3 percent drop in February.
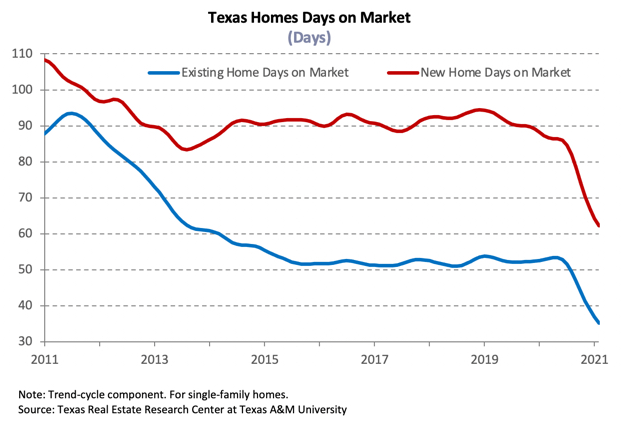
Although Texas’ average days on market (DOM) flattened at 42 days, it still hovered at an all-time low and shed more than two weeks off its year-ago reading, corroborating strong demand as low mortgage rates remained favorable to homebuyers. The metric also stabilized across the major metros, albeit at lower levels in markets of exceptionally low inventory where available listings were snapped up after just 26 days in Austin and 33 and 30 days in Dallas and Fort Worth, respectively. The average home in Houston and San Antonio sold at a rate closer to the state measure, staying on the market for 41 days in Houston and 44 days in San Antonio.
Progress on the vaccine front and an approved third fiscal stimulus package resulted in higher growth and inflation expectations for 2021. The ten-year U.S. Treasury bond yield rose to an annual high of 1.3 percent2 in February. The Federal Home Loan Mortgage Corporation’s 30-year fixed-rate ticked up for the second straight month to 2.8 percent, although the metric still hovered around historically low rates (series starting in 1971). Further increases in mortgage rates this year may soften housing demand and slow home-price appreciation. Mortgage rates remained low within Texas during January3, sinking to 2.66 percent for non-GSE loans, while the median interest rate for GSE loans was 2.80 percent. February home-purchase applications were affected by the winter storm, falling 14.8 percent YTD but remaining positive relative to year-ago levels. Similar fluctuations were observed in refinance activity as lenders added more requisites and the pool of households able to refinance shrank. (For more information, see Finding a Representative Interest Rate for the Typical Texas Mortgagee.)
Prices
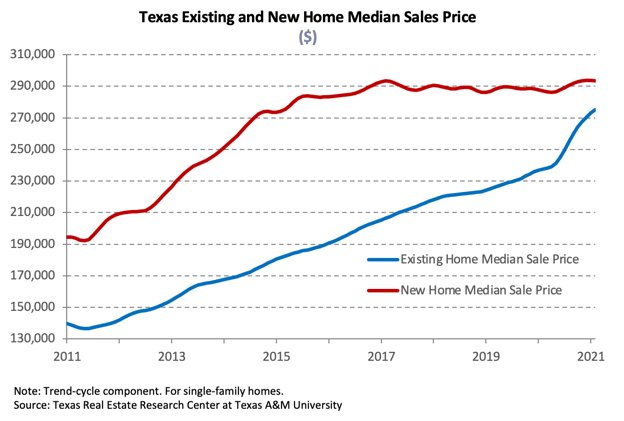
Although sales activity slowed during the winter storm, the Texas median home price continued to post strong growth, accelerating 13.2 percent year over year (YOY) to $280,400. A shift in the composition of sales toward higher-priced homes due to constrained inventories at the lower end of the price spectrum contributed to the rise in prices. In Austin and Dallas, where the luxury home market share increased by more than 10 percentage points from last February, the median home price skyrocketed by a record 22.4 and 16.9 percent annually to $398,700 and $344,500, respectively. The Fort Worth metric ($287,900) also rose by an unprecedented 15.7 percent YOY, while San Antonio’s ($268,200) and Houston’s ($281,700) median home prices elevated 11.0 and 12.2 percent, respectively.
The Texas Repeat Sales Home Price Index accounts for compositional price effects and provides a better measure of changes in single-family home values. The index corroborated increased home-price appreciation, climbing 10.4 percent YOY, but the rate was less than the surge in the median home price suggested. Houston’s metric rose by a relatively moderate 7.5 percent, less than the average price appreciation in 2014. The Dallas and Fort Worth indexes jumped 11.4 and 11.7 percent, respectively. On the other hand, the index in Central Texas was more or less in line with median price growth, soaring 23.3 percent in Austin and 10.4 percent in San Antonio. Home-price appreciation unmatched by income improvement will continue to chip away at housing affordability in 2021, especially as mortgage rates rise.
Single-Family Forecast
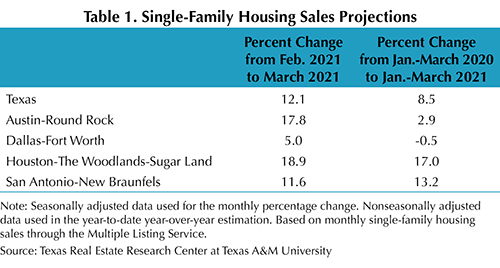
The Texas Real Estate Research Center projected single-family housing sales using monthly pending listings from the preceding period (Table 1). Only one month in advance was projected due to the uncertainty surrounding the COVID-19 pandemic and the availability of reliable and timely data. Texas sales are expected to rebound 12.1 percent in March from the impacts of the winter storm that swept across the state in February. The recovery in Houston and San Antonio is predicted to surpass the state average as single-family sales improve about 17.0 and 13.2 percent, respectively. Austin and DFW sales activity will likely be more subdued, but first quarter transactions should still exceed 1Q2020 levels.
Source – James P. Gaines, Luis B. Torres, Wesley Miller, Paige Silva, and Griffin Carter (April 12, 2021)
https://www.recenter.tamu.edu/articles/technical-report/Texas-Housing-Insight

