
Texas had an uptick in home sales in May. At the same time the level of active listings continued to drop, resulting in shorter market times to sell and price growth. The market time shrunk for the first time since March 2022, now standing at 56 days. The median price has steadily increased by 0.4 percent each month this year but is still $15,000 short of the record high level from a year ago.
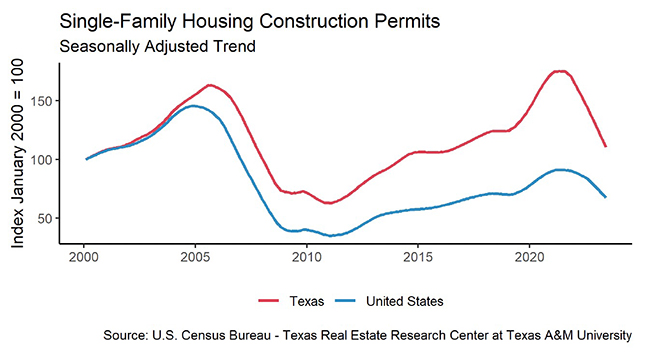
Supply* Recedes after the Two-Year Boom
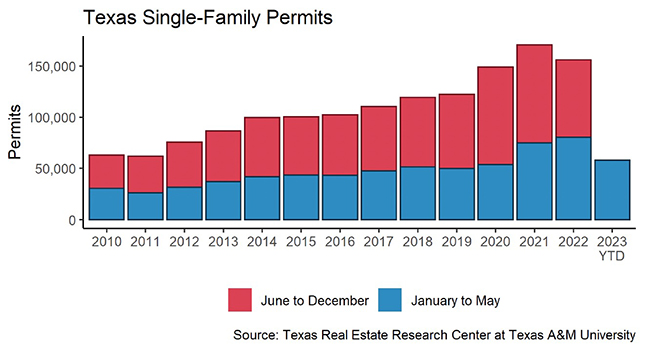
Single-family construction permits moderately declined less than one percent from the previous month to 12,305 units. Dallas and Houston both showed massive changes with Dallas declining by 13.3 percent to 3,159 permits, while Houston surpassed its 2022 building permits by 5.8 percent to 4,546 permits. The issuance difference ballooned quickly from 136 permits in April to more than 1,300 permits in May. Austin and San Antonio moderately changed with Austin rising by 4.3 percent to 1,068 units, while San Antonio decreased by 8.8 percent to 684 units. The split between the four major metros was the cause for Texas’ moderate decrease in May.
Single-family construction starts rose for the second month to 10,725 units in May. Despite the recent rebound, the number of construction starts shrank more than 20 percent compared with a year ago. Dallas recorded the only increase this month in the Texas Triangle with a 6.2 percent increase to 7,258 units. Construction generally hits a seasonal low in winter and peaks in spring or summer.
The state’s total single-family starts value reached $12.8 billion in May, a decline from $19.7 billion recorded in 2022. Investment value contracted in all four major metros, with Houston suffering the largest loss. The energy hub had a substantial 39.1 percent decrease in single-family starts value from January to May compared with the previous year. This was equivalent to a net loss of $2.3 billion worth of real estate investment. While the housing market underwent a cooldown, the rental market displayed Texans’ consistent need for extra space. Multifamily starts value inched up by 3.1 percent year-to-date (YTD), and Dallas and Houston—the two most populated metros—contributed mostly to the growth.
The number of active listings continued its downward trajectory, reaching 79,278 units, representing a decrease of just over 1 percent from the previous month. The big four metros recorded the largest drops in listings while the rest of Texas counteracted their decrease that kept the statewide change at only a slight decrease from April 2023. The number of new listings increased just over 2 percent to 37,812 units, with Houston accounting for the only increase. Months of Inventory (MOI) dipped to 2.6 months. This trend is in large part due to Dallas and Houston’s MOI decreasing by 8 percent and 19 percent, respectively.
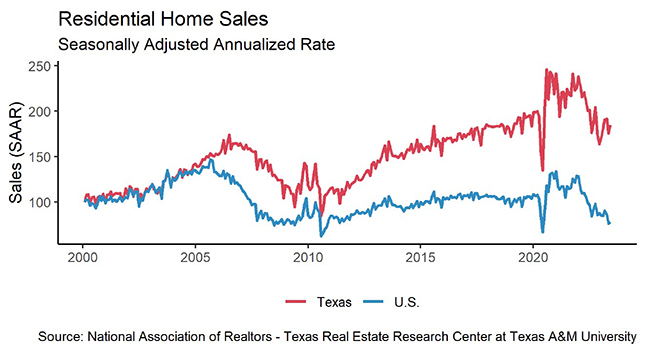
Housing Market Sees Shortened Sale Time for First Time in 14 Months
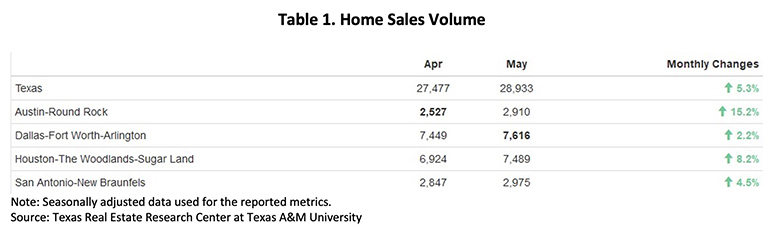
Total home sales recovered half of the losses from April’s month-over-month (MOM) slump and expanded to 28,933 transactions, equivalent to a 5.3 percent MOM increase (Table 1). All four metropolitan areas experienced significant growth in sales volume. Austin showed the highest monthly elevation with a double-digit growth rate, catching up to San Antonio’s sales level with over 2,900 transactions. Houston had the second most impressive rate at 8.2 percent, bridging the gap between Dallas’ single-family transactions.
Sales in Houston rose across all price cohorts in May, with the most significant rises in the two tails—below $200,000 and above $750,000—both of which rose over 20 percent. However, compared with May 2022, sales for all price cohorts decreased, especially for homes priced over $300,000.
Texas’ average days on market (DOM) retreated for the first time since March 2022, falling three days to 56, straying away from the historical norms rate that it was approaching. Compared with the five-year average of 59 days before 2020, the lack of available homes in the market is becoming more competitive for buyers as three out of the four major metros recorded a decrease in DOM. Dallas recorded the biggest drop to 51 DOM, over a 7 percent decrease from the previous month. Houston and San Antonio were the only two MSAs that did not record a downtick, as the readings balanced at 52 and 68 days, respectively.
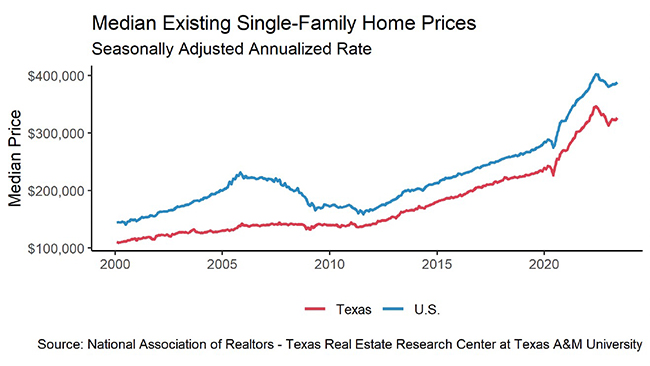
Prices Make Steady, Small Gains Despite Volatility in Sales
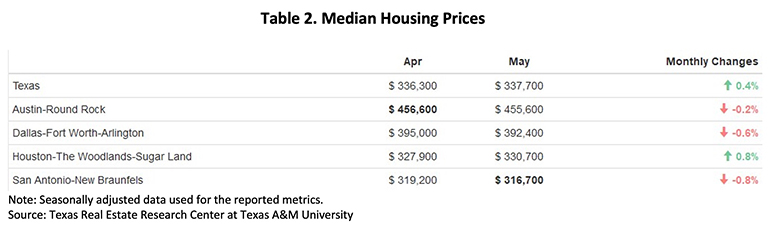
Texas’ median home prices exhibited strength with consistent increases throughout the year. The price rose steadily by 0.4 percent every month since the beginning of 2023, progressing from $331,900 in January to $337,700 in May (Table 2). Despite marginal downticks in Austin, Dallas, and San Antonio, growth in Houston along with the rest of the state maintained the state’s overall price growth.
Texas, as well as all four major metropolitan areas, experienced lower in median home prices compared with the previous year. Austin saw decreases of 15.3 percent, while Dallas, San Antonio, and Houston saw decreases of 5.9 percent, 4.4 percent, and 3 percent, respectively. These price drops indicate the real estate industry is still in the process of recovering from the price correction observed in the second half of 2022.
Because of the price correction, housing appreciation slowed. The Texas Repeat Sales Home Price Index accounts for compositional price effects and provides a better measure of change in single-family home values. The Texas index was mostly the same, gaining 0.1 percent year over year (YOY). The only metro with annual appreciation was Houston, which recorded a 1.5 percent YOY increase. Similar to the state’s median price trend, the four metros all recorded steady growth for the past five consecutive months.
Mortgage rates typically follow Treasury rates. The ten-year U.S. Treasury Bond yield grew 11 basis points MOM to reach 3.6 percent. Likewise, the Federal Home Loan Mortgage Corporation’s 30-year fixed-rate increased moderately to 6.43 percent, up nine basis points from April.
____________________
* All measurements are calculated using seasonally adjusted data, and percentage changes are calculated month over month, unless stated otherwise.
Source – Joshua Roberson, Weiling Yan, and Koby McMeans (July 11, 2023)
https://www.recenter.tamu.edu/articles/technical-report/Texas-Housing-Insight