The housing market continued to slow down as people consider mortgage rates and recession fears when making financial decisions. On the supply side, housing permits and housing starts are both in decline. Prices are correcting, and the market is accumulating inventory. However, as suggested by the sales volume, buyers are calmer now than during the pandemic frenzy, as many key indicators such as days on market (DOM) and months of inventory (MOI) are uniformly converging back to pre-pandemic levels. With the expectation of a higher mortgage interest rates annual average in 2023, existing-home sales will likely fall short of 2022’s levels.
Supply1
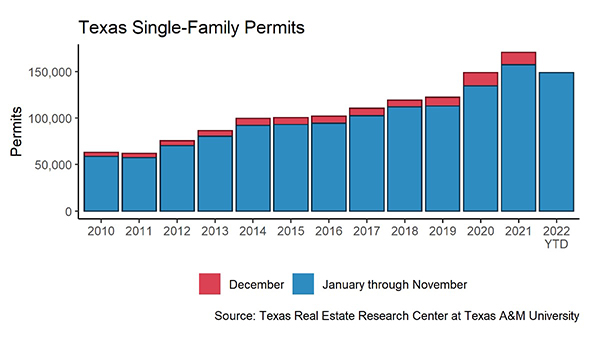
Homebuilders are initiating fewer building projects. The state’s year-to-date cumulative single-family construction permits in November 2022 had a net loss of 5.2 percent, shrinking from 157,043 to 148,954 units. The monthly drop paused in November, and construction permit issuance remained below 10,000 units. Construction permits rebounded in all major metros except Austin. Dallas (2,886 permits) gained more than 300 permits, while issuance in Houston (3,223 permits) stayed steady. Despite the slight decrease in Austin, the tech metro (1,341 permits) expanded residential space for single-family homes twice as fast as in San Antonio (663 permits). Construction generally slows during the winter, yet even after the seasonal adjustment, Texas’ single-family construction starts plummeted 28.5 percent from 2021 to 10,700 units, corroborating a slowdown in the housing industry.
The number of homes for sale typically declines after the summer peak. However, active listings have been quickly accumulating to a seasonally adjusted level of 91,600 units. Compared with the five-year average of 94,800 units before the pandemic, this November’s housing inventory level is only 4.5 percent away from rebounding back to the pre-pandemic volume, rather than 50 percent a year ago. Amid the rebound, Texas’ MOI ticked up to 2.9 months. Austin’s inventory level jumped to a ten-year high with 9,000 homes ready for sale, while Dallas’s housing supply was tight with 20,000 homes for sale, 3,700 fewer than in November 2019.
Demand
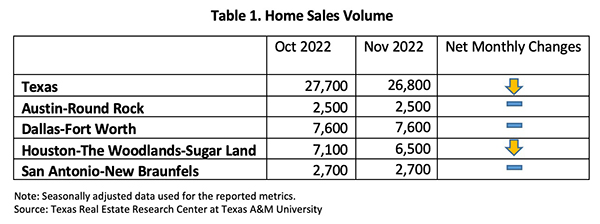
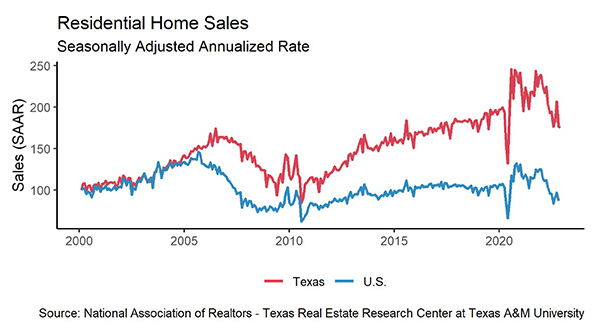
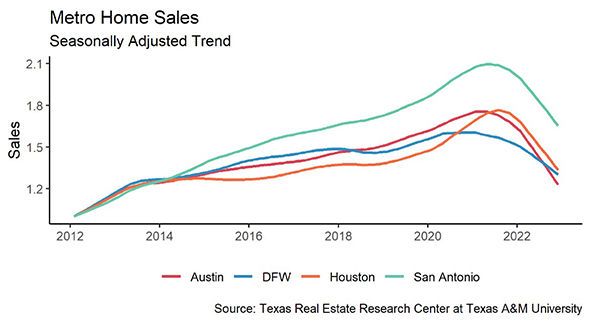
Total home sales inched down 3.3 percent month over month (MOM), settling at a seasonally adjusted rate of 26,800 closed sales (Table 1). Sales in Houston took a big hit, while sales in the other major metros stayed at October levels. Texas’ sales volume has shrunk by one tenth compared with a year earlier. As winter approaches, sales are expected to trend downward for the next two months.
Rising mortgage rates affect sales of differently prices homes disproportionately. Up to November, total sales for homes priced below $300K plummeted close to 30 percent in 2022, while total sales grew 15 percent for homes priced between $400K and $500K. The sales disparity between these two groups could suggest that rising rates sidelined more homebuyers in the lower-middle class than upper-middle class.
Amid slowing sales, homes are sitting on the market longer. Texas’ average DOM rose to 46 days. Compared with the five-year average of 59 days before 2020, the relatively brief period suggests the housing market is still relatively tight compared with historic norms. At the metropolitan level, Austin’s DOM rose most aggressively, doubling from 27 days in June to 57 days in November. Dallas’ DOM grew most moderately, rising from 25 to 42 days.
Before the pandemic, the state’s DOM ranged from 55 days to 83 days. Now, DOM ranged from 45 days to 52 days. The relatively truncated DOM interval implies the housing market still has room to improve. Another metric that signals the housing market can be more relaxed is DOM for pricier homes. Typically, the most expensive homes sit on the market the longest. However, DOM for homes priced over $750K was 45 days—shorter than homes in the $500K price cohort.
Prices
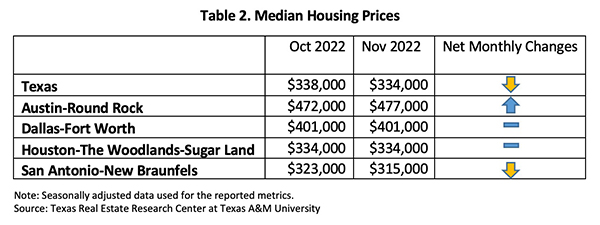
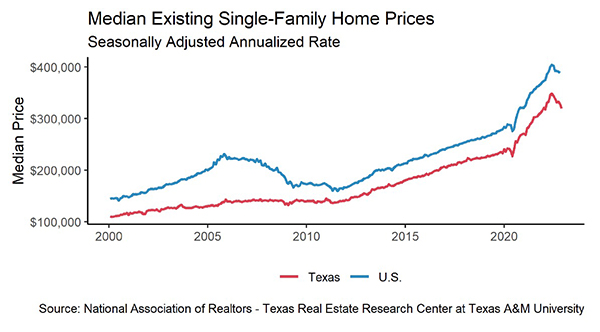
Texas’ median home price continued to fall, and the seasonally adjusted median price edged down 1 percent MOM. The four major metros posted mixed monthly changes (Table 2). Regardless of the depreciation in the past six months, the state’s median price remained 6.1 percent higher than year-ago levels. Dallas had the highest growth of 9.6 percent, while Austin’s growth rate deflated to 0.1 percent.
Since the Federal Reserve imposed the first 75-basis-point interest rate hike in June in an attempt to curb inflation, the ten-year U.S. Treasury bond yield jumped 129 basis points to 3.89 percent2, while the two-year counterpart surged by 150 basis points. The spread between the ten- and two-year bond yields widened while staying in negative territory, indicating persistent market uncertainties.
The Federal Home Loan Mortgage Corporation’s 30-year fixed-rate moderated slightly this month to 6.81 percent, but it still surpassed historical rates during 2007 and 2009. According to a Wall Street Journal analysis, some buyers have had to dodge the conventional way of borrowing from traditional lenders and instead borrow directly from family members or leverage either business or personal assets.
The Texas Repeat Sales Home Price Index accounts for compositional price effects and provides a better measure of changes in single-family home values. Compared with November 2021’s 19.5 percent year-over-year (YOY) increase, Texas’ index accelerated 9.2 percent YOY in November 2022, indicating price moderation. The same trend also affected the major metros as growth rates shrank from double-digits to single-digits, except in San Antonio, which was 12.8 percent. Moderating home prices corroborated with the Fed’s inflation fight.
Household Pulse Survey
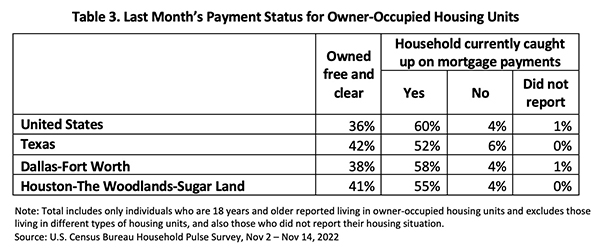
According to the U.S. Census Bureau’s Household Pulse Survey, after last year’s historical low rates, the share of homeowners who were free from mortgage payments ticked up 3 percent to 36 percent in the U.S. and up 5 percent to 42 percent in Texas (Table 3). The share of homeowners who were caught up on payments increased as well.
_________________
1 All measurements are calculated using seasonally adjusted data, and percentage changes are calculated month over month, unless stated otherwise.
2 Bond and mortgage interest rates are nonseasonally adjusted. Loan-to-value ratios, debt-to-income ratios, and the credit score component are also nonseasonally adjusted.
Source – Joshua Roberson and Weiling Yan (January 10, 2023)
https://www.recenter.tamu.edu/articles/technical-report/Texas-Housing-Insight

