All measurements are calculated using seasonally adjusted data, and percentage changes are calculated month-over-month, unless stated otherwise.

Home sales typically cool off by October, but this year is a little different with sales in both September and October higher than they were during the summer. The rate of new listings is still on the rise resulting in rising inventory levels. Home prices, on the other hand, have remained the same. Interest rates increased for the first time since spring 2024. Finally, new-home permits were flat this month, but housing starts made a strong month-over-month (MOM) push.
Sales Increase, New Listings follow
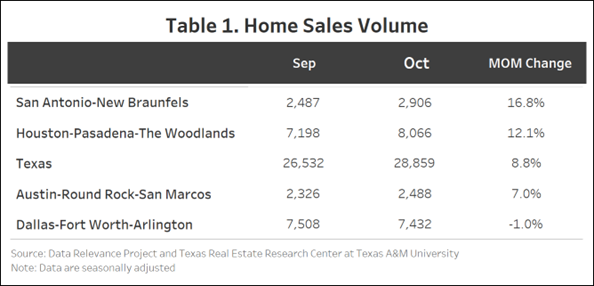
Unlike most years when sales activity is high in July and August and low in the last quarter, 2024 showed the opposite. Sales dipped in August and increased in October by 8.8 percent (28,859) (Table 1). San Antonio had the highest sales increase, reaching almost 17 percent (2,906), followed by Houston with 12 percent (8,066) and Austin at 7 percent (2,488). Dallas was the only city among the Big Four to see a decline in sales (1 percent, or 7,432).

New listings have been increasing since July 2024 and continued to increase in October. Among the Big Four, Houston and San Antonio experienced MOM increases of 10.3 percent (14,627) and 8.6 percent (4,447), respectively. San Antonio has been almost at a vertical incline since mid 2024. Dallas and Austin grew by 7.3 percent (12,063) and 5 percent (3,774), respectively.
The state’s average days on market (DOM) fell to 61 days in October, a two-day drop. Houston had the largest decrease—from 53 to 50 days, a 4.3 percent decrease. Austin also fell from 73 days to 71 days, a 3.3 percent decrease, followed by San Antonio, which went from 74 days to 73 days, a 2.1 percent decrease. Dallas was the only Big Four city to see an increase in DOM—from 54 to 56 days, a 4 percent increase.
Texas’ number of active listings increased from 122,192 to 124,663 (2 percent). There has been no significant activity in October across the Big Four. Houston increased by 2.4 percent (30,345) followed by Dallas at 1.8 percent (28,704). Austin had a 0.6 percent decrease in active listings (28,704), while San Antonio had almost no activity, remaining at 14,000 listings.
Statewide pending listings have decreased from 29,006 to 28,516, a 1.7 percent overall drop. Dallas saw a 5.4 percent increase in pending listings, from 7,717 to 8,133, followed by Austin at 2.4 percent (2,565). Dallas has been consistently increasing since August 2024. Houston rose by 2 percent (7,577), while San Antonio fell by 0.6 percent (2,854).
Interest Rates Bounce Back
Treasury and mortgage rates both increased in October with the average ten-year U.S. Treasury Bondyield up by 38 basis points, reaching 4.1 percent. The Federal Home Loan Mortgage Corporation’s 30-year fixed-rate rose by 25 basis points to 6.43 percent. October was the first month of increase for both rates since spring 2024. Additionally, both rates have increased even as the federal funds rate has continued to drop.
New-Home Starts Rally
Statewide, building permits increased by 0.9 percent MOM in October. Except for Dallas, the Big Four had an upward trend with Austin at 17.7 percent, San Antonio at 7.6 percent, and Houston at 1.6 percent. Dallas fell by 8.6 percent.
Seasonally adjusted statewide single-family starts increased 8.7 percent MOM to 14,332 units. Most of the Big Four had an uptick. San Antonio and Dallas had the highest increases at 30.3 percent (1,164) and 25.6 percent (3,813), respectively. Austin was up by 1.5 percent (1,555), while Houston fell 0.7 percent (4,393).
The state’s total value of single-family starts climbed from $25.4 billion in October 2023 to $32.07 billion in October 2024. Houston accounted for 35.3 percent of the state’s total starts value, followed by Dallas with 27.2 percent.
Home Prices Remain Steady
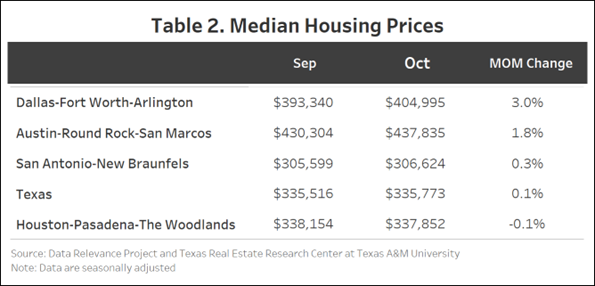
Texas’ median home price didn’t change in October, remaining at $335,000 (Table 2). Dallas grew the most—3 percent, from $393,340 to $404,995. Austin followed at 1.8 percent ($430,304 to $437,835). San Antonio rose by 0.3 percent, an increase slightly above $1,000, and currently stands at $306,624. Houston fell 0.1 percent to $337,852.

The Texas Repeat Sales Home Price Index (Jan 2005=100), which is a more accurate reflection of home price changes, fell 0.3 percent MOM in October but increased 1.6 percent year over year (YOY). Austin’s annual appreciation remains below the state’s average and fell by 1.5 percent YOY in October.
Source: Texas Housing Insight | Texas Real Estate Research Center (By Joshua Roberson, Rhutu Kallur, and Junqing Wu – January 13, 2025)

